Smartphones now power everyday activities, from mobile banking and digital payments to telehealth appointments and remote work. Businesses also rely on smartphones for customer engagement, field operations, and AI-powered productivity, making them central to both consumer and enterprise ecosystems. As adoption continues to grow and AI becomes a standard feature, the latest statistics reveal how smartphones are reshaping the global digital economy. Explore the data below to understand the trends driving the industry.
Editor’s Choice
- The world had around 5.1 billion unique mobile subscribers in 2025, representing approximately 70% of the global population.
- Global smartphone shipments are forecast to reach approximately 1.09 billion units in 2026, reflecting changing supply conditions and higher component costs.
- Smartphone shipments totaled 293.8 million units in Q1 2026, down 2.9% year over year.
- Mobile technologies contributed $7.6 trillion to the global economy in 2025, equivalent to 6.4% of global GDP.
- The average global smartphone selling price is expected to reach a record high in 2026 as manufacturers focus on premium devices.
- AI-enabled smartphones continued expanding across premium and mid-range segments throughout 2025, accelerating consumer upgrade cycles.
- Premium smartphones remain more resilient than entry-level models despite global supply challenges, particularly in developed markets.
Recent Developments
- Smartphone vendors increasingly prioritize on-device AI features such as writing assistance, image editing, and live translation across flagship and upper mid-range devices.
- Memory component shortages have become one of the largest challenges for smartphone manufacturers entering 2026, affecting production and pricing.
- Manufacturers continue shifting portfolios toward premium smartphones to offset rising production costs.
- Foldable smartphones continue recording annual shipment growth despite remaining a small share of the overall market.
- Satellite connectivity is expanding beyond emergency messaging into broader consumer smartphone offerings.
- Apple and Samsung remained the world’s two largest smartphone vendors entering 2026, while Xiaomi retained the third position globally.
- Vendors increasingly integrate generative AI capabilities directly into operating systems instead of offering standalone applications.
- Premiumization continues lifting smartphone market value even as total shipment volumes soften.
- Many manufacturers now treat AI features as a primary purchase driver, replacing foldable displays as the leading marketing focus.
Global Smartphone Shipments
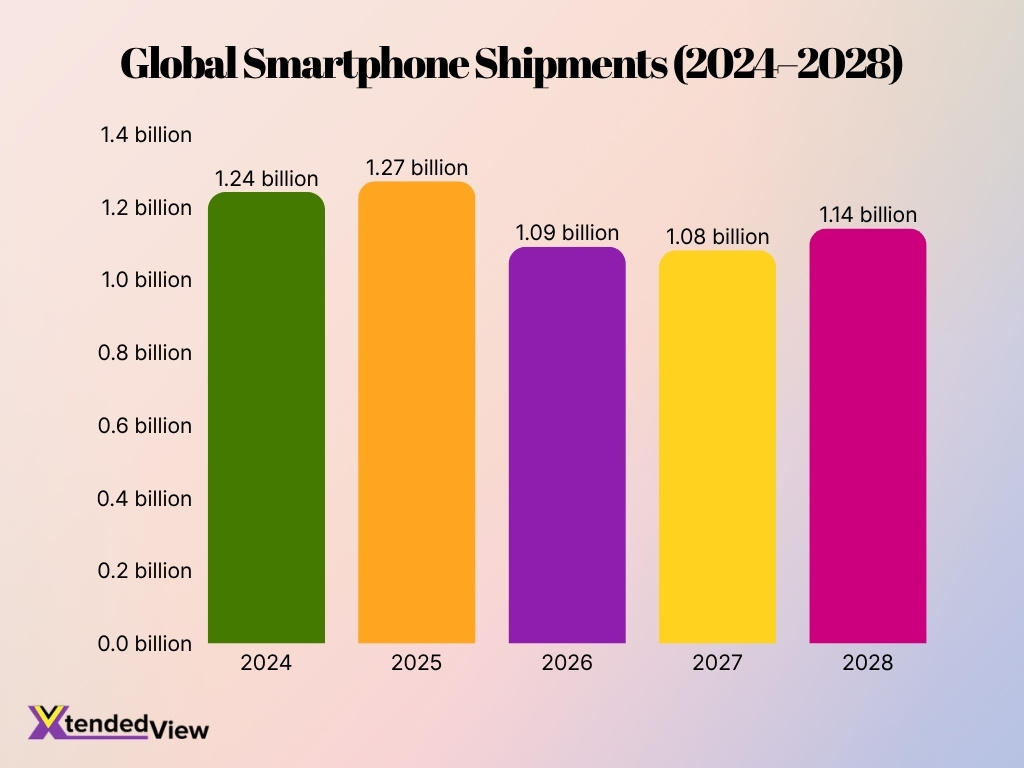
- Global smartphone shipments reached 1.24 billion units in 2024 and increased to 1.27 billion units in 2025, the highest level in the period.
- Shipments are projected to fall sharply to 1.09 billion units in 2026, representing a decline of about 14.2% from 2025.
- The downward trend is expected to continue slightly in 2027, when global shipments are projected at 1.08 billion units.
- Between 2025 and 2027, smartphone shipments are expected to decrease by approximately 190 million units, highlighting a notable market contraction.
- The market is projected to begin recovering in 2028, with shipments rising to 1.14 billion units, about 5.6% higher than in 2027.
- Despite the expected recovery, 2028 shipments would remain around 130 million units below the 2025 peak of 1.27 billion.
- Overall, the data indicates a peak in 2025, contraction through 2027, and partial recovery in 2028, suggesting uneven shipment growth across the forecast period.
Global Smartphone Users
- Global smartphone users officially reached 5.78 billion in 2025, firmly establishing the device as the primary computing platform globally.
- A remarkable 70.1% of the global population currently owns a smartphone and subscribes to mobile digital services.
- The Asia-Pacific region dominates global adoption, single-handedly accounting for 43.6% of the entire worldwide smartphone market.
- Affordable devices have propelled Android to a dominant 72.1% global market share, fueling rapid adoption across emerging economies.
- North America sustains exceptional smartphone penetration rates, with mobile cellular connections in regions like the United States reaching 119% of the total population.
- The rollout of AI-powered smartphones is heavily accelerating user upgrade cycles, driving total active mobile devices toward an estimated 8.5 billion in 2026.
- Mobile phones are now the primary gateway for digital transactions, successfully driving 65% of all global e-commerce traffic.
- Smartphone adoption continues surging among older demographics, with adults aged 65 and above now representing 18.4% of active internet users in highly developed markets.
Smartphone Ownership and Penetration Statistics
- Smartphone penetration has reached a 93% adoption rate across developed economies like the United States.
- Mobile connectivity encompasses 5.8 billion unique subscribers, representing approximately 70% of the global population.
- Affordable Android devices have secured an 81% market penetration across rapidly growing emerging markets.
- Suburban and urban areas experience high adoption rates of 93% and 91%, outpacing rural communities at 87%.
- Worldwide active devices exceed 7.5 billion, surpassing the user count due to rising multi-device ownership.
- The average smartphone replacement cycle currently stands at 28 months, driven by consistent device upgrades.
- Consumer demand persists despite the average smartphone price escalating to a record $550 globally.
- The 18 to 44 age demographic drives the market, accounting for 62% of all smartphone consumption globally.
- Globally, an estimated 72% of users consistently rely on their smartphones for essential daily digital payments.
Global Smartphone Market Share and YoY Growth
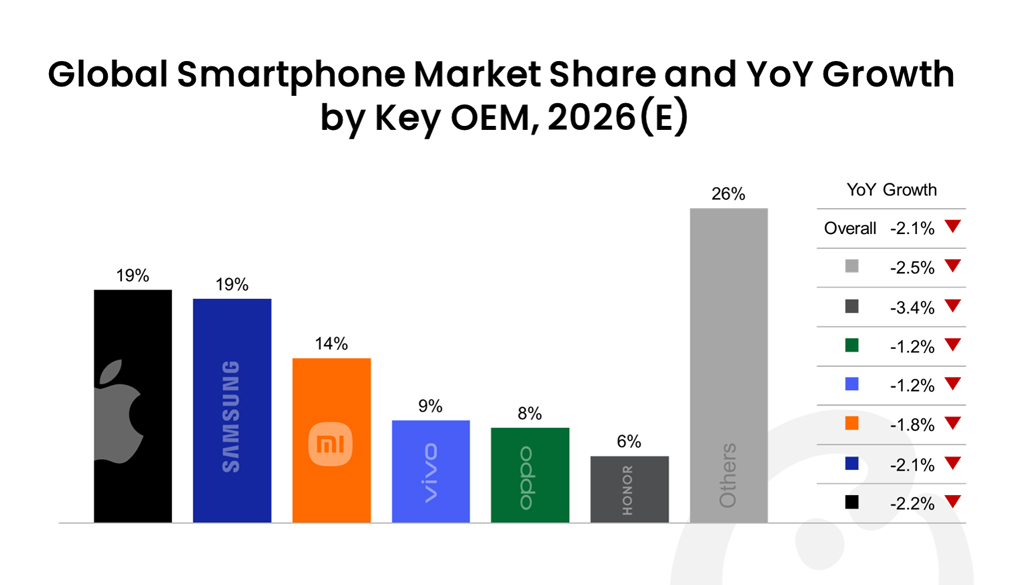
- Apple and Samsung are projected to jointly lead the global smartphone market in 2026, with each holding a 19% market share.
- Xiaomi ranks third with a 14% share, placing it 5 percentage points behind both Apple and Samsung.
- vivo is expected to account for 9% of the global market, while OPPO follows closely with an 8% share.
- HONOR holds the smallest share among the individually listed OEMs at 6%, while other manufacturers collectively represent 26% of the market.
- The overall global smartphone market is projected to record a 2.1% YoY decline in 2026, indicating softer shipment conditions across the industry.
- HONOR is expected to experience the sharpest decline among the major brands, with shipments falling 3.4% year over year.
- Apple and Samsung are also projected to contract, with YoY declines of 2.2% and 2.1%, respectively.
- Xiaomi’s shipments are forecast to decrease by 1.8%, a smaller decline than the overall market contraction of 2.1%.
- vivo and OPPO show the strongest relative performance among the listed OEMs, with both expected to decline by only 1.2% YoY.
- Despite the market-wide slowdown, the figures suggest that vivo and OPPO may prove more resilient than their larger competitors in 2026.
Smartphone Adoption by Region and Country
- China’s total mobile phone user base surpassed 1.8 billion by early 2025, maintaining its position as the largest global market.
- India’s active 5G smartphone devices doubled to 271 million in 2024, driven heavily by affordable Android model shipments.
- The United States reached 91% smartphone ownership in 2024, with premium iOS devices commanding over 58% of the market share.
- Africa’s mobile economy is projected to reach $290 billion by 2030, despite 63% of the population still facing mobile internet usage gaps.
- Southeast Asia saw smartphone shipments rebound to 96.7 million units in 2024, marking an 11% year-over-year increase.
- Latin America achieved a record 140.5 million smartphone shipments in 2025, driven largely by aggressive competition among Android brands.
- South Korea maintains a world-leading 97.4% 5G penetration rate, showing massive consumer preference for premium AI-integrated smartphones.
- Japan’s smartphone sales surged 31% year-over-year in early 2025, propelled by rapid replacement upgrades and device return programs.
- Nearly 90% of smartphones replaced in emerging markets like India in 2025 are expected to be fully 5G-capable.
Smartphone Users by Demographics
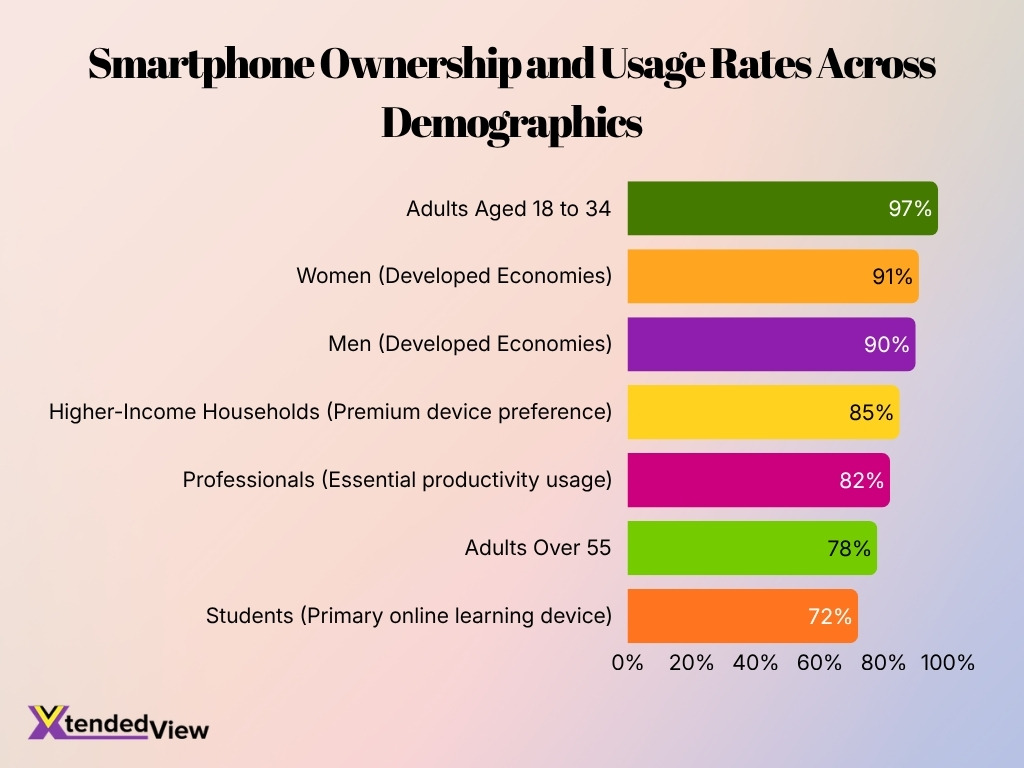
- Nearly 97% of adults aged 18 to 34 actively use a smartphone, maintaining the highest penetration rate globally.
- Smartphone ownership among adults over 55 has surpassed 78% as digital healthcare and communication services expand.
- Women and men now show near-equal ownership rates in developed economies, reaching 91% and 90% respectively.
- Younger consumers upgrade devices every 18 to 24 months, largely motivated by advanced AI and camera features.
- Over 85% of higher-income households consistently purchase premium flagship smartphones rather than entry-level models.
- More than 72% of students currently rely on their smartphones as their primary device for online learning.
- Approximately 82% of professionals actively use smartphones as essential productivity tools across hybrid work environments.
- The ownership gap between urban and rural populations has significantly narrowed to just 13 percentage points.
- Over 60% of younger buyers cite AI-powered personal assistants as a primary purchase decision factor entering 2026.
Smartphone Market Size and Growth
- The global smartphone market generated an estimated $560 billion in revenue during 2025.
- The smartphone industry is forecast to grow at a CAGR of 4.3% through the early 2030s.
- Asia-Pacificleads global sales by accounting for a massive 47.9% revenue share in 2025.
- North America maintains high market value with a steady 3.3% CAGR driven by premium purchases.
- AI-enabled smartphones are accelerating and expected to capture over 20% of product shipments in 2026.
- Enterprise mobility demand ensures that secure mobile devices comprise roughly 15% of corporate IT budgets.
- Premium smartphones now contribute over 60% of industry revenue despite a smaller share of unit shipments.
- Expanding 5G networks have successfully encouraged nearly 60% of global consumers to upgrade older devices.
- Subscription services and device financing programs currently support over 40% of long-term market upgrades.
Smartphone Operating System Market Share
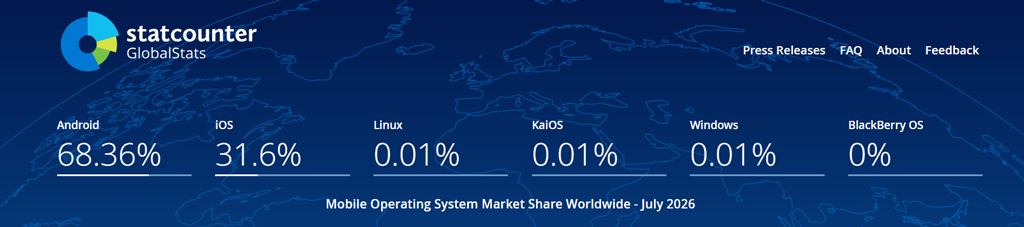
- Android dominates the global mobile operating system market with a 68.36% share as of July 2026, accounting for more than two-thirds of worldwide mobile OS usage.
- iOS holds a 31.6% global market share, making it the second-largest mobile operating system and Android’s only major competitor.
- Together, Android and iOS account for 99.96% of the worldwide mobile operating system market, leaving virtually no meaningful share for competing platforms.
- Android’s market share is 36.76 percentage points higher than iOS, highlighting its substantial lead in global mobile device usage.
- Linux accounts for just 0.01% of the mobile OS market, indicating extremely limited adoption compared with Android and iOS.
- KaiOS also represents only 0.01% of worldwide mobile operating system usage, despite its presence on feature phones and lower-cost devices.
- Windows holds a marginal 0.01% share, showing that Microsoft’s mobile operating system presence has effectively disappeared from the mainstream market.
- BlackBerry OS records a 0% market share, reflecting the platform’s complete decline from its former position in the global smartphone industry.
Smartphone Sales by Price Segment
- Smartphones priced above $600 continue generating the largest share of industry revenue despite representing a minority of total unit sales.
- Premium smartphone sales remained resilient throughout 2025 even as entry-level demand softened.
- Devices priced below $200 continue dominating shipments across many emerging markets.
- Mid-range smartphones priced between $300 and $600 remain the fastest-growing category in several developing economies.
- Consumers increasingly purchase premium smartphones through installment financing instead of upfront payments.
- AI features are expanding rapidly into upper mid-range smartphones priced between $400 and $700.
- Flagship smartphones continue driving higher profitability for manufacturers despite lower shipment volumes.
- Refurbished premium smartphones continue attracting price-conscious buyers seeking flagship performance at lower prices.
- Inflation and rising component costs have encouraged manufacturers to shift toward higher-priced smartphone portfolios.
Average Smartphone Selling Price
- The global smartphone average selling price crossed the $400 mark for the first time in late 2025.
- Apple’s average selling price remains extremely high at approximately $855, nearly 3x the Android average of $295.
- Foldable smartphone prices are forecast to surge by 18% year-over-year in 2026, driven by premium models.
- Premium smartphones priced at $600 and above captured a record 29% share of the global market in early 2026.
- Foldable devices priced above $1,600 are expected to account for 60% of all foldable shipments in 2026.
- Rising memory and component costs pushed the overall global smartphone average selling price up by 8% year-over-year.
- Apple continues to dominate the high-end tier by maintaining a 65% market share within the premium smartphone segment.
- India’s average selling price is projected to gradually increase to $287 by 2029 due to domestic premiumization.
- Driven by these higher prices, global smartphone market revenue hit an all-time quarterly record of $143 billion.
U.S. Smartphone Replacement and Upgrade Trends
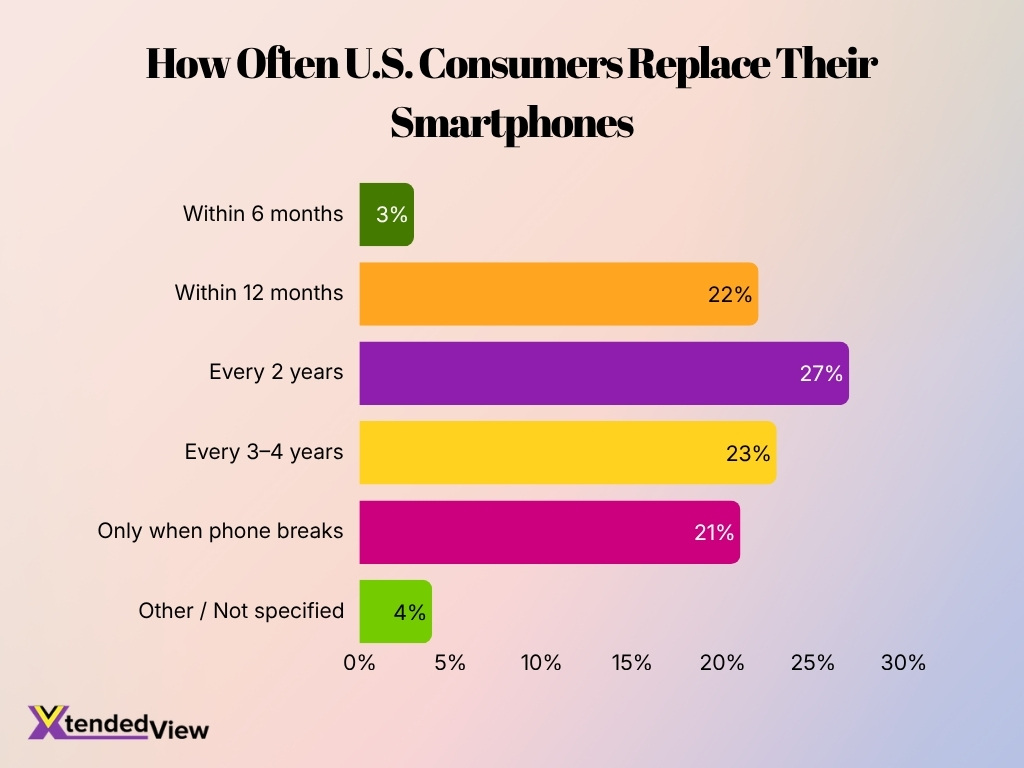
- 27% of U.S. consumers replace their smartphones every two years, making this the most common upgrade cycle among respondents.
- Around 23% of consumers wait three to four years before replacing their smartphones, indicating a sizable preference for longer device lifespans.
- About 22% of U.S. consumers plan to upgrade their smartphones within 12 months, showing continued demand for relatively frequent upgrades.
- Another 21% of consumers replace their smartphones only when their current device breaks, suggesting that necessity remains an important replacement trigger.
- Just 3% of consumers expect to replace their smartphones within six months, making very frequent upgrades relatively uncommon.
- The remaining 4% of respondents fall into the other or unspecified category for smartphone replacement timing.
- Overall, 50% of U.S. consumers follow a replacement cycle of two to four years, highlighting a strong tendency to keep smartphones for multiple years before upgrading.
Smartphone Usage and Screen Time Statistics
- Global smartphone users spend an average of 4 hours and 37 minutes per day on their mobile devices.
- Mobile devices now account for 64% of global web traffic, acting as the primary gateway to the internet.
- Consumers check their smartphones up to 96 times daily, significantly exceeding older interaction estimates.
- Video streaming dominates screen time, with younger demographics averaging 87 minutes daily on short-form apps.
- Young adults aged 18 to 34 record the highest global engagement, averaging over 7 hours of daily screen time.
- Mobile gaming serves over 3.6 billion users globally, generating a massive 55% of all gaming industry revenue.
- The integration of AI-powered features successfully extended average daily mobile engagement times throughout 2025.
- Mobile commerce and applications continue expanding, currently processing 54% of all global online transactions.
- Consumers increasingly divide their daily screen time across multiple primary application categories instead of just one.
5G Smartphone Adoption Statistics
- Global 5G subscriptions reached approximately 2.9 billion by late 2025, accounting for roughly 33% of all worldwide mobile connections.
- More than 390 commercial 5G networks are currently operational globally, with over 90 providers offering advanced 5G standalone (SA) services.
- China maintains its position as the largest market, surpassing 1.06 billion 5G mobile users which represents 59.4% of its total mobile user base.
- North America leads global adoption rates, recording an impressive 79% 5G smartphone penetration as nationwide network coverage rapidly expands.
- India is experiencing accelerated 5G adoption rates, pushing the Asia-Pacific region to hold a dominant 42.7% global market share in 5G services.
- Expanding 5G connectivity in mid-range smartphones is driving market accessibility, helping push global smartphone shipments to 1.25 billion units in 2025.
- Faster download speeds and improved streaming remain primary upgrade drivers, pushing average monthly data consumption to over 20.5 GB per user in leading markets.
- Manufacturers now treat 5G as a standard baseline rather than a premium feature, making it a critical driver for the projected $315.8 billion 5G services market in 2026.
- Enterprise applications are accelerating network deployments, leveraging widespread 5G smartphone adoption for cloud computing, logistics, and manufacturing integration.
Top Smartphone Activities Among Internet Users
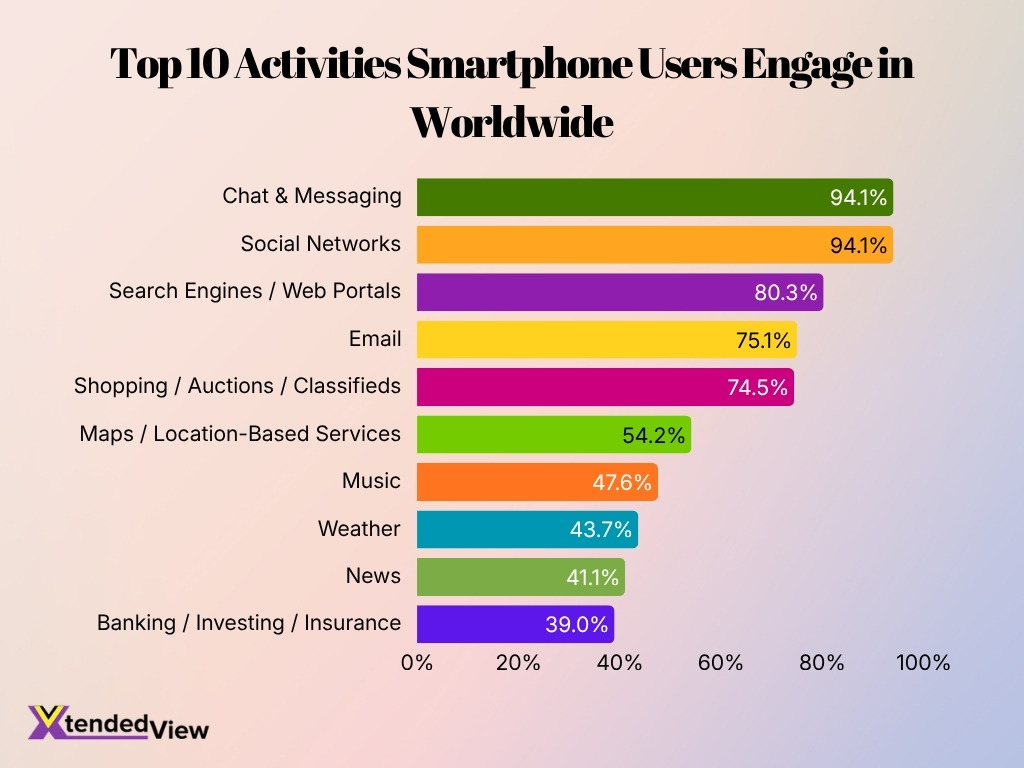
- Chat and messaging rank as the most popular smartphone activity, used by 94.1% of internet users, highlighting smartphones’ central role in everyday communication.
- Social networking also reaches 94.1%, tying with messaging and showing how strongly mobile devices shape social interaction and content consumption.
- Search engines and web portals are used by 80.3% of users, making mobile search the third-most common smartphone activity.
- Email remains highly relevant on smartphones, with 75.1% of internet users using their devices to send, receive, and manage messages.
- Shopping, auctions, and classifieds attract 74.5% of users, demonstrating the significant role smartphones play in product discovery and online purchasing.
- Maps and location-based services are used by 54.2%, showing that more than half of users rely on smartphones for navigation and location-related information.
- Music is a popular mobile activity for 47.6% of users, reflecting smartphones’ importance as portable entertainment and streaming devices.
- Around 43.7% of internet users access weather information through smartphones, making it one of the top 10 mobile activities worldwide.
- News consumption accounts for 41.1% of users, indicating that smartphones have become an important channel for staying informed on current events.
- Banking, investing, and insurance services are accessed by 39.0% of users, showing the growing role of smartphones in managing personal finances.
AI and Foldable Smartphone Statistics
- Global AI smartphone shipments are projected to capture more than 40% of the total market share by 2026.
- Worldwide foldable smartphone shipments are forecast to experience a 21% to 30% year-over-year growth in 2026.
- On-device AI capabilities are poised to dominate the segment by securing 65.7% of the total AI smartphone market share.
- The global AI smartphone market is anticipated to reach an estimated valuation of $140.8 billion during 2026.
- Premium smartphones integrating advanced AI are expected to retain dominance by capturing 70.4% of the total market revenue.
- Foldable devices are projected to represent over 10% of the total global smartphone market value by the year 2029.
- Global foldable phone shipments are estimated to reach approximately 20.6 million units by the end of 2025.
- The mobile artificial intelligence market is projected to grow at a massive 31.9% compound annual growth rate from 2026 to 2033.
Refurbished Smartphone and Sustainability Statistics
- Global sales of refurbished and used mobile phones exceeded 310 million units in 2023.
- The global secondary smartphone market is projected to reach a value of $96.99 billion by 2031.
- Choosing a refurbished smartphone prevents 58 kg of CO2 equivalent from being emitted during manufacturing.
- The refurbishing process requires approximately 87% less virgin material than producing a brand-new device.
- Buying a refurbished phone saves over 76,000 litres of water compared to manufacturing a new handset.
- Refurbished mobile devices help reduce approximately 18 million tons of e-waste worldwide every year.
- Consumers typically save between 19% and 33% on certified renewed smartphones compared to brand-new counterparts.
- Certified pre-owned smartphone sales are currently expanding at a 7.28% compound annual growth rate globally.
- Approximately 70% of consumers prefer purchasing refurbished smartphones over new entry-level models for better features.
Frequently Asked Questions (FAQs)
There are approximately 5.78 billion smartphone users worldwide in 2026, representing about 70% of the global population.
Global smartphone shipments are forecast to reach approximately 1.09 billion units in 2026.
Android holds approximately 70% of the global smartphone operating system market, while iOS accounts for about 28%.
The average smartphone user spends about 4 hours and 37 minutes per day using their smartphone.
Mobile devices generate more than 60% of global website traffic, making smartphones the primary device for internet access worldwide.
Conclusion
The smartphone industry continues evolving through AI innovation, widespread 5G adoption, premium device growth, and longer replacement cycles. Manufacturers increasingly compete through software intelligence, ecosystem integration, and sustainability initiatives alongside hardware improvements.
Looking ahead, AI-powered smartphones, expanding 5G networks, and sustainable device programs will continue shaping the market. These statistics provide valuable insights for businesses, investors, developers, and consumers looking to understand the future of the global smartphone industry.