
The iPhone continues to shape the global smartphone industry by influencing consumer buying behavior, enterprise mobility, and mobile app ecosystems. Businesses rely on iPhones for secure workplace communication, while developers, retailers, and financial service providers benefit from Apple’s large and engaged user base. As new models, AI-powered features, and premium devices enter the market, iPhone trends remain important for investors, marketers, and technology professionals. Explore the statistics below to understand how the iPhone market has evolved.
Editor’s Choice
- Apple’s iPhone business generated $209.6 billion in net sales during fiscal 2025, representing a 4% year-over-year increase from $201.2 billion in 2024.
- Apple reported $416.2 billion in total revenue for fiscal 2025, with the iPhone remaining its largest revenue contributor.
- Apple shipped approximately 61.8 million iPhones worldwide in Q1 2026, giving it 21.0% of the global smartphone market during the quarter.
- Apple’s Q1 2026 smartphone shipments increased 4.4% year over year, outperforming the overall smartphone market, which declined 2.9%.
- Nearly one in every four active smartphones worldwide is an iPhone, making Apple the largest active premium smartphone ecosystem globally.
- Apple surpassed one billion active iPhone devices, remaining one of only two smartphone brands to achieve this milestone.
- The iPhone 16 became the best-selling smartphone of 2025, while Apple captured seven of the world’s top 10 best-selling smartphone models.
- Apple recorded more than $85 billion in iPhone revenue during a single quarter for the first time, driven by a strong upgrade cycle in late 2025.
Recent Developments
- Apple introduced the iPhone 17 lineup during late 2025, focusing on improved AI capabilities, camera upgrades, and enhanced on-device intelligence.
- Global smartphone shipments fell 2.9% in Q1 2026, but Apple still achieved 4.4% shipment growth, highlighting continued premium demand.
- Apple ranked second worldwide in smartphone shipments during Q1 2026 with 61.8 million units, only slightly behind Samsung.
- Apple’s growth in China exceeded 30% during Q1 2026, supported by strong demand for the iPhone 17 series.
- Apple added more net new active smartphones in 2025 than the next seven smartphone brands combined.
- Apple achieved its highest quarterly company revenue of approximately $144 billion during Q4 2025, largely due to iPhone demand.
- iPhone revenue grew 23% year over year during Apple’s record-setting holiday quarter in early fiscal 2026.
- Industry analysts expect premium smartphone demand to remain resilient despite rising component costs and higher average selling prices.
iPhone Revenue Growth Trends
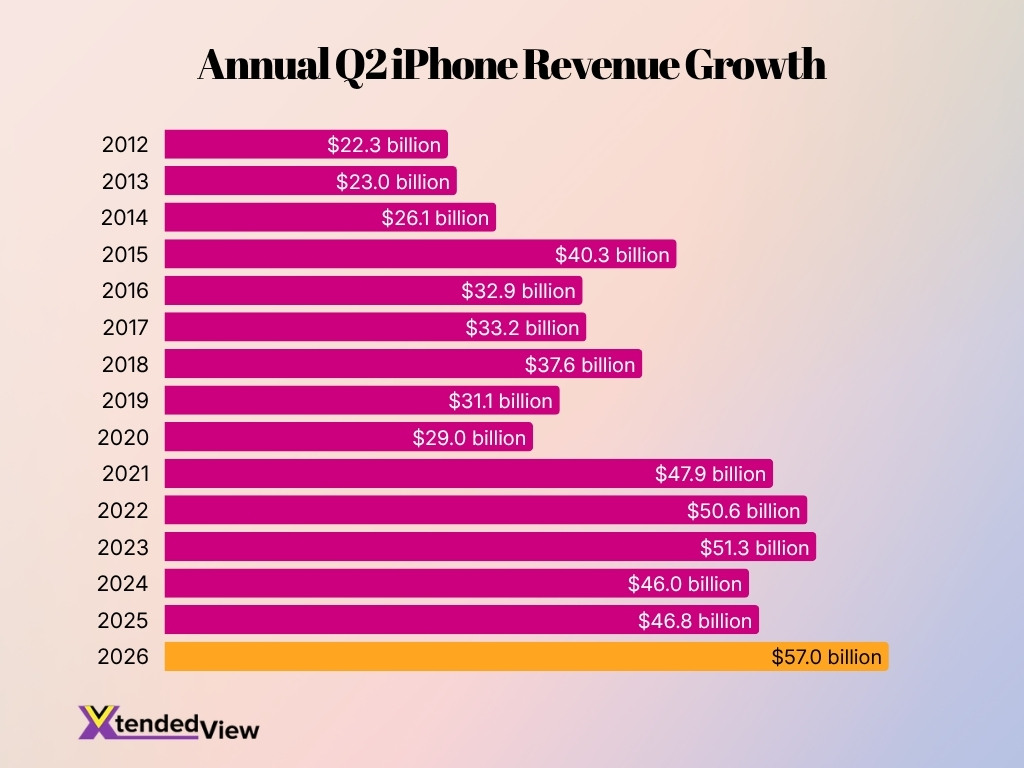
- Q2 iPhone revenue increased from $22.3 billion in 2012 to a record $57.0 billion in 2026.
- Revenue grew by approximately 156% across the full 2012 to 2026 period.
- The first major surge occurred in 2015, when revenue reached $40.3 billion, up from $26.1 billion in 2014.
- Q2 revenue declined to $32.9 billion in 2016 before recovering gradually over the next two years.
- Revenue fell from $37.6 billion in 2018 to $29.0 billion in 2020, marking a two-year slowdown.
- A strong rebound followed in 2021, with revenue jumping to $47.9 billion.
- Q2 iPhone revenue crossed $50 billion for the first time in 2022, reaching $50.6 billion.
- Revenue increased slightly to $51.3 billion in 2023, setting a new high at the time.
- Apple recorded a decline in 2024, with Q2 iPhone revenue falling to $46.0 billion.
- Revenue recovered modestly to $46.8 billion in 2025 before surging to $57.0 billion in 2026.
- The 2026 figure was $10.2 billion higher than in 2025, representing growth of about 21.8%.
- Across the 15-year period, Q2 iPhone revenue exceeded $45 billion in six years: 2021, 2022, 2023, 2024, 2025, and 2026.
iPhone User Base
- Apple serves well over one billion active iPhone users globally through its installed device base.
- Nearly 25% of all active smartphones worldwide are iPhones, fueling a massive mobile ecosystem.
- In 2025, Apple acquired more new active users than the next seven smartphone manufacturers combined.
- The global active smartphone installed base grew by 2% in 2025, driven by longer replacement cycles.
- Apple remains one of only two global companies with an active installed base exceeding one billion devices.
- A staggering 89% user loyalty rate supports Apple’s premium pricing despite slower global market growth.
- The United States remains the strongest market, housing over 150 million active iPhone users.
- Deep integration across services like Apple Pay helps generate roughly $44 per active device annually.
iPhone Sales Over Time
- Apple generated $209.6 billion in iPhone revenue during fiscal 2025, compared with $201.2 billion in 2024.
- Fiscal 2023 iPhone revenue totaled approximately $200.6 billion, showing steady growth over three consecutive years.
- The iPhone business grew 4% year over year in fiscal 2025 despite a challenging global smartphone market.
- Apple’s strongest sales performance came from Pro models, which drove higher average selling prices during fiscal 2025.
- During Q4 2025, iPhone revenue exceeded $85 billion, marking the highest quarterly iPhone revenue on record.
- Apple reported 23% year-over-year iPhone revenue growth during its record holiday quarter entering fiscal 2026.
- Apple maintained strong premium smartphone demand even as global smartphone shipments softened in early 2026.
- Analysts continue to expect premium pricing and customer loyalty to support future iPhone sales despite slower industry growth.
Global Apple Smartphone Shipment Share Trends
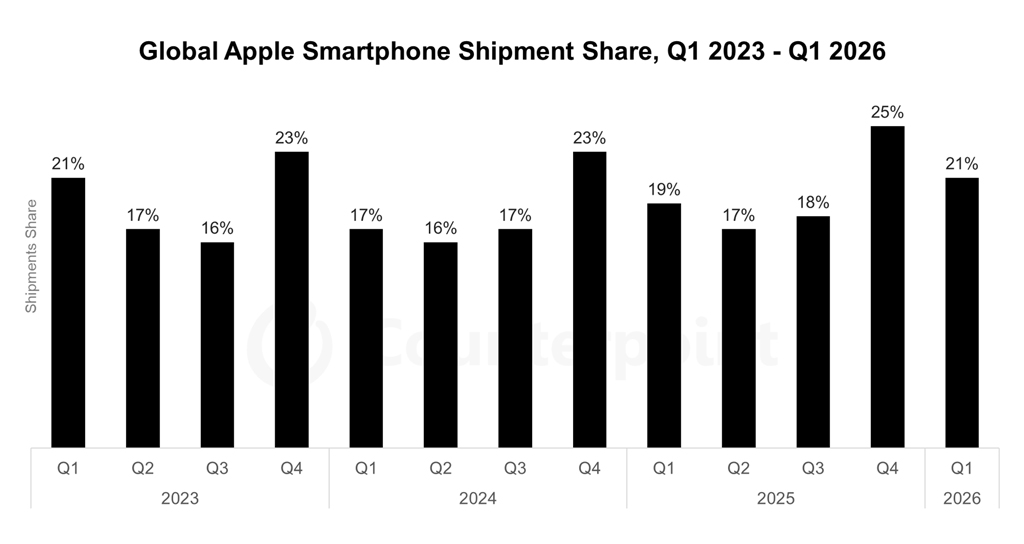
- Apple’s global smartphone shipment share increased from 21% in Q1 2023 to 21% in Q1 2026, showing no net change across the period.
- The company recorded its lowest shipment share of 16% in Q3 2023 and Q2 2024.
- Apple’s shipment share rose sharply to 23% in Q4 2023, up from 16% in Q3 2023.
- In Q4 2024, Apple again captured 23% of global smartphone shipments.
- Apple’s share improved from 17% in Q2 2025 to 18% in Q3 2025.
- The highest shipment share was 25% in Q4 2025, marking the strongest quarter in the dataset.
- Apple’s share declined by 4 percentage points, from 25% in Q4 2025 to 21% in Q1 2026.
- The data shows a clear seasonal pattern, with Apple posting its strongest shipment shares in Q4 each year.
iPhone vs Android Market Share
- Android accounted for 73% of global smartphone sales in Q1 2026, while iOS reached 22%, its highest-ever first-quarter share.
- During Q4 2025, iOS captured 24% of global smartphone sales as new iPhone launches boosted demand.
- Android’s worldwide sales share declined from 76% in Q1 2025 to 73% in Q1 2026.
- Apple’s global smartphone shipment share reached 21% in Q1 2026, reflecting strong momentum for the iPhone 17 lineup.
- Apple maintained the largest active premium smartphone ecosystem, with nearly one in four active smartphones worldwide being an iPhone.
- Only Apple and Samsung have surpassed one billion active smartphones in their installed bases.
- iOS continued gaining share in premium smartphone markets, supported by longer software support, trade-in programs, and ecosystem integration.
- Android retained overall volume leadership because of its broad presence across entry-level, midrange, and flagship devices.
iPhone Users by Country
- The United States remains the largest market with approximately 150.7 million active iPhone users.
- China recorded an approximate 22% year-over-year increase in Apple shipments during Q1 2026.
- India achieved a significant 28% year-over-year Apple value growth in 2025.
- The iPhone 16 became the top-shipped smartphone model across India throughout 2025.
- Japan posted strong double-digit iPhone sales growth in 2025 driven by iPhone 16e demand.
- Multiple Middle Eastern markets saw double-digit sales growth during April and May 2025.
- Western Europe drove major premium smartphone demand following the launch of the iPhone 17 series.
- Apple captured a record 20% share of global smartphone shipments in the second quarter of 2026.
- The global iOS market share reached its highest ever first-quarter level at 22% in 2026.
iPhone Installed Base by Region
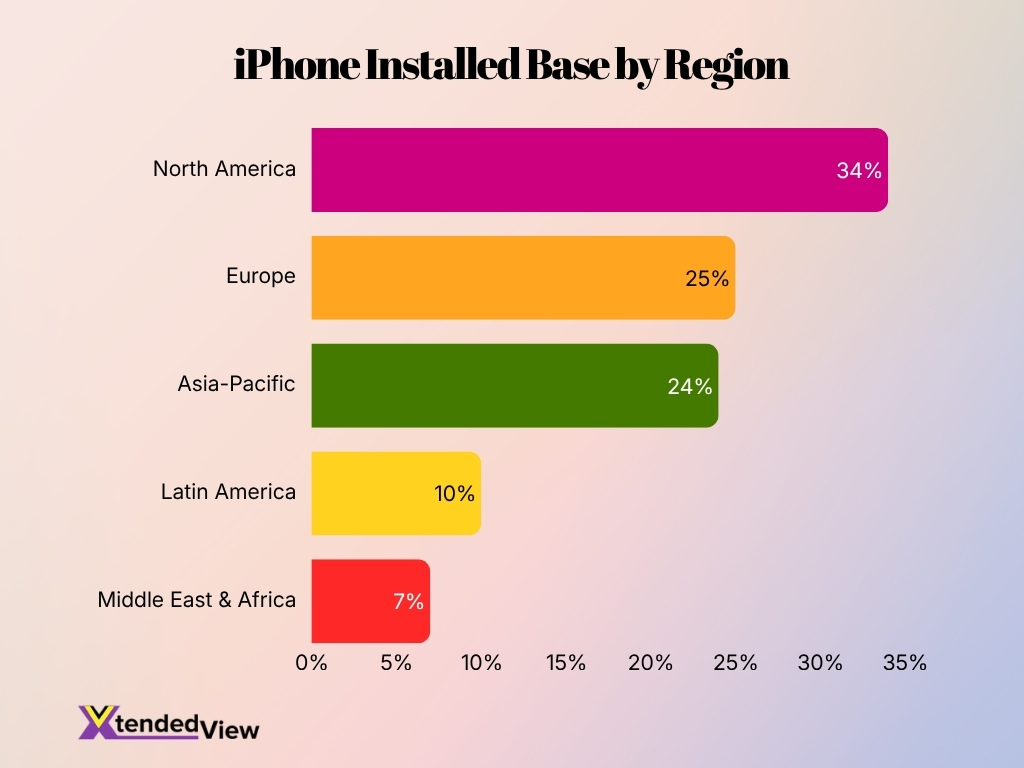
- North America leads the global iPhone installed base with a 34% share, meaning more than one-third of all active iPhones are concentrated in this region.
- Europe accounts for 25% of active iPhones worldwide, making it the second-largest regional market for Apple’s smartphone installed base.
- Asia-Pacific holds a 24% share, placing it just one percentage point behind Europe and highlighting its strong importance to Apple.
- Latin America represents 10% of the active iPhone base, showing a smaller but still meaningful presence in the global market.
- The Middle East and Africa account for 7%, giving the region the lowest share of active iPhones among those listed.
- Together, North America, Europe, and Asia-Pacific make up 83% of active iPhones, showing that Apple’s installed base is heavily concentrated in these three regions.
iPhone Launch History
- Apple introduced the original iPhone in 2007, creating the modern touchscreen smartphone category.
- The App Store, introduced in 2008, accelerated iPhone adoption by enabling third-party applications.
- Apple launched the iPhone X in 2017, replacing the Home button with Face ID and an edge-to-edge display.
- The iPhone 12 family introduced 5G connectivity across the lineup in 2020.
- Apple expanded the premium segment through Pro and Pro Max models, which now contribute significantly to iPhone revenue.
- The iPhone 16 series became the world’s best-selling smartphone family during 2025.
- Apple followed with the iPhone 17 lineup in late 2025, emphasizing AI-powered features, higher-refresh-rate displays, and larger base storage.
- More than one billion active iPhones now reflect nearly two decades of continuous product launches and ecosystem expansion.
Best-Selling iPhone Models
- The iPhone 16 claimed the number one spot globally for smartphone sales in 2025.
- Apple dominated the market by capturing 7 out of 10 positions in the global best-sellers list.
- The iPhone 17 series saw a 16% increase in sales during its first full quarter compared to previous models.
- The top 10 smartphone models collectively accounted for 19% of total global sales.
- The base iPhone 17 recorded the highest growth by jumping 4 spots in the global rankings.
- Apple led worldwide smartphone shipments with a 20% market share throughout the year.
- The company’s total global shipments experienced a 10% year-over-year growth in 2025.
- The newly released iPhone 17 Pro Max reached the 4th spot globally in just 3.5 months.
Most Popular Refurbished iPhones
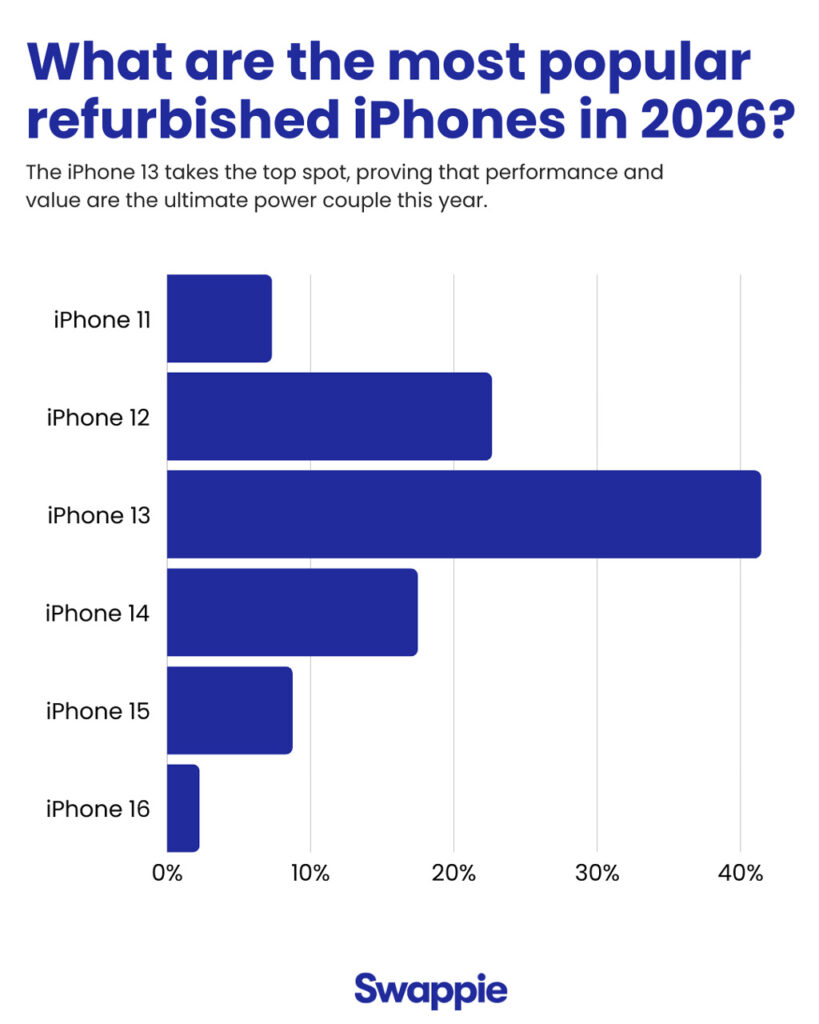
- The iPhone 13 dominates the refurbished market with an estimated 41.5% share.
- The iPhone 12 ranks second, accounting for approximately 22.7% of popular refurbished purchases.
- The iPhone 14 holds third place with a notable 17.5% share.
- The iPhone 15 represents around 8.8% of refurbished iPhone demand.
- The older iPhone 11 remains relevant, capturing approximately 7.4% of the market.
- The newer iPhone 16 records the smallest share at just 2.3%.
- Combined, the iPhone 12 and iPhone 13 account for roughly 64.2% of the refurbished iPhone market.
- The data suggests buyers prioritize proven performance and lower prices, especially with the iPhone 13.
iPhone Adoption Trends
- Apple’s active installed base surpassed 2.5 billion devices globally during the quarter ended December 2025.
- Nearly one in four active smartphones worldwide is now an iPhone, securing a 25% global share in Q4 2025.
- Between 11% and 15% of new iPhone buyers in recent quarters switched directly from an Android device.
- iPhone users maintained an industry-leading 87% to 94% brand loyalty rate globally across 2025 and 2026.
- Apple shipped a record 247.4 million iPhones worldwide in 2025, representing a 6.1% year-over-year unit growth.
- In the United States, the iPhone commands a dominant 57% to 60% mobile market share as of early 2026.
- Apple successfully added more net new smartphone devices in 2025 than the next seven leading brands combined.
- 72% of current iPhone users own at least one other Apple device, heavily driving long-term ecosystem lock-in.
- Approximately 155 million users in the United States currently use an iPhone, supported by strong upgrade cycles.
- Gen Z consumers heavily favor Apple, with 96% of younger iPhone users remaining strictly loyal to the platform.
iPhone Active Device Base
- Apple maintained an active installed base of more than 1 billion iPhones in 2025.
- Nearly 1 in 4 active smartphones globally is currently an iPhone.
- Apple and Samsung accounted for a combined 44% share of the active smartphone base in 2025.
- The global active smartphone base grew by 2% in 2025, with replacement cycles extending to nearly 4 years.
- Apple added more net new active smartphones in 2025 than the next 7 leading brands combined.
- More than 2.5 billion active Apple devices were operating worldwide by early 2026.
- The iPhone accounts for the largest overall share of those 2.5 billion active Apple platforms.
iPhone Ownership by Age Group
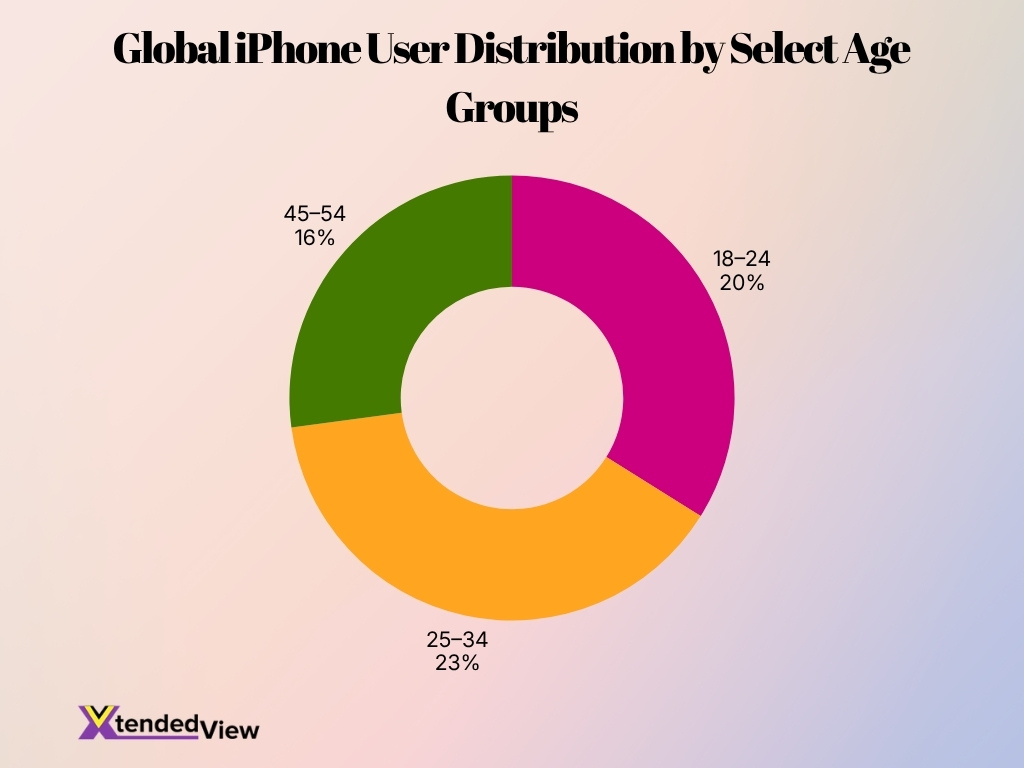
- 23% of all iPhone users globally are aged between 25 and 34 years.
- 20% of the iPhone user base falls directly into the 18 to 24 age group.
- 88% of US teenagers currently own an iPhone as their primary device.
- 79% of US adults aged 18 to 34 actively use iPhones today.
- 68% of 18 to 29-year-olds in the US strictly prefer iOS over Android.
- 43% of all global iPhone users are between the ages of 18 and 34.
- 16% of total iPhone users belong to the older 45 to 54 age bracket.
- 89% of US teens plan to choose an iPhone for their next smartphone purchase.
- 38% of Americans aged 65 and older currently use an iPhone.
- 60% of all new iPhone buyers belong to the Gen Z and Millennial generations.
iPhone Upgrade and Replacement Cycle
- The global average smartphone replacement cycle stretched to nearly four years in 2025.
- Apple witnessed a 23% year-over-year increase in iPhone revenue during the 2025 holiday quarter.
- Quarterly iPhone revenue shattered previous records by exceeding $85 billion in a single quarter.
- The massive 2021 post-pandemic buyer cohort is the primary driver for iPhone upgrades in 2025 and 2026.
- Owners of iPhone Pro models average an upgrade cycle of exactly 2.75 years.
- Users holding non-Pro iPhone models wait an average of 3.15 years to replace their devices.
- Industry analysts project extended smartphone replacement cycles to strongly persist throughout the entirety of 2026.
iPhone Price Trends
- The global smartphone average selling price crossed $400 for the first time in Q4 2025.
- Apple captured 20% of the global smartphone market share with 10% annual growth in 2025.
- Apple’s smartphone revenues surged by 23% in Q4 2025 driven by the iPhone 17 series demand.
- The company posted a record $143.8 billion in total revenue during Q1 2026.
- iPhones retain 60-70% of their original value after one year of ownership.
- Apple shipped a record-breaking 247.4 million iPhone units globally throughout 2025.
- Global smartphone shipments grew by a modest 2% to reach 1.25 billion units in 2025.
- iPhones lose only 25-30% of their value in year one compared to 40-50% for Android devices.
iPhone Revenue Share in Apple’s Total Revenue
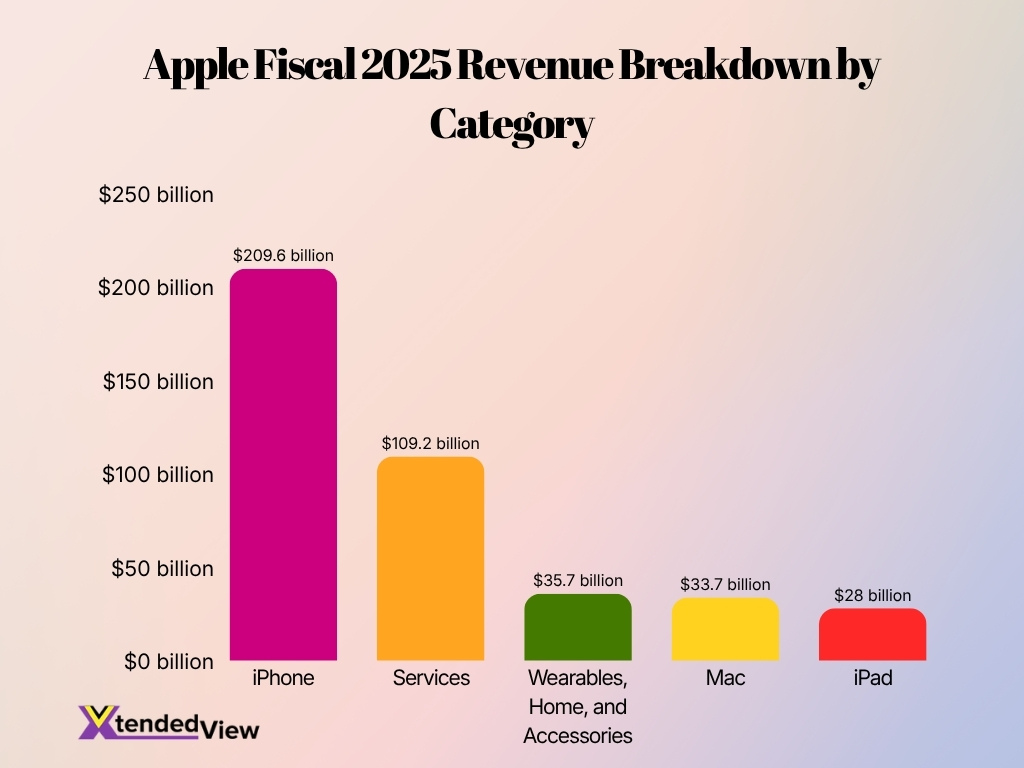
- Apple generated $209.6 billion in iPhone revenue during fiscal 2025.
- Total company revenue reached $416.2 billion in fiscal 2025.
- The iPhone contributed approximately 50.4% of Apple’s total revenue during fiscal 2025.
- Services generated $109.2 billion in fiscal 2025, remaining Apple’s second-largest revenue category.
- Mac revenue increased to $33.7 billion during fiscal 2025, while iPad generated $28.0 billion.
- Wearables, Home, and Accessories produced $35.7 billion in fiscal 2025 revenue.
- During Apple’s record holiday quarter, iPhone revenue exceeded $85 billion, accounting for the largest share of quarterly company revenue.
- Despite rapid services growth, the iPhone continues to represent about half of Apple’s annual revenue, underscoring its central role in the company’s financial performance.
iPhone Ecosystem Growth
- Apple reached a massive milestone with 2.5 billion active devices operating globally by early 2026.
- The ecosystem’s installed base grew rapidly by adding 150 million new devices in a single year.
- Apple’s services segment generated a record-breaking $109.2 billion in revenue throughout fiscal 2025.
- Total company quarterly revenue hit an unprecedented $143.8 billion in the first quarter of 2026.
- Global iPhone sales reached a new high of 247 million units during the 2025 calendar year.
- The worldwide installed base currently includes more than 1.5 billion active iPhone units.
- The App Store continues to drive engagement with over 850 million average weekly users.
- Application developers have generated over $550 billion in earnings across the platform since 2008.
- Ecosystem transaction scale is massive, with Apple Pay processing $9 trillion in volume during 2025.
- Apple TV+ strengthened content offerings by securing a record-setting 89 Emmy Award nominations.
Frequently Asked Questions (FAQs)
Apple generated $209.6 billion in iPhone revenue during fiscal 2025.
Apple held a 21% global smartphone shipment market share in Q1 2026.
Apple reported more than 2.5 billion active devices across its ecosystem by early 2026.
Nearly 25% (one in four) of all active smartphones worldwide are iPhones.
Apple reported a record $143.8 billion in total revenue for its first fiscal quarter of 2026, up 16% year over year.
Conclusion
The iPhone remains the world’s most influential premium smartphone, supported by a one-billion-plus active installed base, strong customer loyalty, and consistent revenue growth. Apple strengthened its position through record iPhone revenue, expanding services, and growing demand across key markets such as the United States, India, China, and Japan. While replacement cycles continue to lengthen, Apple’s integrated ecosystem, premium hardware, AI capabilities, and recurring services revenue continue to drive long-term growth. As smartphone competition intensifies, the iPhone remains a benchmark for innovation, profitability, and ecosystem value across the global technology industry.