
Apple remains one of the most influential technology companies in the world, shaping consumer electronics, software, digital payments, cloud services, and entertainment. Its ecosystem affects industries ranging from mobile commerce and app development to enterprise productivity and healthcare through wearable technology. As Apple expands its installed base of devices and services portfolio, its financial and market performance continues to influence global technology trends. Explore the latest Apple statistics to understand how the company is growing across revenue, profitability, and device adoption.
Editor’s Choice
- Apple reported more than 2.5 billion active devices worldwide as of fiscal Q1 2026, up from 2.35 billion a year earlier.
- Apple generated approximately $416 billion in revenue during fiscal 2025, representing year-over-year growth of about 6.4%.
- Apple’s Services segment produced over $109 billion in fiscal 2025 revenue, marking the first time the business exceeded $100 billion annually.
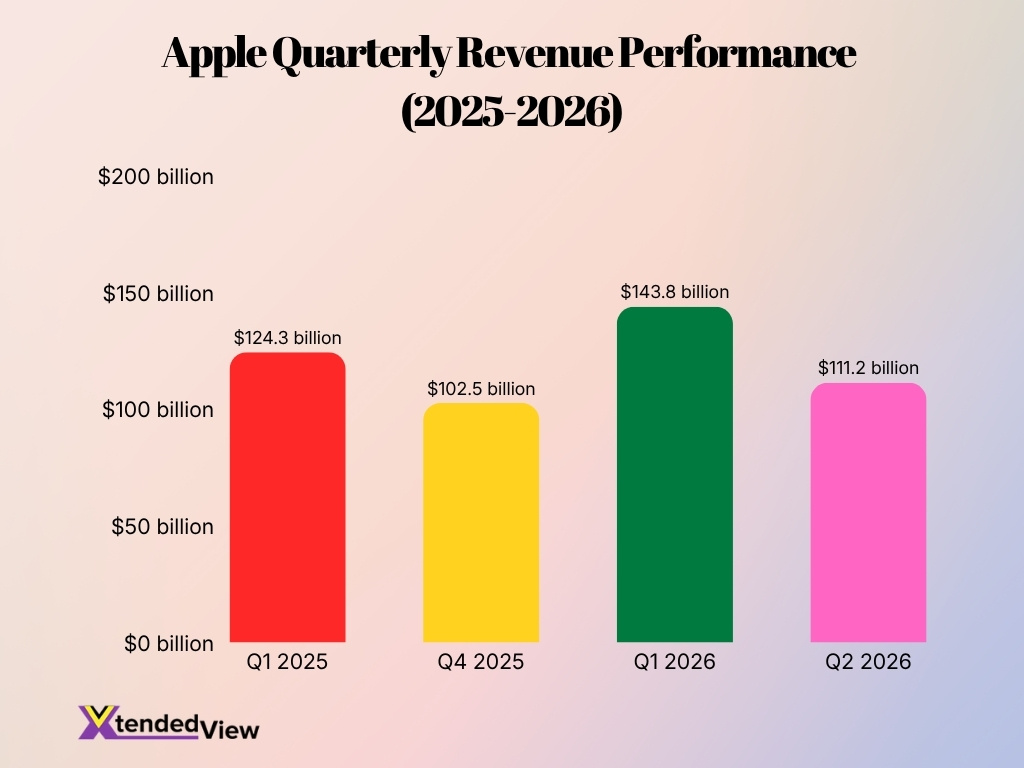
- Fiscal Q1 2026 revenue reached a record $143.8 billion, increasing 16% year over year.
- iPhone revenue totaled approximately $209.6 billion in fiscal 2025, accounting for roughly half of Apple’s total revenue.
- Apple’s March 2026 quarter revenue reached $111.2 billion, up 17% from the previous year.
- Apple added roughly 150 million active devices to its installed base between early 2025 and early 2026.
Recent Developments
- Apple’s installed device ecosystem surpassed 2.5 billion active devices during fiscal Q1 2026.
- Fiscal Q1 2026 revenue climbed to $143.8 billion, setting a new company record.
- Apple Services achieved its strongest year ever in 2025 with record engagement across subscriptions, payments, cloud services, and digital content.
- Services revenue crossed $30 billion in a single quarter for the first time during fiscal Q1 2026.
- Apple reported fiscal Q2 2026 revenue of $111.2 billion, up 17% year over year.
- Diluted earnings per share reached $2.01 during fiscal Q2 2026, reflecting 22% annual growth.
- iPhone revenue reached approximately $85.3 billion during fiscal Q1 2026, supported by strong upgrade demand.
- Apple recorded all-time highs in both paid accounts and transacting accounts across its services ecosystem.
- The company continued expanding Apple Intelligence features across major product categories during 2025 and 2026.
- Customer satisfaction for recent iPhone models remained exceptionally high at 99% in the U.S. market.
Key Apple Statistics Overview
- Apple operates in more than 175 countries and regions through hardware, software, and services ecosystems.
- The company’s active installed base exceeded 2.5 billion devices in 2026.
- iPhone remains Apple’s largest business segment, generating over 50% of total company revenue.
- Services contributed more than 26% of Apple’s total revenue during fiscal 2025.
- Apple generated roughly $390.8 billion in revenue during fiscal 2024 before increasing to approximately $416 billion in fiscal 2025.
- The company reported record revenue in both fiscal Q1 2026 and fiscal Q2 2026.
- Apple’s ecosystem includes iPhone, iPad, Mac, Apple Watch, AirPods, Apple TV, HomePod, and subscription services.
- More than half of Apple’s quarterly revenue continues to come from products tied directly to the iPhone ecosystem.
- Apple Services has become the company’s second-largest revenue segment.
- The company employs over 160,000 people globally across retail, engineering, operations, and corporate functions.
Apple Revenue and Financial Statistics
- Apple generated approximately $416 billion in total revenue during fiscal 2025.
- Fiscal Q1 2026 revenue reached a record $143.8 billion, up 16% year over year.
- Fiscal Q2 2026 revenue totaled $111.2 billion, increasing 17% year over year.
- Fiscal Q4 2025 revenue reached $102.5 billion, representing 8% annual growth.
- Fiscal Q1 2025 revenue totaled $124.3 billion, establishing the previous company revenue record.
- The Americas region continues to account for the largest share of Apple’s global revenue.
- Services revenue reached approximately $109.2 billion in fiscal 2025, compared with $96.2 billion in fiscal 2024.
- Mac revenue increased to approximately $33.7 billion in fiscal 2025, up more than 12% year over year.
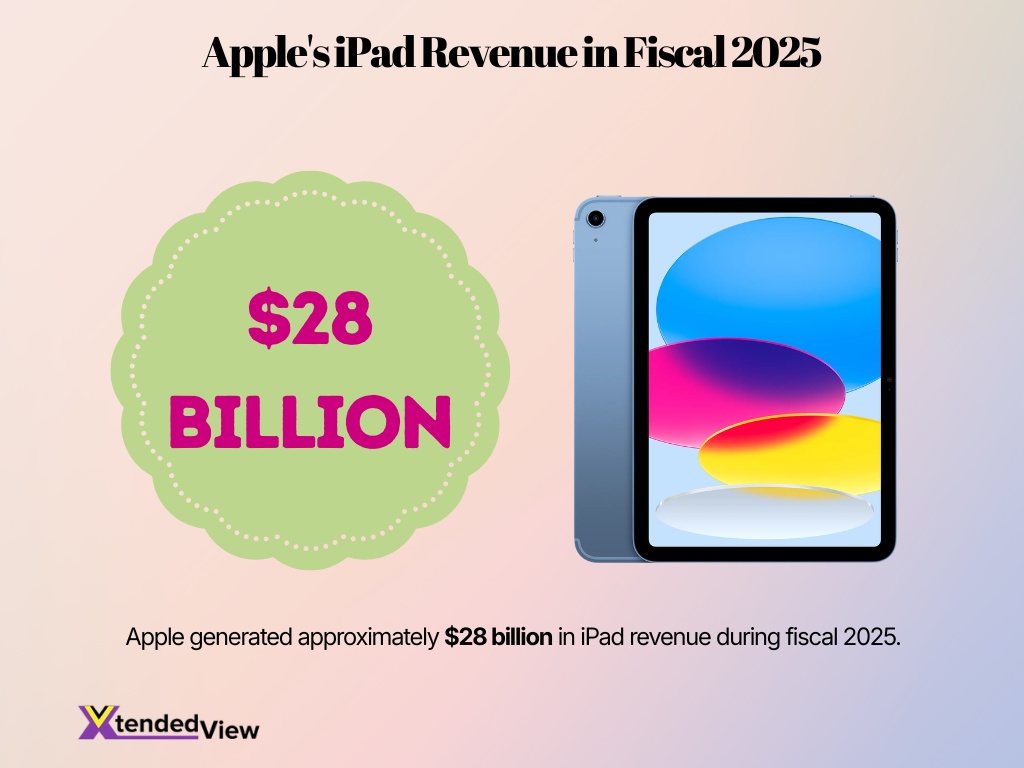
- iPad revenue rose to roughly $28 billion in fiscal 2025, increasing nearly 5% from 2024.
- Wearables, Home, and Accessories generated about $35.7 billion in fiscal 2025 revenue.
Apple Profit and Net Income Statistics
- Apple’s fiscal Q1 2026 net profit hit a record $42.1 billion on $143.8 billion in total revenue.
- Fiscal Q2 2026 diluted earnings per share reached $2.01, rising 22% year over year.
- Apple maintained a strong gross margin of 49.3% during fiscal Q2 2026.
- Services revenue hit an all-time quarterly high of $31 billion in Q2 2026, driving profitability.
- Operating cash flow generated in Q1 2026 reached a record $53.9 billion.
- Fiscal Q4 2025 diluted earnings per share increased to $1.85, up 13% annually.
- Share repurchases were bolstered by an additional $100 billion authorized in fiscal Q2 2026.
- Apple’s net quarterly profit for fiscal Q2 2026 stood at an impressive $29.6 billion.
- Annual Services revenue exceeded $109 billion during the previous year to diversify earnings.
Apple User Demographics and Behavior
- Households earning over $100,000 represent the most profitable demographic for Apple products.
- The iPhone maintains a commanding 57.24% market share of all smartphone users in the U.S.
- A staggering 88% of American teenagers currently own an iPhone as their primary device.
- Apple maintains an exceptional brand loyalty rate of over 90% across its global user base.
- Approximately 89% of teenage iPhone owners plan to stick with Apple for their next smartphone upgrade.
- iPhone users spend an average of $11.20 per month on apps compared to just $1.70 for Android users.
- Roughly 80% of iPhone users own at least one additional Apple device, such as an iPad or Apple Watch.
- About 77% of iPhone users who use a smartwatch exclusively choose the Apple Watch for seamless ecosystem integration.
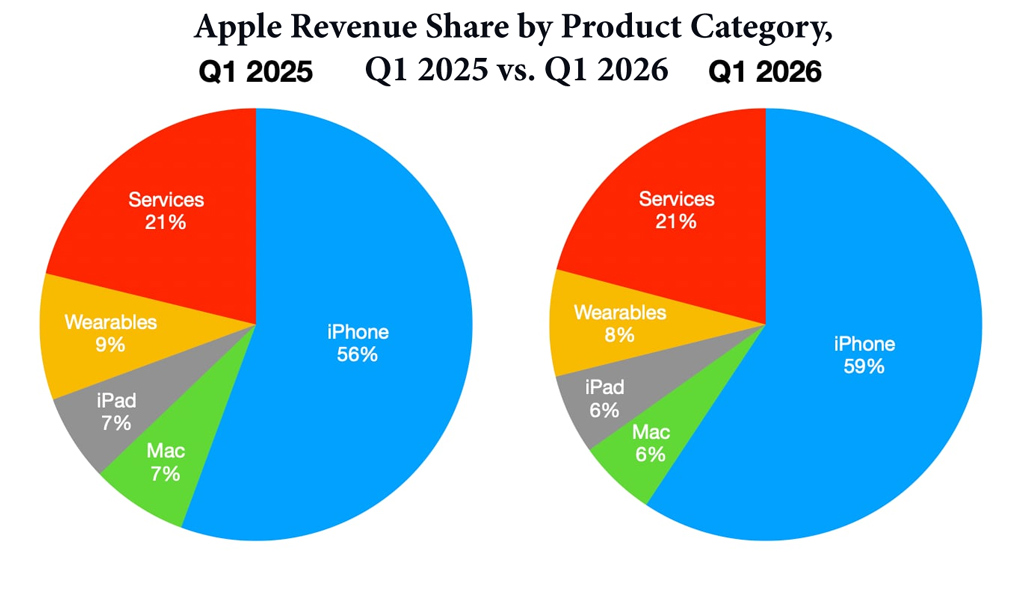
Apple Product Revenue Share Trends (Q1 2025 vs. Q1 2026)
- iPhone increased its revenue share from 56% in Q1 2025 to 59% in Q1 2026, strengthening its position as Apple’s largest revenue driver.
- Services maintained a steady 21% share of revenue in both Q1 2025 and Q1 2026, showing consistent business growth.
- Wearables revenue contribution declined slightly from 9% to 8% year over year.
- iPad’s share of Apple’s revenue fell from 7% in Q1 2025 to 6% in Q1 2026.
- Mac revenue share decreased from 7% to 6%, reflecting a modest reduction in its contribution.
- iPhone, Services, and Wearables together accounted for 86% of total revenue in Q1 2025.
- iPhone, Services, and Wearables represented 88% of total revenue in Q1 2026, highlighting greater reliance on these segments.
- The combined share of Mac and iPad declined from 14% in Q1 2025 to 12% in Q1 2026.
- iPhone generated nearly three times the revenue share of Services in both quarters.
- Apple’s revenue mix became more concentrated around the iPhone, which gained 3 percentage points year over year.
iPhone Sales and Market Share Statistics
- iPhone generated approximately $209.6 billion in revenue during fiscal 2025.
- The iPhone represented about 50.4% of Apple’s total revenue in fiscal 2025.
- Fiscal Q1 2026 iPhone revenue reached approximately $85.3 billion.
- Fiscal Q2 2026 iPhone revenue climbed to roughly $57 billion, up 22% year over year.
- iPhone revenue increased by more than 4% annually during fiscal 2025.
- Apple continues to rank among the world’s largest smartphone vendors by shipment volume and revenue.
- The United States remains Apple’s strongest smartphone market, with more than 150 million active iPhones in use.
- iPhone models were top-selling smartphones across key markets, including the U.S., Japan, the UK, and Australia, during 2026.
- Apple recorded a March-quarter record for iPhone upgraders in fiscal Q2 2026.
- Customer satisfaction for the latest iPhone generation measured 99% in the U.S., highlighting strong brand loyalty.
iPhone User Statistics
- Apple’s global iPhone user base surpassed 1.4 billion active users in 2025, making it the world’s largest premium smartphone ecosystem.
- More than 150 million Americans actively use an iPhone, representing over half of the U.S. smartphone market.
- Approximately 87% of U.S. teenagers own an iPhone in 2025, while 88% expect their next phone to be an iPhone.
- iPhone customer satisfaction remained at 99% in the United States during 2025 and early 2026.
- Over 90% of iPhone users stay within the Apple ecosystem when upgrading devices.
- Apple Pay adoption continued to grow, with hundreds of millions of iPhone users making mobile payments worldwide.
- More than 75% of active iPhones run one of the latest iOS versions, significantly higher than Android upgrade rates.
- The average iPhone replacement cycle in developed markets ranges between 3.5 and 4 years.
- The U.S., China, Japan, the UK, and India remain Apple’s largest iPhone user markets.
- Apple Intelligence features contributed to increased engagement among newer iPhone users during 2025 and 2026.
iPad Usage and Sales Statistics
- Apple generated approximately $28 billion in iPad revenue during fiscal 2025.
- Fiscal Q1 2026 iPad revenue reached $8.1 billion, driven by strong demand for newer iPad Pro and iPad Air models.
- Apple shipped an estimated 57 million iPads globally in 2025, maintaining leadership in the tablet market.
- iPad accounted for roughly 38% of worldwide tablet shipments during 2025.
- More than 300 million active iPads are estimated to be in use globally.
- Education remains one of the largest iPad segments, particularly across U.S. K-12 schools and universities.
- Enterprise adoption of iPad continues to expand in healthcare, retail, aviation, and field-service industries.
- Apple recorded double-digit iPad revenue growth during several quarters of fiscal 2025.
- The iPad Pro remains one of the highest-selling premium tablets globally.
- Apple’s tablet ecosystem generated significantly higher customer retention rates than competing platforms.
Mac and Computer Sales Statistics
- Apple reported approximately $33.7 billion in Mac revenue during fiscal 2025.
- Fiscal Q1 2026 Mac revenue reached nearly $9 billion, establishing a quarterly record.
- Apple shipped roughly 22 million Mac computers worldwide in 2025.
- Mac’s market share in the U.S. PC market exceeded 15% during several quarters of 2025.
- Apple’s M-series processors helped drive Mac revenue growth above 12% year over year in fiscal 2025.
- MacBook Air remained Apple’s best-selling computer product line.
- Enterprise Mac adoption continued to expand as businesses migrated to Apple Silicon devices.
- The installed base of active Macs reached an all-time high in 2026.
- Customer satisfaction rates for Mac products consistently exceeded 95% across major surveys.
- Apple maintained its position among the world’s top five PC manufacturers by revenue.
Apple Watch and Wearables Statistics
- Apple Watch remains the world’s best-selling smartwatch brand.
- Apple generated approximately $35.7 billion from Wearables, Home, and Accessories during fiscal 2025.
- More than 250 million Apple Watches have been sold since launch.
- Apple Watch holds an estimated 20% to 25% share of the global smartwatch market.
- Health monitoring features continue driving adoption among fitness and healthcare users.
- Apple Watch usage expanded across heart-rate tracking, sleep monitoring, ECG analysis, and fitness subscriptions.
- The wearable ecosystem, including AirPods and Apple Watch, contributes billions in recurring accessory revenue annually.
- Apple Watch customer satisfaction consistently exceeds 95% in major consumer surveys.
- The United States remains Apple’s largest smartwatch market.
- Wearables generated nearly 9% of Apple’s total revenue during fiscal 2025.
Key iOS App Category Statistics
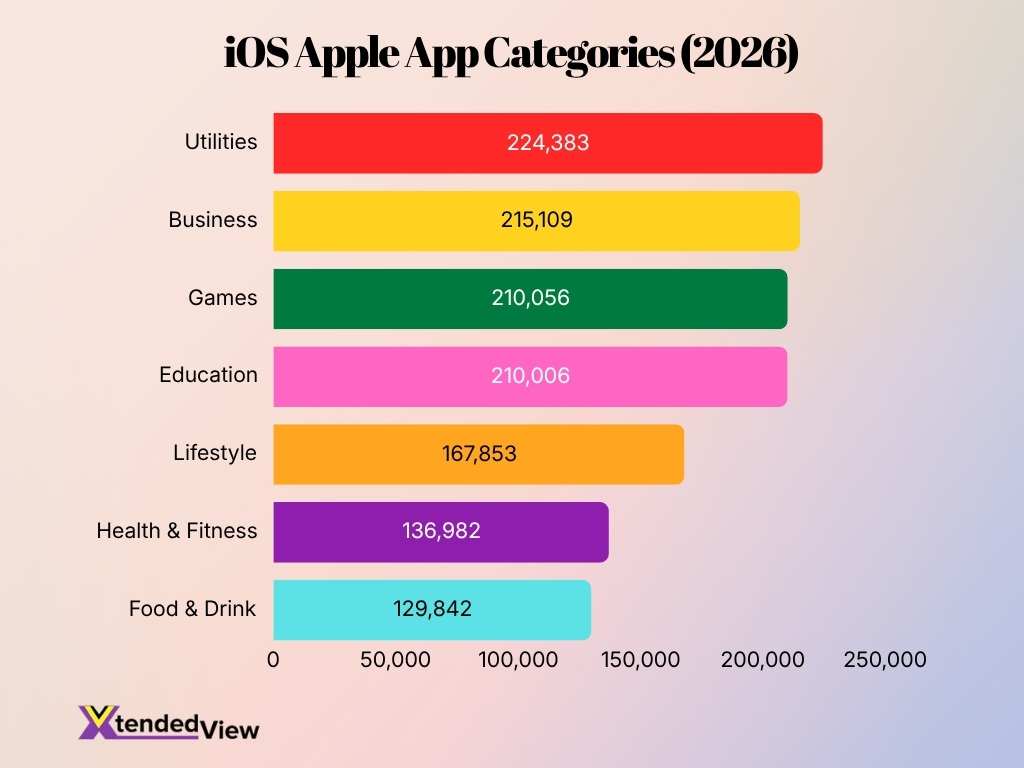
- Utilities was the largest iOS app category with 224,383 apps, leading all other segments.
- Business ranked second with 215,109 apps, highlighting strong demand for productivity tools.
- Games remained a dominant category with 210,056 apps available on the App Store.
- Education closely followed Games with 210,006 apps, showing continued growth in learning focused apps.
- Lifestyle accounted for 167,853 apps, making it the fifth largest category on iOS.
- Health & Fitness featured 136,982 apps, reflecting sustained interest in wellness and activity tracking.
- Food & Drink had 129,842 apps, representing the smallest category among the top seven listed.
- The gap between Utilities (224,383) and Food & Drink (129,842) reached 94,541 apps.
- Four categories, Utilities, Business, Games, and Education, each exceeded 210,000 apps.
- Utilities, Business, and Games collectively represented more than 649,000 apps across the iOS ecosystem.
Apple Services and Subscription Statistics
- Apple Services generated approximately $109.2 billion in revenue during fiscal 2025.
- Services revenue increased from roughly $96.2 billion in fiscal 2024 to over $109 billion in 2025.
- Apple now has more than 1 billion paid subscriptions across its services ecosystem.
- Fiscal Q1 2026 Services revenue exceeded $30 billion for the first time.
- Apple Music, iCloud+, Apple TV+, Apple Arcade, and Apple Fitness+ continue driving subscription growth.
- Apple Pay processes billions of transactions annually across dozens of countries and regions.
- Apple reported record levels of paid accounts and transacting accounts during 2026.
- Services now contribute more than one-quarter of Apple’s total revenue.
- Gross margins in the Services business remain significantly higher than hardware margins.
- Apple TV+ expanded its content library substantially during 2025 and 2026, increasing subscriber engagement.
Apple Device Installed Base Statistics
- Apple’s active installed base officially exceeded 2.5 billion devices globally during fiscal Q1 2026.
- The global installed base grew by approximately 150 million devices between January 2025 and January 2026.
- There are currently more than 1.5 billion active iPhones in use worldwide, driving the ecosystem’s overall growth.
- Apple shipped a record 247.8 million iPhones globally in 2025, continuously strengthening the active user base.
- The expanding hardware network now supports over 1 billion paid subscriptions across all connected Apple platforms.
- The App Store serves an average of more than 850 million weekly active users across 175 countries.
- Apple’s Wearables segment contributed significantly to the active base by selling approximately 33 million Watches in 2025.
- The company’s total active device count has nearly doubled since 2019, when it first reached 1.4 billion units.
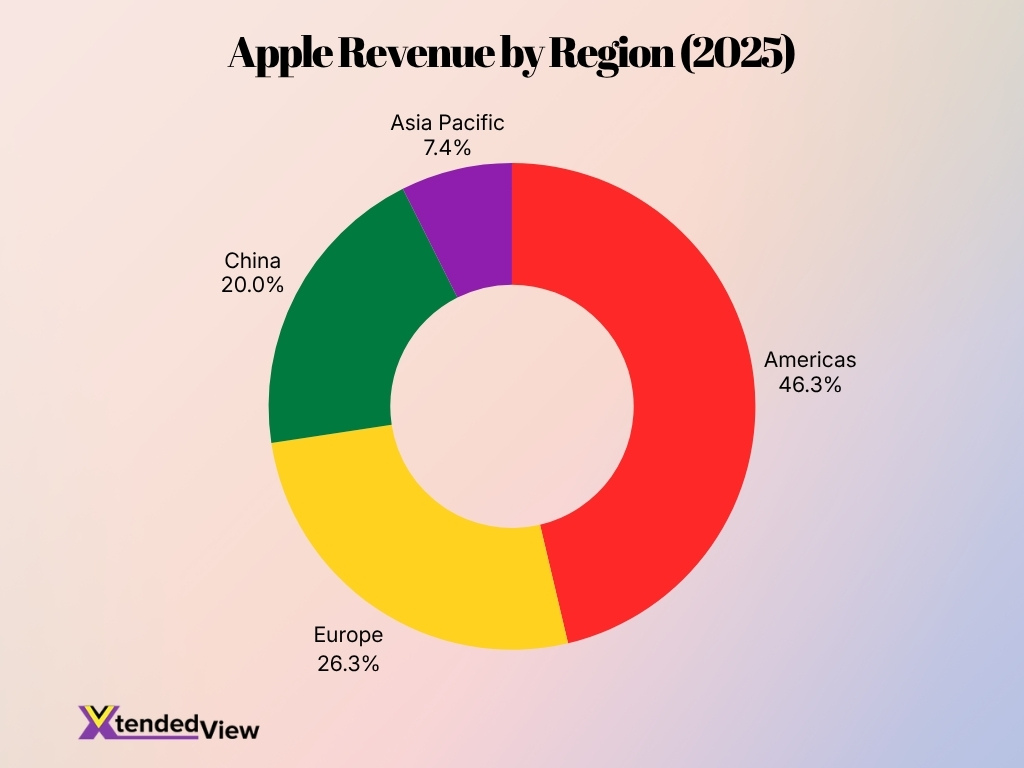
Apple Revenue Distribution by Region
- Americas generated the largest share of Apple revenue at 46.3%, contributing nearly half of total global revenue.
- Europe accounted for 26.3% of Apple revenue, making it the company’s second largest regional market.
- China contributed 20.0% of total revenue, highlighting its strategic importance to Apple’s business.
- Asia Pacific represented 7.4% of revenue, the smallest share among the regions shown.
- The Americas and Europe combined generated 72.6% of Apple’s total regional revenue.
- Apple earned more than twice as much revenue in the Americas (46.3%) than in China (20.0%).
- The revenue gap between Europe (26.3%) and China (20.0%) stood at 6.3 percentage points.
- The Americas generated 6.3 times more revenue than the Asia Pacific region (7.4%).
Apple Employee and Workforce Statistics
- Apple employs 166,000 full-time workers globally as of 2025.
- The company operates over 530 retail locations across 25 countries.
- Apple generates an industry-leading $2.5 million in revenue per employee.
- Women represent 35% of the global workforce across all departments.
- Engineering and research teams make up roughly 41% of all employees.
- The company committed to hiring 20,000 new U.S. workers starting in 2025.
- The U.S. economy benefits from over 2 million jobs supported by Apple.
- The tech giant is investing $500 billion in U.S. operations over four years.
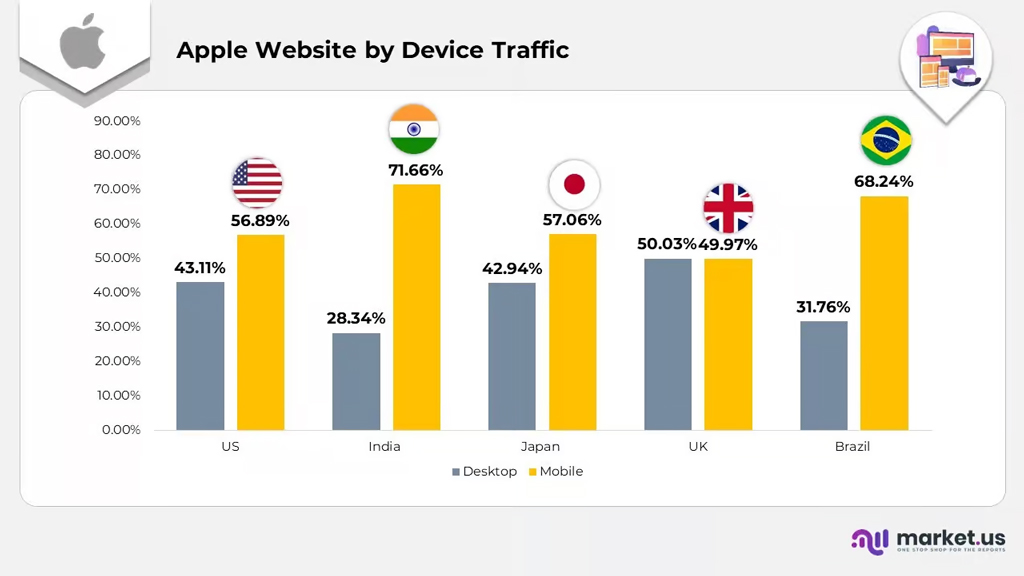
Apple Website Traffic by Device Insights
- India recorded the highest mobile traffic share at 71.66%, highlighting strong smartphone-driven engagement with Apple’s website.
- Brazil ranked second for mobile traffic at 68.24%, showing a clear preference for mobile browsing.
- The United States generated 56.89% mobile traffic and 43.11% desktop traffic, indicating mobile devices lead user visits.
- Japan saw 57.06% mobile traffic compared to 42.94% desktop traffic, reflecting a balanced but mobile-first audience.
- The United Kingdom had the most balanced split, with 50.03% desktop traffic and 49.97% mobile traffic.
- The UK was the only market where desktop traffic slightly exceeded mobile traffic.
- India reported the lowest desktop traffic share at 28.34%, emphasizing heavy reliance on mobile devices.
- Brazil’s desktop traffic accounted for just 31.76%, significantly lower than its mobile share.
- Across 4 of 5 countries, mobile traffic exceeded desktop traffic, demonstrating the dominance of mobile access.
- The gap between mobile and desktop traffic was the largest in India at 43.32 percentage points.
Apple Environmental and Sustainability Statistics
- Apple has maintained 100% carbon neutrality across its global corporate operations since 2020.
- The company is targeting a 75% reduction in emissions to achieve a 100% carbon-neutral footprint by 2030.
- Suppliers utilizing clean energy generated 38 million megawatt-hours in 2025, avoiding 26 million metric tons of emissions.
- Supplier renewable energy initiatives have scaled up to support 20.7 gigawatts of clean electricity capacity globally.
- Apple has successfully reduced its total greenhouse gas emissions by more than 60% relative to 2015 baseline levels.
- A record 30% of all material used across shipped products in 2025 came from recycled content.
- All Apple-designed batteries use 100% recycled cobalt, and product magnets feature 100% recycled rare earth elements.
- Reaching 100% fiber-based packaging successfully avoided more than 15,000 metric tons of plastic waste over five years.
- Expanding water conservation initiatives successfully saved 17 billion gallons of freshwater globally in 2025.
- The recycling robot Daisy supports circular manufacturing by disassembling 200 devices per hour across 36 iPhone models.
Apple Research and Development (R&D) Statistics
- Apple spent approximately $31.4 billion on research and development during fiscal 2025.
- R&D spending increased from about $29.9 billion in fiscal 2024, reflecting continued investment in innovation.
- Apple has more than doubled its annual R&D spending compared with five years ago.
- Research and development expenses represented roughly 7.5% of total revenue during fiscal 2025.
- Significant investments continue across artificial intelligence, machine learning, silicon engineering, and augmented reality.
- Apple Silicon remains one of the company’s most successful long-term R&D initiatives.
- The company files thousands of patents annually across hardware, software, semiconductor, and health technologies.
- Apple continues investing heavily in healthcare features for the Apple Watch and related wellness technologies.
- AI-related development accelerated during 2025 and 2026 following the rollout of Apple Intelligence.
- The company maintains research facilities and engineering teams across North America, Europe, Asia, and Israel.
Frequently Asked Questions (FAQs)
Apple generated approximately $416.2 billion in revenue during fiscal 2025, a 6.4% increase from the previous year.
Apple reported an installed base of more than 2.5 billion active devices worldwide as of fiscal Q1 2026.
Apple’s Services business generated approximately $109.2 billion in annual revenue during fiscal 2025.
Apple reported a record $112 billion in net income for fiscal 2025.
Apple has more than 1 billion paid subscriptions across its services ecosystem.
Conclusion
Apple entered the year with strong momentum across nearly every part of its business. Revenue reached new highs, Services surpassed the $100 billion annual mark, and the installed device base exceeded 2.5 billion active devices. At the same time, iPhone remained the company’s largest revenue driver, while Mac, iPad, Wearables, and Services all contributed meaningful growth.
Looking ahead, Apple continues to invest heavily in artificial intelligence, custom silicon, sustainability initiatives, and subscription services. Its combination of a massive installed base, high customer loyalty, and recurring revenue streams positions the company to remain one of the most influential technology businesses in the global market.