
Apple Pay has evolved from a convenient mobile wallet into one of the world’s largest digital payment platforms. Consumers now use it for in-store purchases, online checkout, transit payments, subscriptions, and peer-to-peer transactions. Its growth influences retailers, banks, e-commerce platforms, and payment processors across the United States and worldwide.
As contactless payments become standard, Apple Pay continues to gain users, transaction volume, and merchant acceptance. The statistics below highlight how Apple Pay is shaping the future of digital commerce and consumer payments.
Editor’s Choice
- Apple Pay processed more than $9 trillion in transaction volume during 2025, making it one of the world’s largest payment platforms.
- Apple Pay had approximately 785 million active users worldwide by 2024, with continued growth through 2025 and 2026.
- Apple Pay users in the United States are projected to reach 67 million in 2026, up from 63.9 million in 2025.
- Apple Pay accounts for roughly 54% of U.S. in-store mobile wallet transactions, maintaining leadership in the sector.
- Apple Pay is accepted by more than 90% of U.S. retailers.
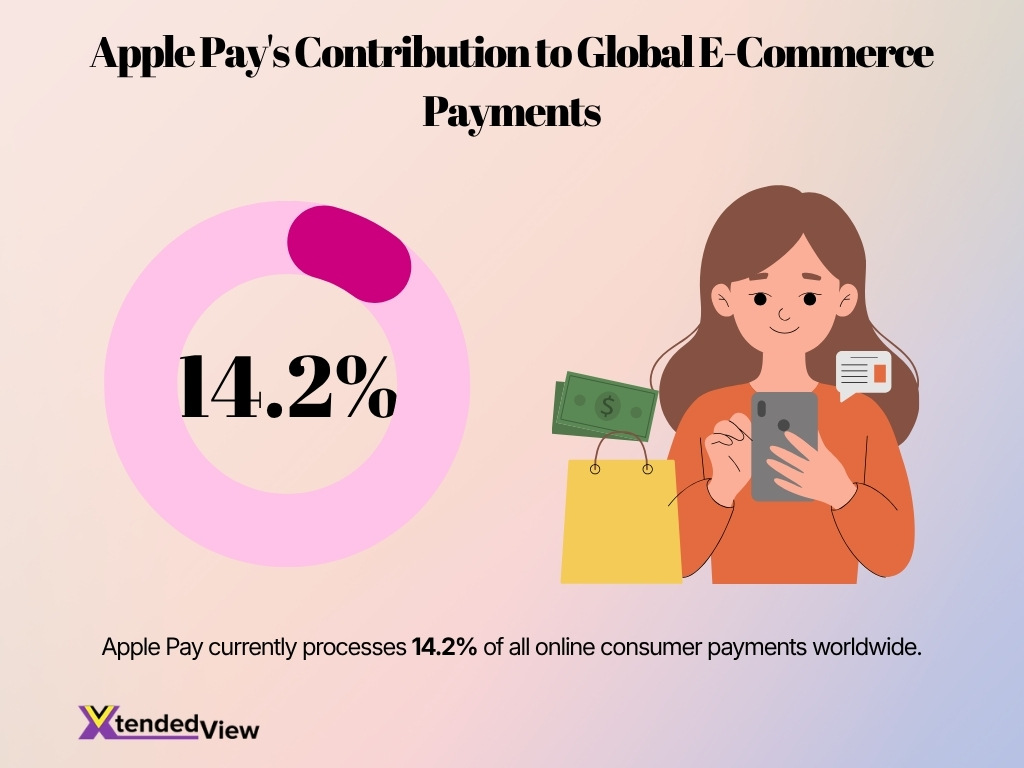
- Consumers use Apple Pay in approximately 14.2% of online consumer payments.
- Apple Pay is available across 95 countries and regions, supporting its global expansion strategy.
Recent Developments
- Apple Pay’s estimated annual in-store sales volume increased from $268 billion in 2024 to $450 billion in 2025.
- Apple Pay’s share of eligible U.S. in-store transactions rose from 8.9% in 2024 to 10.2% in 2025.
- Weekly digital wallet usage in stores climbed from 14% to more than 30% year over year, with Apple Pay driving much of the growth.
- Apple Pay reportedly generated over $100 billion in incremental merchant sales through improved authorization rates and customer engagement.
- Mobile wallet use reached 31% of shoppers weekly in 2026, compared with 14% in 2024.
- Apple Pay usage in stores doubled among surveyed consumers, increasing from 8% to 16% year over year.
- Industry forecasts suggest Apple Pay now handles roughly 10% of global card transaction volume.
- Growth in contactless payments has helped Apple Pay strengthen its position in grocery, restaurant, and convenience store transactions.
- Apple Pay continues to benefit from the broader mobile payment market, which reached nearly $5 trillion globally in 2025.
Key Apple Pay Statistics
- Apple Pay active users increased from 337 million in 2017 to 785 million in 2024.
- Approximately 80% of eligible Apple users have activated Apple Pay on their devices.
- Apple Pay processed over $8.5 trillion in payments during 2024.
- Transaction volume exceeded $9 trillion in 2025, according to industry estimates.
- Apple Pay facilitates more than $7.6 trillion in annual transactions globally, based on 2025 estimates.
- Apple Pay now ranks among the world’s largest payment processors by transaction volume.
- Apple Pay holds around 49% of the U.S. mobile wallet market.
- The platform processes roughly 14.2% of online consumer payments.
- Apple Pay remains available across iPhone, Apple Watch, iPad, Mac, and supported websites and applications.
Apple Pay User Growth Statistics
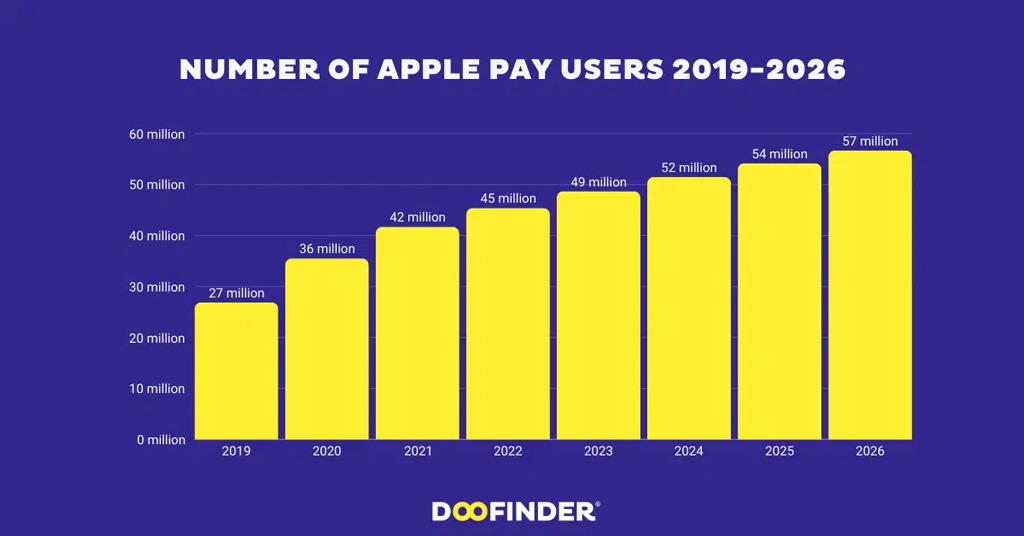
- Apple Pay users more than doubled, rising from 27 million in 2019 to 57 million in 2026.
- 2020 recorded the largest annual increase, adding 9 million new users compared to 2019.
- The platform surpassed 40 million users in 2021, reaching 42 million globally.
- Apple Pay’s user base grew from 45 million in 2022 to 49 million in 2023, an increase of 8.9%.
- The service crossed the 50 million user milestone in 2024, reaching 52 million users.
- Apple Pay is projected to add 5 million users between 2024 and 2026, growing from 52 million to 57 million.
- Between 2019 and 2026, Apple Pay gained 30 million users, representing an overall growth of approximately 111%.
- User adoption remained consistent after 2021, with annual increases ranging from 3 million to 4 million users.
- By 2025, Apple Pay’s global user base is expected to reach 54 million, doubling its 2019 size.
- The 2026 forecast of 57 million users marks the highest Apple Pay user count recorded during the period.
Apple Pay Usage in the United States
- Apple Pay users in the United States reached approximately 60.2 million in 2024.
- U.S. users increased to an estimated 63.9 million in 2025.
- Apple Pay users are projected to reach 67 million in 2026.
- Apple Pay accounts for nearly one-quarter of the U.S. population in 2026.
- More than 90% of U.S. retailers accept Apple Pay.
- Apple Pay captures around 54% of U.S. in-store mobile wallet transactions.
- Apple Pay represents approximately 49% of U.S. mobile wallet users.
- Apple Pay accounted for 10.2% of all U.S. in-store transactions during 2025.
- U.S. Apple Pay transaction volume reached an estimated $2.9 trillion in 2025.
Apple Pay Market Share Statistics
- Apple Pay holds approximately 49% of the U.S. mobile wallet market.
- Apple Pay accounts for roughly 54% of all U.S. in-store mobile wallet transactions.
- Apple Pay represents more than 50% of in-store mobile wallet payments in the United States.
- Apple Pay processes around 14.2% of online consumer payments.
- Apple Pay controls an estimated 14.22% share of the online payments market.
- Apple Pay accounts for approximately 10% of global card transactions.
- Apple Pay captured roughly 5.6% of total retail sales at the ten-year milestone.
- Apple Pay remains the largest mobile wallet platform in the United States by user share and transaction share.
- Apple Pay’s market leadership continues to strengthen as contactless and digital wallet adoption expands nationwide.
Apple Pay Demographics by Generation
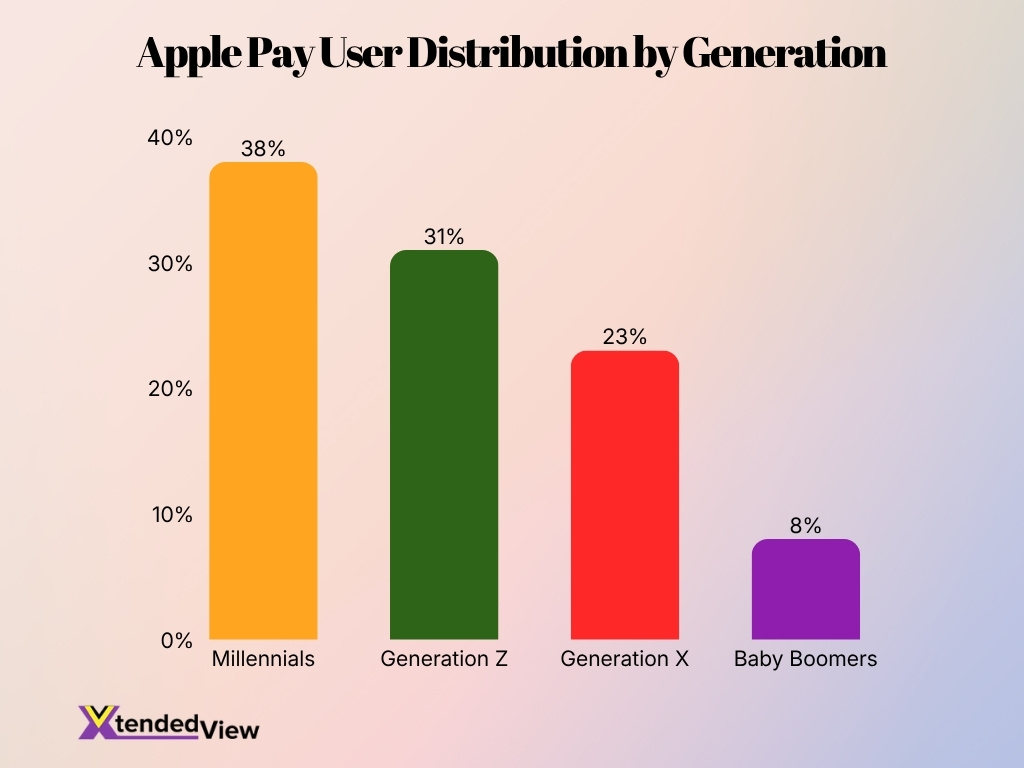
- Millennials remain the largest Apple Pay user group, accounting for roughly 38% of users.
- Generation Z represents approximately 31% of Apple Pay users, making it the fastest-growing demographic segment.
- Generation X contributes nearly 23% of Apple Pay users.
- Baby Boomers account for about 8% of Apple Pay users, although adoption continues to increase.
- More than 70% of younger smartphone users prefer digital wallets over carrying physical wallets regularly.
- Consumers aged 18 to 34 demonstrate the highest frequency of Apple Pay usage across retail and food-service purchases.
- Gen Z users are significantly more likely to use Apple Pay for peer-to-peer and mobile commerce transactions.
- Higher-income households show above-average Apple Pay adoption due to stronger iPhone ownership rates.
- Urban consumers continue to adopt Apple Pay faster than rural consumers because of broader merchant acceptance.
Apple Pay Transaction Volume and Revenue Statistics
- Apple Pay processed more than $9 trillion in global transaction volume during 2025, up from approximately $8.5 trillion in 2024.
- Annual Apple Pay transaction volume has grown by more than 800% since 2019, reflecting rapid consumer adoption.
- U.S. Apple Pay transaction volume reached an estimated $2.9 trillion in 2025.
- Apple Pay’s in-store payment volume increased from roughly $268 billion in 2024 to $450 billion in 2025.
- Apple Pay users now complete billions of transactions annually across retail, transit, dining, and e-commerce categories.
- Industry estimates suggest Apple Pay contributes more than $100 billion in additional merchant sales annually through streamlined checkout experiences.
- Apple Pay processes nearly 10% of global card payment volume, highlighting its growing influence within the payments ecosystem.
- Mobile wallet transaction values worldwide surpassed $17 trillion in 2025, creating a favorable environment for Apple Pay growth.
- Apple Pay remains one of the largest payment platforms globally when measured by annual transaction value.
Apple Pay Adoption by Merchants and Businesses
- More than 90% of U.S. retailers now accept Apple Pay.
- Apple Pay acceptance exceeds 85% among major U.S. merchants, including grocery chains, pharmacies, and restaurants.
- Over 4 million merchant locations in the United States support Apple Pay payments.
- Apple Pay acceptance continues to expand among small and midsize businesses through contactless-enabled payment terminals.
- More than 75% of the world’s top retailers support Apple Pay online or in-store.
- Transit agencies in dozens of major cities now accept Apple Pay for ticketing and fare collection.
- Restaurants and quick-service chains rank among the fastest-growing Apple Pay merchant categories.
- Apple Pay integration has become standard among leading POS providers and payment processors.
- Merchant adoption accelerated significantly after the expansion of contactless payment infrastructure across North America and Europe.
Apple Pay In-Store vs. Online Spending Trends
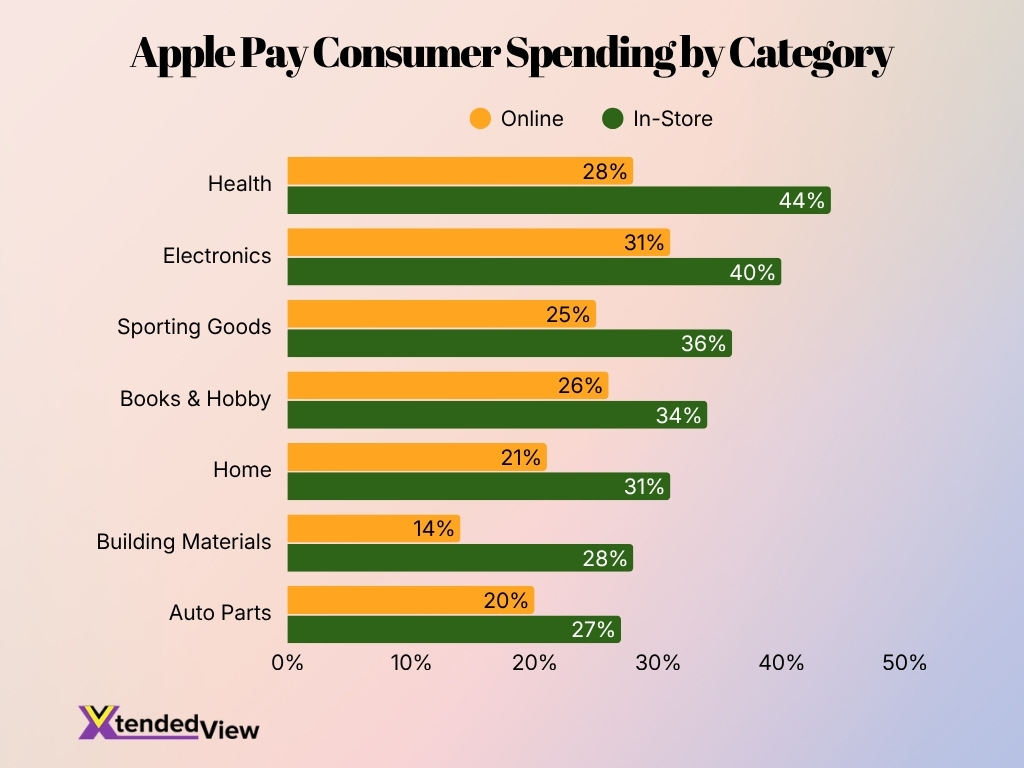
- Health led Apple Pay spending, with 44% of users making in-store purchases compared to 28% online.
- Electronics ranked second, accounting for 40% of in-store spending and 31% of online purchases.
- Sporting Goods saw strong Apple Pay usage, with 36% spent in-store versus 25% online.
- Books & Hobby purchases reached 34% in store, exceeding the 26% recorded online.
- Home-related purchases generated 31% in store spending, while online spending stood at 21%.
- Building Materials showed the largest gap, with 28% in store spending compared to only 14% online.
- Auto Parts purchases accounted for 27% in store transactions and 20% through online channels.
- In-store spending exceeded online spending across all categories, highlighting stronger physical retail usage of Apple Pay.
- The highest online spending category was Electronics at 31%, followed by Health at 28%.
- Apple Pay was used most frequently for Health, Electronics, and Sporting Goods, each recording more than 35% in store spending.
Apple Pay Security and Fraud Prevention Statistics
- Apple Pay eliminated over $1 billion in potential fraud during the past year.
- The platform maintains a fraud rate approximately 60% lower than traditional card transactions.
- Tokenization technology has driven a 67% reduction in digital payment fraud globally.
- The Apple ecosystem blocked over $2 billion in fraudulent transactions in 2024 alone.
- More than 8,300 banks worldwide support Apple Pay for its advanced security framework.
- Organizations using tokenization report 50% fewer security incidents involving sensitive payment data.
- Apple rejected over 711 million fraudulent account creations to protect its payment ecosystem.
- Around 90% of U.S. retailers trust and accept Apple Pay for secure contactless transactions.
Apple Pay Geographic Reach Statistics
- Apple Pay is currently available in 95 countries and regions globally as of 2026.
- The platform’s global reach has expanded to over 785 million active users worldwide.
- North America leads the global market by accounting for 45% of all Apple Pay transactions.
- For in-store usage, the United Kingdom ranks first globally with a 67% adoption rate.
- Over 11,000 banks worldwide currently support the payment service to ensure broad accessibility.
- The service handles approximately 12% of all online card transactions on a global scale.
- Apple Pay has achieved near-ubiquity in the United States, with 94% of retail establishments accepting it.
- Adoption in emerging markets like India and Brazil surged by 35% due to strategic local banking partnerships.
Apple Pay Consumer Satisfaction Statistics
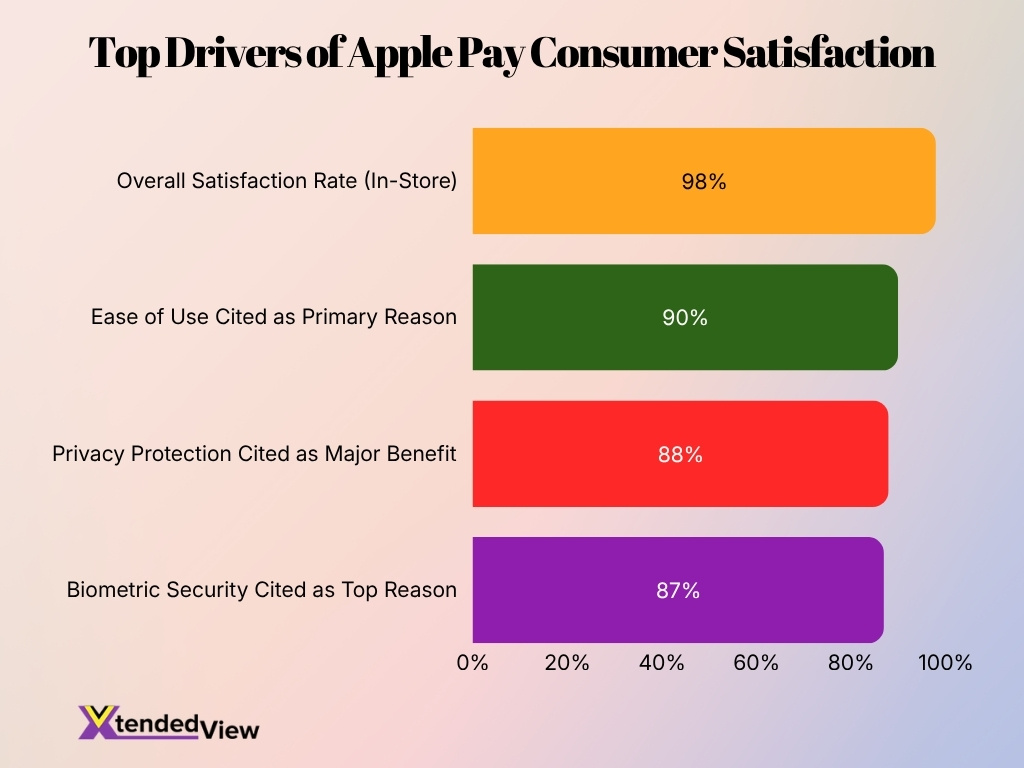
- Apple Pay maintains a 98% satisfaction rate among customers making in-store mobile payments.
- 90% of consumers cite ease of use as their primary reason for adopting the payment service.
- Strict privacy protection drives loyalty, with 88% of users highlighting it as a major benefit.
- 87% of customers point to biometric security features like Face ID as a top reason for usage.
- An impressive 85% of U.S. users report being very or extremely satisfied with the platform.
- A staggering 98% of active users indicate they are highly likely to recommend Apple Pay to others.
- The platform captures a 54% share of all U.S. in-store mobile wallet transactions due to high consumer preference.
- 71% of Gen Z mobile wallet users choose Apple Pay as their first payment option for daily purchases.
- Among digital wallet users earning over $100,000 annually, 57% use Apple Pay every week.
Apple Pay Banking and Financial Institution Partnerships
- Apple Pay is currently supported by more than 11,000 bank and network partners worldwide.
- Over 8,300 banks globally support the digital wallet, with 72% serving U.S. customers.
- The payment service originally launched in 2014 with fewer than a dozen financial institutions.
- Tokenized digital wallet transactions accounted for 29% of all Visa transactions as of mid-2024.
- Credit card issuers typically pay a 0.15% fee for each Apple Pay purchase as a tokenization guarantee.
- Apple Pay securely operates across 89 markets, integrating with thousands of international bank accounts.
- The platform processes an estimated $450 billion in annual in-store sales volume through partner banking networks.
- In Australia, local banks previously resisted sharing their 50 cents per $100 profit due to Apple’s 30% fee structure.
Apple Pay E-commerce Statistics
- Apple Pay currently processes 14.2% of all online consumer payments worldwide.
- The number of U.S. Apple Pay users is forecast to hit 67 million by 2026.
- Over 44% of digital subscription services feature Apple Pay as a preferred payment option.
- Apple Pay accounted for roughly 12% of all online card transactions globally in 2023.
- Utilizing Apple Pay reduces average online checkout times by approximately 50%.
- Nearly 36% of U.S. consumers report using Apple Pay specifically for online shopping.
- Approximately 40% of online shoppers in the United Kingdom complete transactions using Apple Pay.
- Global in-app purchases made through Apple Pay have seen a 26% year-over-year increase.
- An estimated 73.1% of Gen Z digital wallet users make an Apple Pay transaction every week.
Apple Pay Contactless Payment Statistics
- More than 90% of U.S. retailers now support contactless payments compatible with Apple Pay.
- Apple Pay usage surged following the widespread rollout of NFC-enabled payment terminals.
- Contactless payment adoption accelerated dramatically after 2020 and continues to rise in 2026.
- Apple Pay accounted for approximately 10.2% of all eligible U.S. in-store purchases during 2025.
- Mobile wallet usage among shoppers increased from 14% in 2024 to 31% in 2026.
- Consumers consistently rank tap-to-pay functionality among Apple Pay’s most valuable features.
- Contactless transactions generally complete faster than chip-and-PIN transactions.
- Transit systems worldwide increasingly rely on Apple Pay-enabled contactless ticketing.
- The global contactless payment market is projected to continue expanding at a double-digit growth rate through the decade.
Apple Pay vs. Competitor Mobile Wallet Statistics
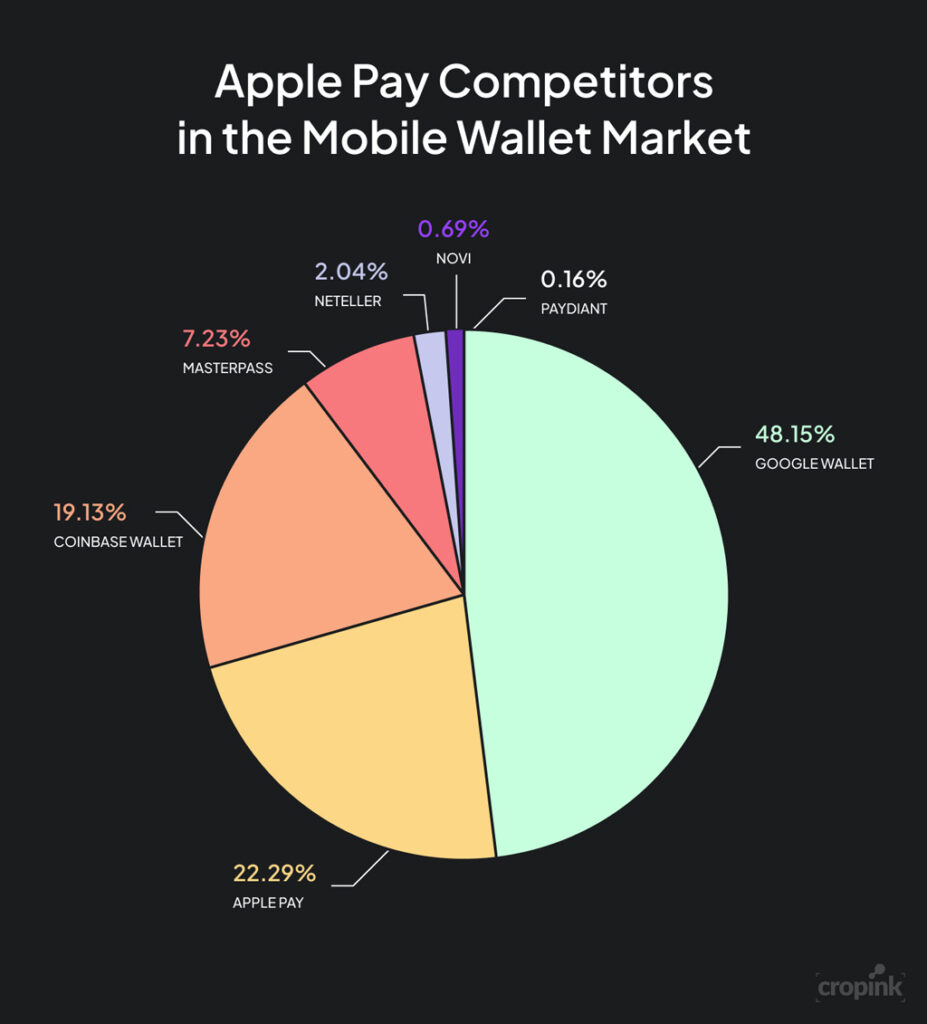
- Google Wallet leads the mobile wallet market with a dominant 48.15% share, more than double Apple Pay’s market presence.
- Apple Pay holds 22.29% of the market, making it the second-largest mobile wallet platform.
- Coinbase Wallet captures 19.13% market share, positioning it as a major competitor in the digital wallet space.
- Masterpass accounts for 7.23% of the market, trailing far behind the top three mobile wallet providers.
- Neteller maintains a modest 2.04% share, representing a small portion of the overall wallet market.
- Novi holds just 0.69% market share, reflecting limited adoption compared to leading competitors.
- Paydiant has the smallest presence with only 0.16% of the mobile wallet market.
- The top three wallets, Google Wallet, Apple Pay, and Coinbase Wallet, collectively control 89.57% of the market.
- Google Wallet’s 48.15% share exceeds the combined market share of Apple Pay and Masterpass (29.52%).
- Apple Pay’s 22.29% share is approximately 3.1 times larger than Masterpass’s 7.23% market share.
Future Growth and Projections for Apple Pay
- U.S. Apple Pay users are projected to reach 87.5 million by the end of 2026.
- Global Apple Pay users are projected to approach 1 billion by 2030 if current growth trends continue.
- Apple Pay handled $7.6 trillion in transactions in 2025 and is expected to see continued growth.
- Apple Pay is expected to maintain its dominant 54% share of all U.S. in-store mobile wallet transactions through 2026.
- Over 94% of U.S. retail establishments are expected to accept Apple Pay by 2026.
- Apple Pay is rapidly growing its e-commerce footprint by processing 14.2% of all online consumer payments.
- Apple Pay generated an estimated $5.6 billion in revenue in 2025, indicating strong future profitability.
- Gen Z consumers lead future growth prospects with a 71% preference rate for Apple Pay over other wallets.
- More than 11,000 banks worldwide support Apple Pay as of 2026 to align with global consumer behavior.
Frequently Asked Questions (FAQs)
Apple Pay had approximately 785 million active users worldwide by 2024, making it one of the largest mobile payment platforms globally.
Apple Pay holds around 49% of the U.S. mobile wallet market, maintaining the leading position among mobile payment services.
Apple Pay processed more than $9 trillion in global transaction volume during 2025, up from about $8.5 trillion in 2024.
More than 90% of U.S. retailers now accept Apple Pay as a payment method.
Apple Pay users in the United States are projected to reach approximately 67 million in 2026, compared with 63.9 million in 2025.
Conclusion
Apple Pay has transformed from a mobile wallet into a global payments platform processing trillions of dollars annually. Its strong position in the United States, expanding international presence, extensive banking partnerships, and growing merchant acceptance have helped it become a leader in digital payments.
The latest data show continued momentum across user adoption, transaction volume, e-commerce activity, and contactless payments. With mobile wallets becoming a preferred payment method for consumers worldwide, Apple Pay appears well-positioned to capture a larger share of both online and in-store transactions throughout the remainder of the decade.