Facebook Ads and Google Ads remain two of the largest channels for digital advertising, but marketers use them for different jobs. Google Ads captures active search intent across Search, YouTube, Maps, and other properties, while Facebook Ads helps brands discover, segment, and re-engage audiences through social feeds, video, and automated recommendations.
The distinction matters in real campaigns. An emergency plumbing company can use Google Ads to reach someone searching for a plumber immediately, while an apparel retailer can use Facebook Ads to introduce products to shoppers who have not searched for the brand yet. E-commerce companies also combine the platforms, using social advertising for product discovery and search advertising to capture subsequent high-intent demand.
The numbers below compare their scale, revenue, audience, and market position using the latest data available. Explore the full statistics to see where Facebook Ads and Google Ads stand.
Editor’s Choice
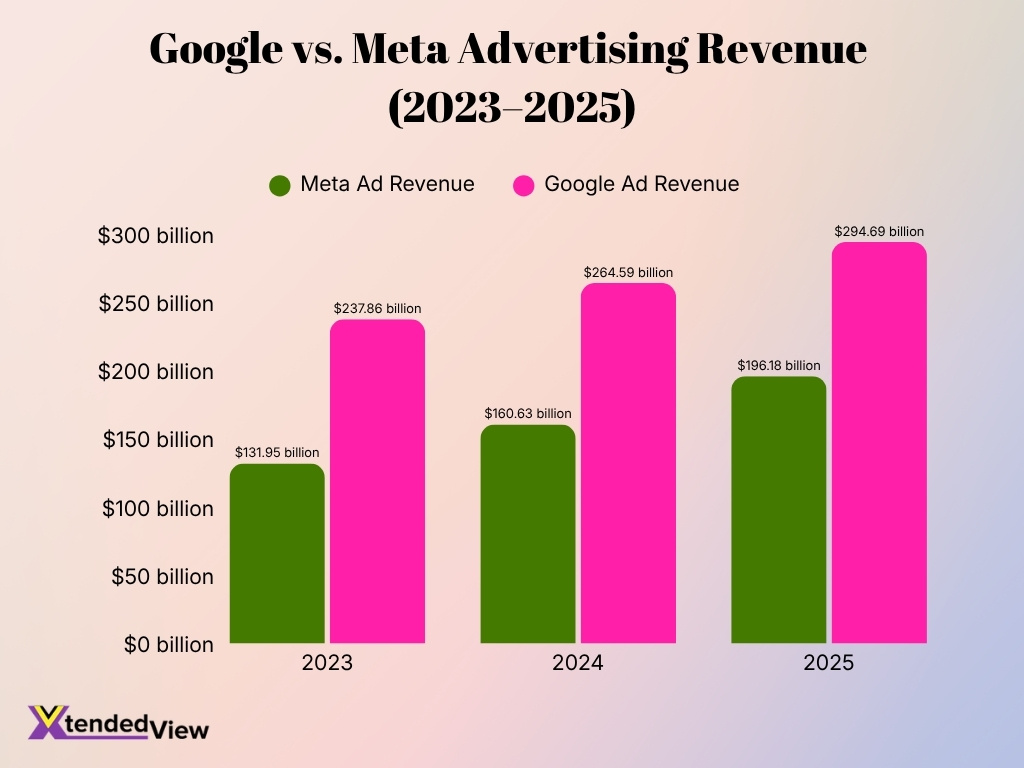
- Meta generated $196.18 billion in advertising revenue in 2025, up 22% from $160.63 billion in 2024. The increase shows how quickly advertising across Facebook and the wider family of apps expanded heading into 2026.
- Google generated $294.69 billion in advertising revenue in 2025, compared with $264.59 billion in 2024. Search and other advertising accounted for $224.53 billion of the 2025 total.
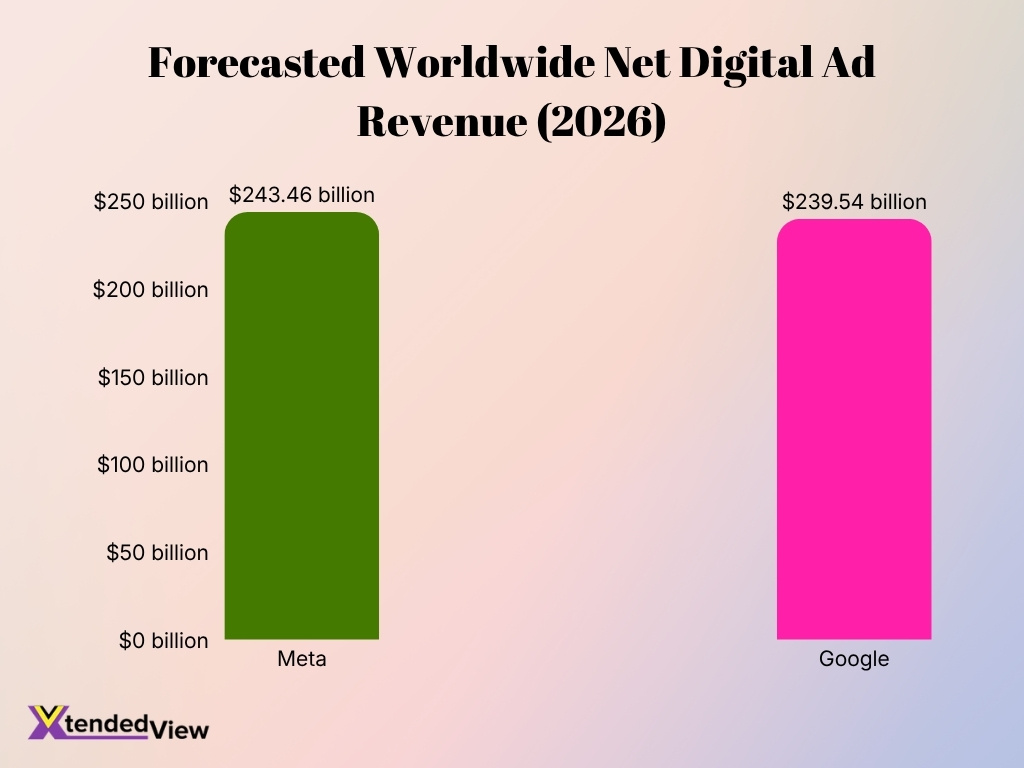
- However, 2026 forecasts point to a change in the competitive order. Meta is projected to generate $243.46 billion in net worldwide digital ad revenue during 2026, compared with $239.54 billion for Google.
- Meta is consequently forecast to capture 26.8% of worldwide digital ad spending in 2026, slightly ahead of Google’s 26.4% share. This represents a significant change in a market that Google has led for years.
- Google’s underlying search position remains much larger than any competing search engine. Google held 91.27% of the worldwide search engine market in June 2026, compared with 4.68% for Bing.
- Facebook ads had a potential worldwide audience of 2.28 billion people in January 2025, equal to 41.1% of global internet users. Its advertising audience grew by 93.3 million, or 4.3%, from January 2024.
- Meta’s advertising momentum continued into 2026. Second-quarter 2026 advertising revenue reached $59.36 billion, up 27% year over year, while ad impressions increased 14% and average price per ad increased 12%.
- Google advertising revenue reached $77.25 billion in Q1 2026, up from $66.89 billion in Q1 2025. Search and other advertising alone increased from $50.70 billion to $60.40 billion.
- Facebook maintains unusually broad penetration among U.S. adults. In a 2025 survey, 71% of U.S. adults reported using Facebook, with usage reaching 80% among adults ages 30 to 49.
- Google’s AI Max for Search campaigns initially produced 14% more conversions or conversion value at a similar CPA or ROAS on average. Campaigns relying mostly on exact and phrase match saw an average 27% uplift.
Recent Developments
- Meta’s advertising business accelerated in Q2 2026, generating $59.36 billion in quarterly ad revenue, compared with $46.56 billion in Q2 2025. That represents year-over-year growth of 27%.
- Meta delivered 14% more ad impressions across its family of apps in Q2 2026 than a year earlier. At the same time, the average price per ad increased 12%, meaning both inventory and monetization contributed to growth.
- Meta’s average Family daily active people reached 3.60 billion in June 2026, increasing 3% year over year. This metric covers activity across the company’s family of consumer apps rather than Facebook alone.
- Google’s Search and other revenue grew 17% year over year in Q2 2026, while YouTube advertising revenue increased 13%. These gains show that search and video advertising continued growing despite rapid changes in AI-driven discovery.
- AI Max has moved beyond its initial beta stage. In 2026, campaigns using its full feature suite produced an average 7% more conversions or conversion value at a similar CPA or ROAS than campaigns using search-term matching alone.
- Google reported that more than 1 million advertisers were already using Performance Max by April 2025. More than 90 quality improvements introduced during 2024 increased conversions and conversion value by over 10% for advertisers.
- Smart Bidding Exploration, introduced in 2025, increased unique search-query categories with conversions by an average of 18% and increased conversions by 19% in Google’s internal global testing.
- The competitive revenue picture also changed rapidly. Meta’s worldwide net digital advertising revenue is forecast to grow 24.1% in 2026, following 22.1% growth in 2025. Google’s corresponding 2026 growth rate is forecast at 11.9%.
- In another sign of Meta’s changing advertising mix, Instagram was projected to generate $32.03 billion in U.S. advertising revenue in 2025, up 24.4% from 2024 and representing 50.3% of Meta’s U.S. ad revenue. This matters when evaluating “Facebook Ads” because advertisers commonly manage Facebook and Instagram placements through the same advertising ecosystem.
Google Ads vs. Facebook Ads: Key Statistics and Insights
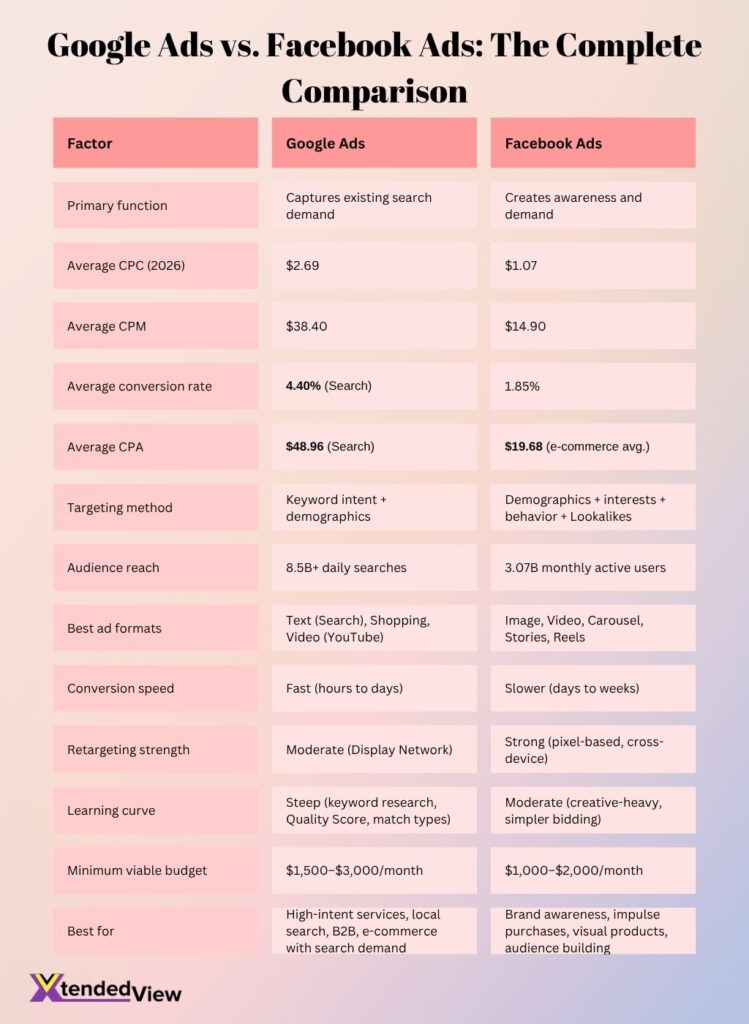
- Facebook Ads has a lower average CPC at $1.07, compared with $2.69 for Google Ads, making Facebook more cost-effective for generating clicks.
- The average CPM for Facebook Ads is $14.90, considerably below Google Ads at $38.40, giving Facebook an advantage for campaigns focused on reach and impressions.
- Google Search Ads achieve a 4.40% average conversion rate, compared with 1.85% for Facebook Ads, highlighting Google’s strength in capturing high-intent users.
- The average CPA stands at $48.96 for Google Search Ads, while Facebook Ads averages around $19.68 for e-commerce, although acquisition costs can vary substantially by industry.
- Google handles more than 8.5 billion searches per day, while Facebook reaches approximately 3.07 billion monthly active users, giving both platforms enormous advertising audiences.
- Google Ads typically converts users within hours to days, while Facebook campaigns may take days to weeks because users are often earlier in the purchase journey.
- Small businesses may need around $1,500 to $3,000 per month for Google Ads, compared with roughly $1,000 to $2,000 per month for Facebook Ads as a viable starting budget.
- Facebook Ads offers richer audience targeting, using demographics, interests, behaviors and Lookalike Audiences, while Google Ads primarily excels at keyword and search-intent targeting.
- Facebook Ads is stronger for visual advertising and retargeting, while Google Ads performs particularly well for high-intent services, local searches, B2B campaigns, and products with established search demand.
- Overall, Facebook Ads tends to win on advertising costs and audience targeting, while Google Ads leads in purchase intent and conversion rates, making the better platform dependent on the campaign objective.
Facebook Ads vs Google Ads Market Share
- The most notable 2026 forecast has Meta overtaking Google in worldwide digital advertising revenue share. Meta is expected to capture 26.8% of global digital ad spending, while Google is forecast at 26.4%.
- The forecast represents a reversal from 2025. Google generated an estimated $214.06 billion in worldwide net digital ad revenue in 2025, compared with $196.17 billion for Meta.
- For 2026, worldwide net digital advertising revenue is forecast at $243.46 billion for Meta and $239.54 billion for Google. The gap amounts to roughly $3.92 billion in Meta’s favor.
- Google’s share remains formidable because its search position has few direct peers. In June 2026, Google accounted for 91.27% of worldwide search engine usage, while all other measured engines combined held less than 9%.
- The wider U.S. digital market remains concentrated. Amazon, Google, and Meta collectively represented about 59% of U.S. advertising spending in 2025, up from 47% in 2020.
- However, that concentration no longer means Google automatically grows faster. Meta’s worldwide digital advertising revenue growth is forecast at 24.1% in 2026, more than double Google’s forecast 11.9% growth.
- Facebook’s scale also remains meaningful when measured through advertising reach. Its ads could reach 41.1% of global internet users in January 2025, even though the platform does not operate normally in every major market.
- Facebook’s potential global advertising audience increased by 93.3 million people from January 2024 to January 2025, representing 4.3% annual growth. Audience expansion gives the platform additional inventory even in a mature social advertising market.
- Meanwhile, Google’s 91.27% worldwide search share in June 2026 compares with 4.68% for Bing, 1.28% for Yahoo, 0.79% for Yandex, 0.67% for DuckDuckGo, and 0.43% for Baidu. That gap explains why Google Ads remains central to paid search strategy even as Meta challenges Google in total digital ad revenue.
Facebook Ads vs Google Ads User Reach and Audience Demographics
- Facebook’s worldwide advertising audience reached 2.28 billion users in January 2025. That equaled 27.9% of the world’s total population and 41.1% of global internet users.
- Among people ages 13 and older worldwide, Facebook’s advertising audience represented 35.3% of the eligible population in early 2025. Excluding China, where Facebook remained blocked, the eligible adoption rate rose to 43.7%.
- Facebook ads reached an estimated 39.4% of adults ages 18 and older worldwide in January 2025, showing that the platform still offers mass-market reach despite its maturity.
- In the U.S., Facebook’s potential advertising audience stood at 197 million users in early 2025. That represented 56.8% of the total U.S. population and 61.1% of U.S. internet users.
- Facebook’s U.S. ad reach increased by 6.05 million users, or 3.2%, between January 2024 and January 2025. It also increased by 4.20 million, or 2.2%, between October 2024 and January 2025.
- By the end of 2025, Facebook ads still reached 71.4% of U.S. adults ages 18 and older according to advertising-planning data. The adult audience was 53% female and 47% male.
- Independent survey data reinforces Facebook’s broad U.S. reach. In 2025, 71% of U.S. adults reported using Facebook, including 68% of 18- to 29-year-olds, 80% of 30- to 49-year-olds, 74% of 50- to 64-year-olds, and 57% of people 65 and older.
- Facebook also showed a gender gap in the 2025 U.S. survey: 78% of women used Facebook, compared with 63% of men. For advertisers, that 15-percentage-point difference can affect audience sizing in categories with strong gender skews.
- Google reaches audiences through more than search results. YouTube alone offered advertisers access to 253 million U.S. users in early 2025, equivalent to 78.5% of U.S. internet users. Its adult advertising audience was nearly evenly divided, at 50.2% female and 49.8% male.
- YouTube usage also exceeded Facebook usage across every U.S. age group in the 2025 survey: 95% vs. 68% among ages 18-29, 92% vs. 80% among ages 30-49, 85% vs. 74% among ages 50-64, and 64% vs. 57% among ages 65 and older. This does not measure Google Search reach, but it demonstrates the additional audience scale available within the broader Google Ads ecosystem.
Facebook Ads vs Google Ads Advertising Revenue
- Meta generated $196.18 billion from advertising in 2025, compared with $160.63 billion in 2024 and $131.95 billion in 2023. Advertising revenue therefore increased by roughly $64.23 billion in two years.
- Google’s advertising revenue reached $294.69 billion in 2025, up from $264.59 billion in 2024 and $237.86 billion in 2023. Google therefore generated about $98.52 billion more advertising revenue than Meta in 2025 on their reported accounting bases.
- Google Search and other advertising generated $224.53 billion in 2025, making it Google’s largest advertising segment by a wide margin. The segment generated $198.08 billion in 2024.
- YouTube advertising generated another $40.37 billion in 2025, up from $36.15 billion in 2024. Google Network revenue, by comparison, decreased from $30.36 billion to $29.79 billion.
- Meta’s advertising revenue increased by $35.54 billion in 2025 alone. The company attributed the increase to both higher ad impressions and higher average prices.
- Meta’s ad impressions increased 12% year over year during 2025, following 11% growth during 2024. Its average price per ad rose 9% in 2025 after increasing 10% in 2024.
- The online commerce vertical contributed more than any other vertical to Meta’s 2025 advertising revenue increase. That finding underlines the importance of retail and e-commerce advertisers to Facebook and Instagram’s advertising economics.
- The 2026 run rate strengthened further. Meta generated $114.39 billion in advertising revenue during the first half of 2026, compared with $87.96 billion during the first half of 2025, a 30% increase.
- Google’s Q1 2026 advertising revenue totaled $77.25 billion, versus $66.89 billion a year earlier. Within that total, Search and other generated $60.40 billion, YouTube ads generated $9.88 billion, and Google Network generated $6.97 billion.
Facebook Ads vs Google Ads Ad Spending
- U.S. digital advertising revenue reached approximately $294.6 billion in 2025, up 13.9% year over year. This expanding market gives both Google Ads and Facebook Ads access to larger advertiser budgets, even as competition from retail media and newer platforms grows.
- Social media advertising revenue in the U.S. reached $117.7 billion in 2025, up 32.6%, or about $29 billion, from the previous year. The increase strengthened the pool of spending available to Facebook and other social placements.
- Search advertising generated about $114.2 billion in U.S. revenue during 2025. Social advertising therefore edged ahead of search as an overall category, although Google remained the dominant individual search advertising platform.
- Programmatic advertising spending reached $162.4 billion in 2025, representing 20.5% year-over-year growth. Automated buying increasingly shapes how advertisers allocate budgets across digital channels, including display and social inventory.
- In the wider global advertising market, digital channels accounted for an estimated 73.2% of advertising revenue in 2025. Global advertising revenue was forecast at $1.08 trillion that year, indicating that close to three-quarters of advertiser spending had shifted to digital formats.
- The U.S. advertising market was projected to reach $404.7 billion in 2025, making it the world’s largest national advertising market. This scale helps explain why competition between Facebook Ads and Google Ads remains especially important for U.S. marketers.
- Meta was estimated to account for about 22% of U.S. digital advertising spending in 2025, compared with roughly 25% for Google. Together, the two companies continued to absorb a substantial share of American digital advertising budgets.
- The competitive gap is expected to narrow further in 2026. Meta’s U.S. advertising revenue is forecast to increase 14.2%, while Google’s is forecast to grow by 5.6%, indicating faster budget growth toward Meta’s advertising inventory.
- Globally, Meta is forecast to capture 26.8% of digital advertising spending in 2026, representing $243.46 billion in net advertising revenue. Google is projected at 26.4%, or $239.54 billion.
Facebook Ads vs Google Ads Average CPC and CPM
- Average Google search CPC reached $5.42 in 2026, compared to $5.26 in 2025.
- Meta’s cross-industry average CPC was $0.78 in 2026, reflecting an 11.4% increase from 2025.
- A Google search click cost 6.9 times more than a cross-industry Meta click in 2026.
- Facebook traffic campaigns averaged $0.70 per click in 2025, representing a 6.67% decline.
- Meta’s average CPM rose 20.1%, increasing from $11.82 in 2025 to $14.19 in 2026.
- Meta’s 2026 CPM averaged $8.14 for food and beverage, and $21.40 for insurance.
- Meta’s 2026 CPC was lowest at $0.45 for apparel and highest at $3.77 for finance.
- Google search 2026 CPC averaged $1.63 for arts and entertainment and $9.87 for legal services.
- Google search average CPC more than doubled from $2.32 in 2016 to $5.42 in 2026.
Facebook Ads vs Google Ads Average CTR
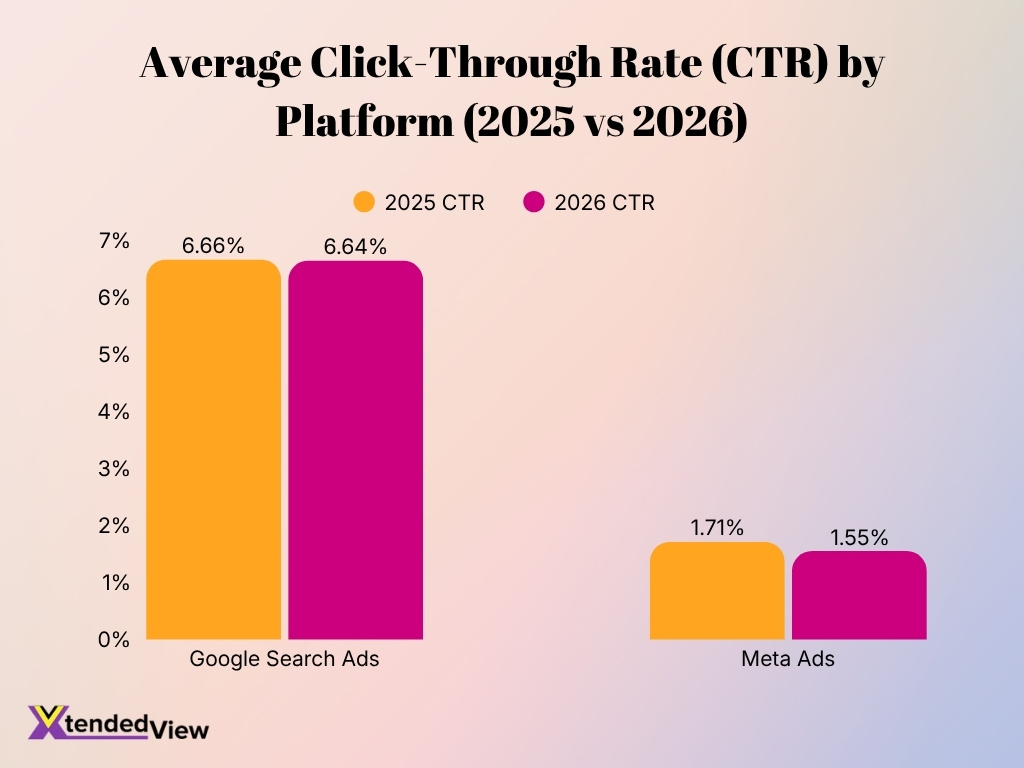
- Google Ads recorded an average search CTR of 6.64% in 2026, almost unchanged from 6.66% in 2025. The stability suggests that higher automation and changing search interfaces have not produced a broad collapse in paid-search engagement within the benchmark sample.
- Meta Ads recorded an average CTR of about 1.55% in 2026, down from 1.71% in 2025. That represents a 9.4% year-over-year decrease.
- At the cross-industry benchmark level, Google’s 2026 search CTR was therefore more than four times Meta’s average CTR. The difference reflects placement context: search ads appear after a user enters a query, while social ads often interrupt browsing and discovery behavior.
- Facebook traffic campaigns moved in the opposite direction during 2025. Their overall CTR increased 8.23% year over year, and 11 of 22 industries with comparable data recorded gains.
- Arts and entertainment generated Google’s highest listed search CTR in 2026 at 12.75%. Finance and insurance reached 9.83%, while travel was approximately 9.3%.
- Automotive repair, service, and parts recorded Google’s lowest listed 2026 CTR at 5.56%. Dental services followed at 5.66%, while health and fitness averaged 5.81%.
- Meta’s 2026 CTR also differed substantially by industry. Real estate reached 2.75%, while apparel reached 1.95%, both above the platform’s 1.55% cross-industry average.
- B2B technology produced a Meta CTR of only 0.78% in 2026, while education averaged 0.73%. Narrow professional audiences therefore generated lower click rates than several broad consumer categories.
- Google’s education and instruction CTR increased 31.71% year over year in 2026, while beauty and personal care increased 18.21% and finance and insurance increased 18.01%.
Facebook Ads vs Google Ads Conversion Rate
- Average Google search conversion rate increased to 8.18% in 2026, up from 7.52% in 2025. This means slightly more than eight conversions occurred for every 100 ad clicks in the benchmark dataset.
- Google’s 2025 conversion rate had already increased 6.84% year over year, showing that conversion efficiency improved before the further rise recorded in 2026.
- Meta’s average conversion rate reached approximately 8.20% in 2026, compared with 7.72% in 2025. That represents an improvement of 6.2%.
- Although the headline 2026 conversion rates of Google and Meta were almost identical at 8.18% and 8.20%, respectively, the underlying campaign objectives differ. Google benchmark data focuses heavily on search-generated leads, while Meta benchmarks include social conversion campaigns.
- Google’s animals and pets category produced the highest listed conversion rate in 2026 at 16.22%. Automotive repair, service and parts followed at 15.51%.
- Google’s education and instruction campaigns converted at 13.14% in 2026, compared with 11.38% in 2025. The category remained one of search advertising’s strongest lead-generation verticals.
- Finance and insurance produced Google’s lowest listed conversion rate in 2026 at 2.64%. Furniture converted at 2.99%, while career and employment averaged 3.05%.
- Beauty and personal care recorded Google’s largest year-over-year conversion-rate gain in 2026, rising 32.34%. Personal services increased 26.69%, while animals and pets improved 24.10%.
- Facebook lead campaigns showed more pressure during 2025: 12 of 15 industries, or 80%, experienced lower conversion rates year over year. The subsequent rise in Meta’s aggregate 2026 CVR suggests improvement after that weaker period.
Facebook Ads vs Google Ads Cost Per Lead and Customer Acquisition Cost
- Google search campaigns produced an average $66.69 cost per lead in 2026, down from $70.11 in 2025. It marked the first overall decline in the benchmark’s CPL metric in five years.
- Google’s 2025 CPL had risen 5.13% from $66.69 in 2024 to $70.11, meaning the 2026 decline effectively returned the aggregate benchmark to its 2024 level.
- Facebook lead campaigns averaged $27.66 per lead in 2025, following a 20.94% year-over-year increase. Even after that increase, the benchmark remained well below Google’s $70.11 search CPL for the same year.
- Meta’s broader 2026 acquisition benchmark increased to approximately $38.19 CPA, up 38.1% from the $27.66 2025 baseline used in the dataset. Rising CPMs contributed to the increase.
- E-commerce advertisers on Meta averaged approximately $29.99 CPA in 2026, while beauty averaged $25.49. These consumer categories remained considerably less expensive than several high-consideration service industries.
- Legal services produced a Meta acquisition cost of approximately $187.60 in 2026, while insurance reached $198.42 and healthcare reached $156.88. High-value and regulated industries therefore carried acquisition costs several times the platform average.
- Google’s legal-services CPL reached $131.63 in 2026, the highest listed search category. Furniture followed at $106.70, while real estate averaged $102.51.
- At the other end of the Google benchmark, arts and entertainment generated leads for an average $26.84 in 2026. Automotive repair averaged $29.96, and restaurants and food averaged $30.57.
- Several Google verticals became substantially more efficient in 2026. Travel CPL fell 39.35% year over year, beauty and personal care fell 34.95%, and physicians and surgeons declined 29.54%.
- Cost alone does not establish which platform acquires customers more efficiently. Facebook generally produces less expensive leads and clicks, while Google can capture users closer to a purchase decision; advertisers therefore need to compare qualified lead cost, sales conversion rate and customer lifetime value, not CPL in isolation.
Facebook Ads vs Google Ads Return on Ad Spend and ROI
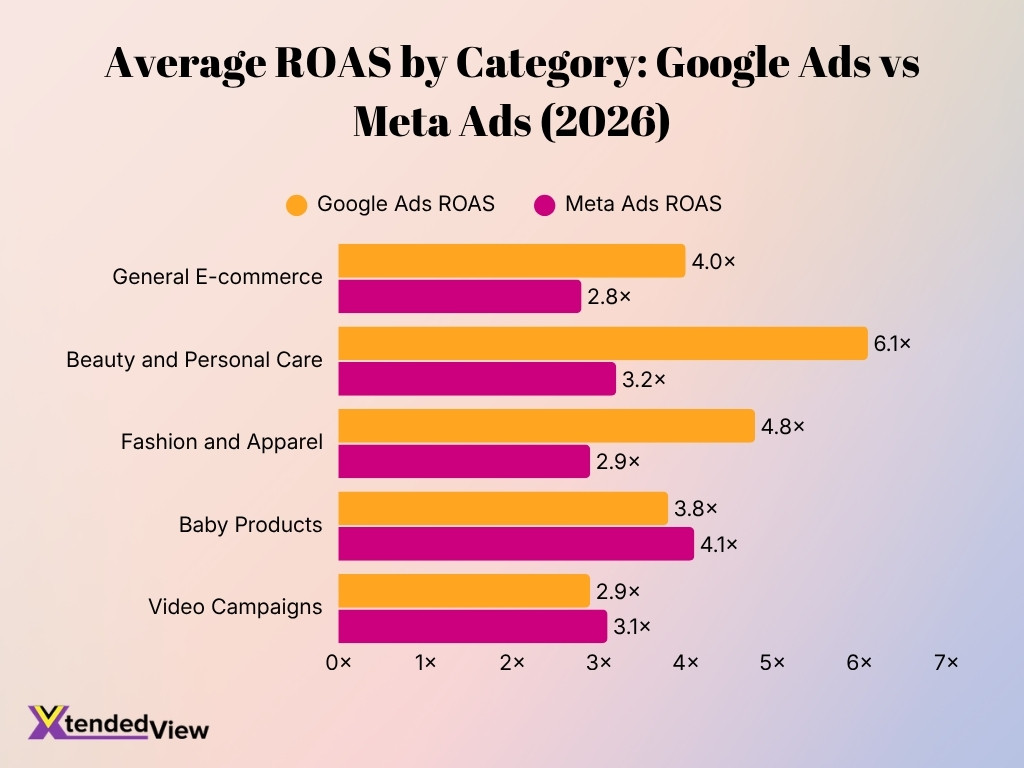
- A 2026 cross-platform benchmark covering more than 15,000 advertisers and $2.8 billion in combined spending placed general e-commerce ROAS at 4.0x for Google Ads and 2.8x for Meta Ads. That equates to about $4 and $2.80 in tracked revenue, respectively, for every $1 in ad spend.
- Beauty and personal care produced one of the widest 2026 differences, with a median 6.1x ROAS on Google Ads versus 3.2x on Meta Ads. Search intent gave Google an advantage for direct-response transactions in this benchmark.
- Fashion and apparel achieved approximately 4.8x on Google and 2.9x on Meta in 2026. The category can still benefit from Meta’s visual discovery model, but tracked direct-response revenue favored Google in the benchmark.
- Baby products were a notable exception. They generated 4.1x ROAS on Meta compared with 3.8x on Google, making Meta the stronger platform for that category in the dataset.
- Google Shopping campaigns averaged approximately 5.8x ROAS in 2026, while Google search campaigns reached 6.2x. These campaign types benefit from strong commercial or purchase intent.
- Retargeting produced the highest listed return for both ecosystems. Google retargeting averaged about 7.1x ROAS, while Meta retargeting reached 8.4x, showing why warm audiences remain economically important even when prospecting costs rise.
- Prospecting campaigns delivered lower immediate returns. Google prospecting averaged 3.4x ROAS, compared with 2.1x for Meta prospecting in 2026. Cold-audience advertising generally requires more interactions before conversion.
- Video advertising narrowed the gap and reversed the broader pattern. Meta video campaigns averaged 3.1x ROAS, slightly above Google’s 2.9x benchmark. This result aligns with Meta’s strength in feed-based visual discovery and social video.
- Cross-platform advertisers achieved an estimated 25% to 40% higher blended ROAS than campaigns relying on a single platform in the 2026 dataset. The typical strategy used Meta for discovery and nurturing while Google captured lower-funnel demand.
- ROAS should not be treated as profit. A business operating at a 40% gross margin has a theoretical break-even ROAS of 2.5x before overhead and other costs, so the same platform ROAS can produce very different business outcomes depending on margins and customer lifetime value.
Facebook Ads vs Google Ads E-commerce, B2B, and B2C Performance
- E-commerce advertisers remain especially important to Meta. Brands in one large 2025 commerce dataset allocated 68.31% of their measured advertising budgets to Meta, showing how strongly direct-to-consumer businesses continue to rely on Facebook and Instagram placements.
- Meta’s 2025 commerce benchmark recorded an average 1.86 ROAS, up from 1.84 in 2024. Average order value increased from $69.84 to $71.69, while conversion rate improved from 1.48% to 1.60%.
- Meta e-commerce CPM increased substantially during the same period, rising 20.03% from $11.82 in 2024 to $14.19 in 2025. Advertisers therefore needed stronger creative, conversion rates, or order values to offset higher impression costs.
- Despite higher CPM, Meta e-commerce CTR improved 13.5% year over year, from 1.93% to 2.19%. This indicates that shoppers clicked ads more frequently even as brands paid more to reach them.
- Meta e-commerce CPA remained comparatively stable, increasing only 1.04% from $37.80 to $38.19 between 2024 and 2025. The limited CPA increase contrasts with the much larger 20% rise in CPM.
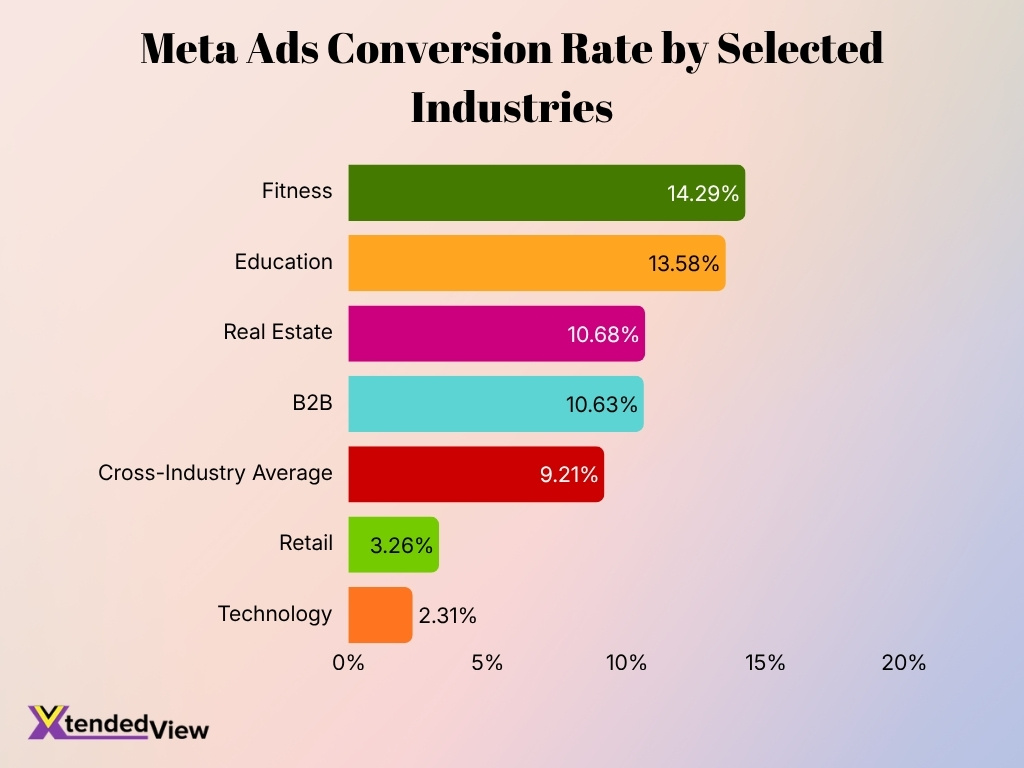
- B2B performance can favor Facebook when lead-generation formats match the offer. Historical cross-industry benchmark data records a 10.63% Facebook conversion rate for B2B, compared with 3.26% for retail and 2.31% for technology campaigns.
- However, Facebook B2B clicks can cost more than clicks in broad consumer categories. Average B2B CPC reached $2.52, compared with $0.45 for apparel and $0.70 for retail in the industry benchmark.
- Google remains particularly relevant for B2B companies because Search can capture buyers researching a defined problem or vendor. Business-services campaigns recorded a 6.10% Google search CTR and $5.87 CPC in 2026, while average CPL reached $93.69.
- For B2C advertisers, category matters more than the broad label. Google’s apparel and fashion CTR averaged 6.64% in 2026, while Facebook apparel historically delivered a 1.24% CTR but a much lower $0.45 CPC. Search is more intent-driven, whereas social advertising gives consumer brands lower-cost discovery opportunities.
- The practical e-commerce strategy increasingly combines channels rather than choosing one. Meta can introduce products and build demand, while Google Search, Shopping and automated campaigns can capture users once they begin actively comparing products and prices.
Facebook Ads vs Google Ads Audience Targeting and Retargeting Performance
- Google’s optimized targeting generated an average 25% improvement in campaign objectives.
- Supplying first-party audiences in Google campaigns boosted the performance uplift to 54%.
- Utilizing Google’s enhanced automation delivered a 60% lower median CPA at the insertion-order level.
- Combining optimized targeting and enhanced automation yielded an additional 10% lower CPA.
- Meta’s Advantage+ Audience can achieve a 15% lower cost per result for awareness campaigns.
- Advantage+ sales campaigns recorded a 9% lower cost per action, while app campaigns improved by 7%.
- Implementing Meta’s opportunity-scoring system recommendations led to a 5% median decrease in cost per result.
- In 2025, Facebook was used by 71% of U.S. adults, comprising 78% of women and 63% of men.
- Facebook usage remained extremely consistent across U.S. income groups, ranging from 71% to 72%.
- Facebook achieved a uniform 71% reach across urban, suburban, and rural U.S. adults.
Facebook Ads vs Google Ads Performance by Industry
- Google Ads produced an average 6.64% search CTR, $5.42 CPC, 8.18% conversion rate and $66.69 CPL across more than 13,000 U.S.-based campaigns analyzed for the 2026 benchmark. These figures provide a useful baseline before comparing individual industries.
- Arts and entertainment recorded Google’s highest listed search CTR at 12.75% in 2026, while its average CPC was only $1.63 and CPL was $26.84. That combination made the category one of the more cost-efficient industries for generating search traffic and leads.
- Attorneys and legal services faced much higher Google Ads costs. Average CPC reached $9.87, while average CPL climbed to $131.63, the highest CPL among the listed 2026 industries.
- Finance and insurance generated a strong 9.83% Google Ads CTR in 2026, even though paid-search performance varied substantially farther down the funnel. The category’s CPC averaged $3.39.
- Education and instruction reached a 7.56% Google search CTR in 2026, while its CTR improved 31.71% year over year. It posted the largest annual CTR increase among the industries included in the benchmark.
- Facebook performance also changes sharply by vertical. An industry dataset places Facebook’s average CTR at 0.90%, with retail at 1.59%, apparel at 1.24%, B2B at 0.78%, and employment and job training at 0.47%.
- Facebook conversion rates show a different industry hierarchy. Fitness reached 14.29%, education 13.58%, B2B 10.63%, real estate 10.68% and healthcare 11%, compared with a 9.21% cross-industry average in the dataset.
- Retail and technology illustrate why marketers should avoid judging Facebook Ads solely by lead-generation averages. Retail converted at 3.26% and technology at 2.31% in the cited industry dataset, well below categories such as fitness, education and B2B.
- Industry economics can therefore reverse the apparent Facebook-versus-Google advantage. Google often commands higher CPCs because searchers express immediate intent, while Facebook can deliver cheaper reach and clicks in visual consumer categories. Actual profitability depends on conversion quality, average order value and lifetime customer revenue rather than one platform-wide benchmark.
Facebook Ads vs Google Ads Ad Formats and Mobile Advertising
- U.S. social media advertising revenue reached $117.7 billion in 2025, up 32.6%, or $29 billion, year over year. Growth reflected deeper commerce integration, creator advertising and continued improvements in targeting and measurement.
- Programmatic advertising revenue increased 20.5% to $162.4 billion in 2025, adding $27.6 billion in a year. Automated delivery increasingly determines where display, video, and other digital ads appear across devices.
- Facebook remains one of the largest mobile-oriented consumer environments in the U.S. In 2025, 71% of U.S. adults used Facebook, while YouTube reached 84%, giving both advertising ecosystems substantial mobile and cross-device reach.
- Meta’s available formats span Feed, Stories, Reels, video, carousel, and other placements, while Google Ads can distribute creative across Search, Shopping, Display, Maps, Gmail, Discover, and YouTube. This difference allows Facebook to emphasize visual discovery while Google combines search intent with visual and video inventory.
- Short-form video has become especially important to Google’s advertising mix. Creator Ads running on YouTube Shorts increased purchase intent by an average of 8.8% and generated 2.9 times more consumer intent to spend versus competing environments in cited measurement.
- In 2026, YouTube Shorts ads that generated more than 10 seconds of viewing plus a like produced 15% higher brand consideration and 20% higher favorability on average. These interaction signals give video advertisers additional performance metrics beyond clicks.
- Creator partnerships on YouTube Shorts generated an average 30% increase in conversion lift for Demand Gen campaigns while maintaining CPA efficiency in global data collected from January 2025 through January 2026.
- Meta’s ad format economics also show the importance of visual engagement. E-commerce CTR increased 13.5% to 2.19% in 2025, even as CPM rose 20%, suggesting that improved creative engagement partially offset increasingly expensive inventory.
- The mobile opportunity extends beyond the U.S. In India, YouTube Shorts surpassed 650 million monthly logged-in viewers in 2025, illustrating the scale that vertical video formats can provide advertisers in high-growth international markets.
- For advertisers, the format decision therefore depends on the customer journey. Search text ads work well for explicit needs, Shopping ads surface products, while Reels, Stories, Shorts, and other vertical-video placements help brands create demand before customers begin searching.
Facebook Ads vs Google Ads Privacy, Tracking, and Attribution
- A 2025 analysis of 40,150 websites discovered Google trackers on 72.6% of the sites.
- The same study identified Meta trackers installed on just 28.2% of the measured websites.
- A 2026 assessment of 4,482 Android apps found that only 12.85% implemented a consent framework.
- About 66.2% of analyzed apps transmitted Android Advertising IDs without a documented lawful basis.
- Over 55.3% of tested applications transmitted tracking IDs before users interacted with consent banners.
- U.S. social advertising revenue experienced a substantial 32.6% growth throughout 2025.
- In the app study, 2.6% of applications stored user choices strictly when consent was granted.
- Meta trackers were configured to collect form data at 62.3% compared to just 11.6% for Google.
Facebook Ads vs Google Ads Artificial Intelligence Features
- Google AI Max for Search initially drove an average 14% increase in conversions at a similar CPA.
- Keyword-based search campaigns achieved an average 27% uplift using AI-powered matching.
- Deploying Google’s full AI Max suite generates 7% more conversions compared to basic matching alone.
- Meta’s AI ranking models delivered a 3.5% lift in ad clicks across Facebook in Q4 2025.
- The same Meta AI improvements generated over a 1% increase in conversions on Instagram.
- Adoption of Meta AI advertising tools surged by more than 70% year-over-year.
- An AI ad-text model tested across 35,000 advertisers and 640,000 ad variations increased CTR by 6.7%.
- Google optimized targeting boosted campaign objectives by 54% using first-party audiences.
- Enhanced Google ad automation produced a 60% lower median CPA across display and video channels.
Frequently Asked Questions (FAQs)
Google Search Ads average $5.42 per click in 2026, while Facebook traffic campaigns averaged about $0.70 per click in 2025, making Facebook clicks substantially cheaper on this benchmark.
The average Google Ads search CTR is 6.64% in 2026 across the latest benchmark dataset.
Meta is forecast to generate $243.46 billion in worldwide net digital ad revenue in 2026, compared with $239.54 billion for Google.
Meta’s U.S. advertising revenue is forecast to grow 14.2% in 2026, compared with 5.6% for Google.
Facebook traffic campaigns averaged $0.70 CPC in 2025, down 6.67% year over year, with CPC declining in 10 of 21 measured industries.
Conclusion
Facebook Ads and Google Ads remain central to digital advertising, but their strengths differ. Meta is projected to reach $243.46 billion in global net digital ad revenue, while Google is forecast at $239.54 billion, and Meta’s projected 24.1% growth rate is more than twice Google’s 11.9%.
Google continues to lead when advertisers need to capture explicit search intent, while Facebook remains strong for product discovery, visual advertising, audience building and e-commerce. Industry differences in CPC, CTR, conversion rates and acquisition costs mean neither platform offers a universal advantage.
AI, first-party data and privacy-aware measurement now shape performance across both ecosystems. For many advertisers, the strongest strategy is Facebook Ads and Google Ads rather than Facebook Ads or Google Ads, using social advertising to create and nurture demand and search advertising to capture high-intent customers.