



Google Ads remains one of the most influential digital advertising platforms for businesses that want to reach customers at the exact moment they search, browse, shop, or watch videos online. From local service providers generating qualified leads to ecommerce brands scaling holiday sales, Google Ads plays a central role in modern marketing strategies.
As AI-powered campaign automation, Performance Max, and Smart Bidding continue to evolve, advertisers are also adapting how they allocate budgets and measure returns. This article explores the latest Google Ads statistics, including market share, revenue, adoption trends, and performance benchmarks to help you understand where the platform stands today.
Editor’s Choice
- Google generated approximately $307 billion in advertising revenue during 2025, representing an increase from the previous year and reinforcing advertising as Alphabet’s largest revenue source.
- Google Search continues to account for the largest portion of Google’s advertising business, contributing nearly $197 billion in 2025.
- Google remains the world’s largest search advertising platform, with an estimated 91% share of the global search engine market entering 2026.
- Google processes approximately 8.5 billion searches every day, creating enormous advertising inventory for paid search campaigns.
- Advertisers using Performance Max alongside existing Search campaigns record an average 27% increase in conversions or conversion value at similar CPA or ROAS.
- Google reported that Smart Bidding Exploration can increase conversions by 19% while expanding advertisers into 18% more unique search query categories.
- Automated bidding continues to dominate campaign management, with industry estimates showing more than 85% of Google Ads campaigns now relying on AI-powered bidding strategies.
Recent Developments
- Throughout 2025, Google introduced expanded AI-powered advertising capabilities, including AI Max for Search, designed to improve creative generation and targeting.
- Google expanded channel-level reporting for Performance Max campaigns, giving advertisers visibility across Search, YouTube, Display, Discover, Gmail, and Maps.
- Full Search terms reporting became available for Performance Max campaigns, improving transparency for advertisers.
- AI-powered Smart Bidding Exploration launched to help advertisers discover additional converting search queries while maintaining ROAS objectives.
- Google expanded AI Mode ad testing in the United States, allowing sponsored ads to appear within AI-generated search experiences where appropriate.
- Performance Max gained additional reporting features, including ROI columns, segmentation, downloadable reports, and cost analysis.
- Google introduced enhanced Search Partner Network reporting, giving advertisers greater placement visibility and improved optimization controls.
- AI-powered creative customization expanded across additional languages and campaign types during 2025.
Overview of Google Ads Market Share
- Google continues to command roughly 91% of the worldwide search engine market, making it the dominant platform for search advertising.
- Industry estimates indicate Google captures well over half of global search advertising spending, ahead of all competing search platforms combined.
- Google remains the default search engine across billions of Android devices, strengthening advertiser reach worldwide.
- More than 8.5 billion searches occur daily on Google, providing advertisers with massive commercial search intent.
- Paid search remains one of Google’s highest-performing advertising products because users often search with clear purchase intent.
- In the United States, Google continues to lead the search market despite increased competition from AI-powered search experiences and retail media networks.
- Industry forecasts suggest Google will remain among the two largest digital advertising companies globally throughout 2026 despite faster growth from competitors.
- Google’s advertising ecosystem spans Search, YouTube, Display, Discover, Gmail, Maps, Shopping, and partner properties, giving advertisers access to multiple customer touchpoints.
Google Ads Revenue Growth Over the Years
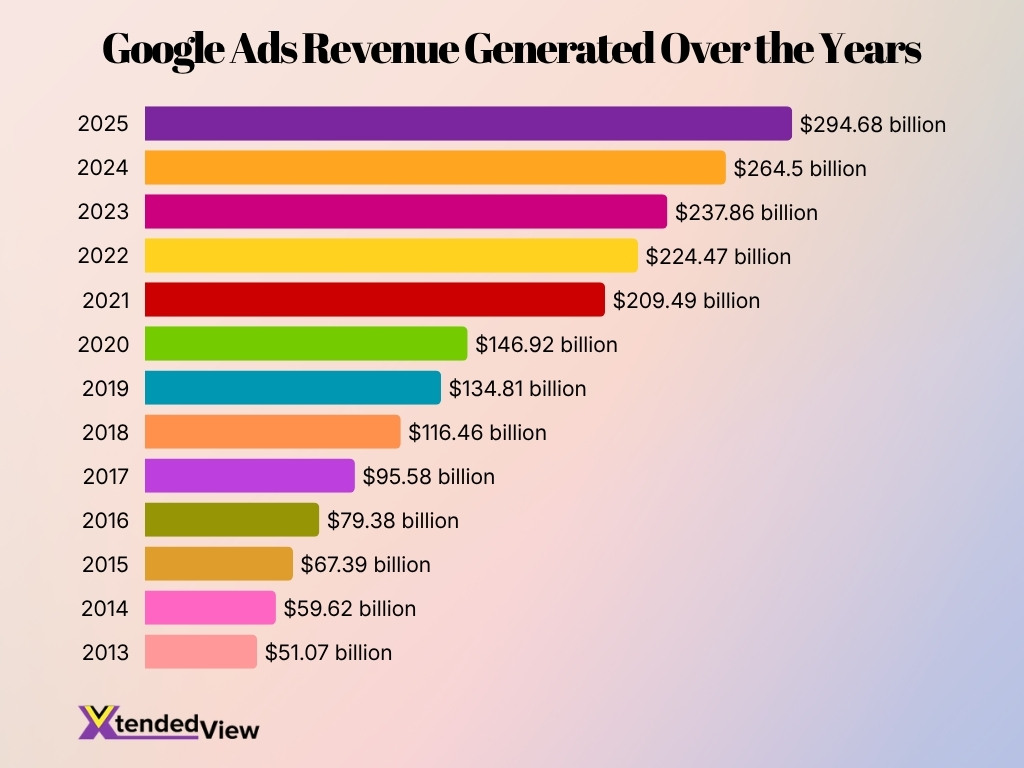
- Google Ads revenue reached $294.68 billion in 2025, the highest figure in the dataset.
- Revenue increased from $51.07 billion in 2013 to $294.68 billion in 2025, showing massive long-term growth.
- Google Ads revenue grew by about 477% between 2013 and 2025.
- The platform added around $243.61 billion in annual ad revenue over the 12-year period.
- The biggest yearly jump came in 2021, when revenue rose from $146.92 billion to $209.49 billion.
- Google Ads crossed the $100 billion revenue mark in 2018, reaching $116.46 billion.
- Revenue crossed the $200 billion mark in 2021, showing strong post-2020 advertising demand.
- From 2021 to 2025, Google Ads revenue increased from $209.49 billion to $294.68 billion.
- In 2025, Google Ads generated about $30.18 billion more revenue than in 2024.
- The data shows consistent year-over-year growth, with Google Ads remaining a major driver of Alphabet’s advertising business.
Google Ads Share in Global Digital Advertising
- Google is projected to control approximately 26.4% of all worldwide digital ad spending in 2026.
- Meta, Google, and Amazon collectively account for 62.3% of global digital ad spending in 2026.
- Google Ads generated a massive $294.69 billion in total advertising revenue during FY2025.
- Projections indicate Google’s ad revenue will climb to $318 billion by the end of 2026.
- Google currently holds a dominant 89.85% of the global search engine market share.
- The Google Display Network successfully reaches over 90% of global internet users across properties.
- YouTube advertising revenue alone contributed an impressive $40.37 billion in FY2025.
- Mobile devices currently drive roughly 62% of all Google Ads clicks across industries.
Google Ads Usage by Businesses and Marketers
- Google Ads generates over $280 billion in annual revenue, making it the largest digital advertising platform globally.
- More than 80% of global businesses use some form of PPC advertising as part of their daily marketing strategy.
- Performance Max campaigns now account for 42% of all Google Ads spend due to massive adoption of AI-driven optimization.
- Over 7 million businesses and agencies rely on Google Ads as their primary online advertising source.
- Google Ads holds an impressive 80.2% market share of the global pay-per-click advertising industry.
- The platform successfully reaches 4.77 billion internet users worldwide, giving advertisers an unmatched global audience.
- Responsive Search Ads currently achieve 8–12% higher click-through rates compared to legacy text ad formats.
- Campaigns utilizing AI-powered creative suggestions see a 14% higher conversion rate than manually written ad campaigns.
Google Ads Benchmarks by Industry
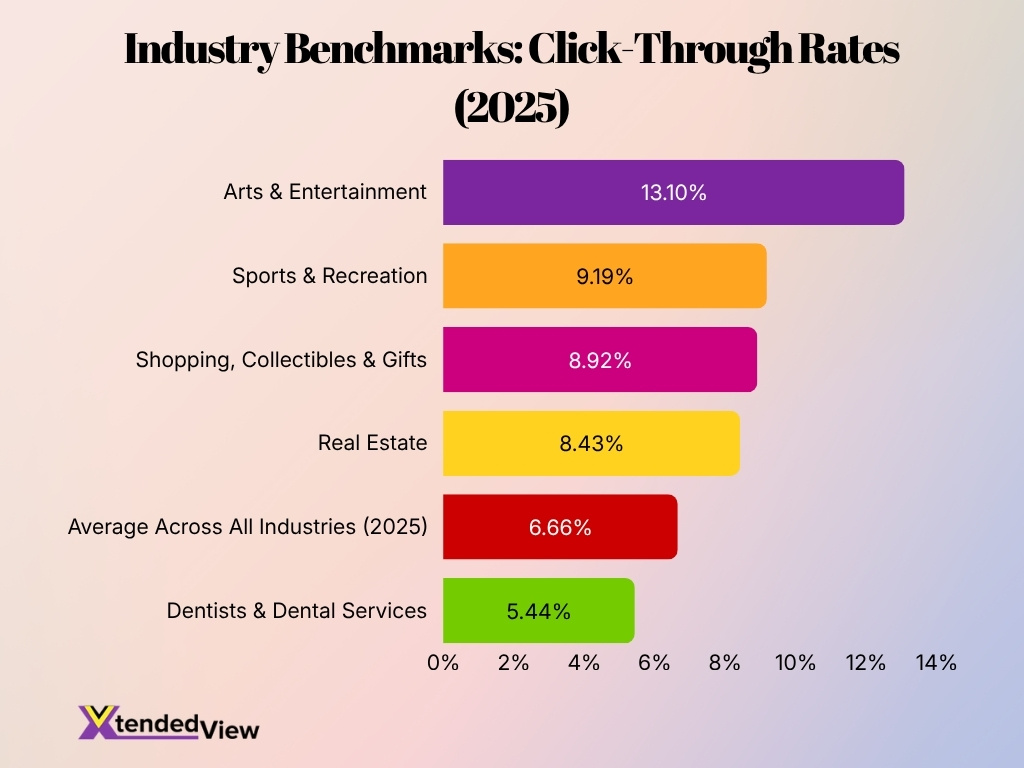
- Arts & Entertainment recorded one of the highest average click-through rates at 13.10% during 2025.
- Automotive Repair, Service & Parts achieved the highest average conversion rate at 14.67%.
- Animals & Pets followed with an average conversion rate of 13.07%.
- Physicians & Surgeons averaged a conversion rate of 11.62%, reflecting strong lead generation demand.
- Education & Instruction maintained an average conversion rate of 11.38% while recording an average CPC of $6.23.
- Attorneys & Legal Services reported one of the highest average CPCs at $8.58, driven by intense keyword competition.
- Home & Home Improvement averaged $7.85 per click, ranking among the most competitive industries.
- Finance & Insurance posted one of the lowest average conversion rates at 2.55%, indicating longer buying cycles and higher customer acquisition complexity.
Google Ads Budget Allocation and Spend Levels
- Average cost per click (CPC) rates rose across 87% of industries year over year.
- The average cost per lead (CPL) increased by only 5%, indicating improved campaign efficiency.
- Over 60% of advertisers now distribute budgets across Search, Performance Max, YouTube, Display, and Shopping.
- Ecommerce businesses typically increase Google Ads spending by 25% to 40% during Q4 holiday shopping.
- Local service businesses allocate up to 80% of paid media budgets to high-intent Search campaigns.
- More than 70% of advertisers use automated budget allocation tools to maximize highest conversion values.
- Adoption of value-based bidding increased by 35% as businesses optimize for revenue and profitability.
- Over 85% of budget planning actively incorporates seasonal demand forecasts and AI recommendations.
- The average small-to-medium business allocates $9,000 to $10,000 per month on Google Ads spending.
- Advertisers typically see an average return of $8 in revenue for every $1 spent on the platform.
Google Ads Performance by Network (Search, Display, YouTube, Discover)
- Google Search Ads maintain an average click-through rate of 3% to 5% across most commercial sectors.
- The average conversion rate for Search campaigns typically fluctuates between 3% and 5% depending on the industry.
- Performance Max campaigns generate an average 13% increase in total incremental conversions for active advertisers.
- Google Display Network campaigns generally see a lower average click-through rate of roughly 0.05% to 0.1%.
- YouTube advertising campaigns provide a median incremental return on ad spend of approximately 2.70x for brands.
- Roughly 86% of all campaigns on the Google Ads platform now utilize automated bidding strategies for optimization.
- Search Brand campaigns deliver a median incremental return on ad spend of about 4.14x for most businesses.
- Integrating Performance Max with Search advertising can drive 15% to 20% more incremental conversions for advertisers.
- Display Network advertising typically features an average cost-per-click ranging from $0.50 to $1.00.
- Advertisers adopting automated bidding often see an average conversion uplift between 12% and 20%.
Average Cost Per Click in Google Ads
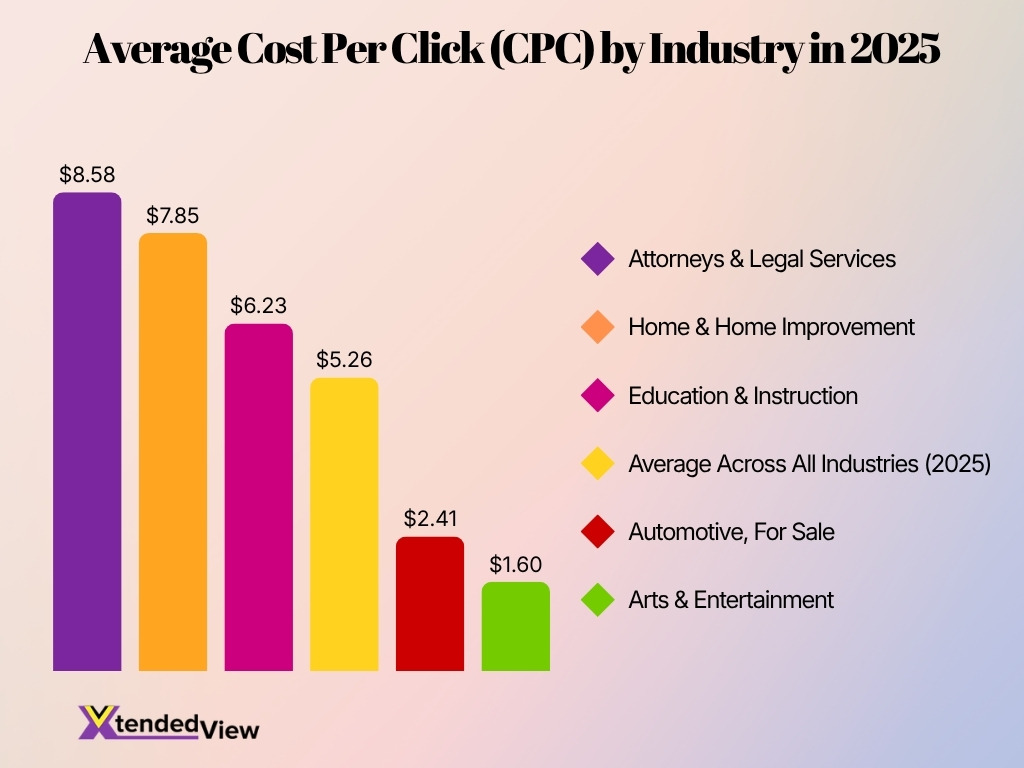
- The average Google Ads cost per click reached $5.26 in 2025, up from $4.66 in 2024.
- 87% of industries experienced year-over-year CPC increases, continuing a multiyear trend of rising competition.
- Attorneys and Legal Services recorded one of the highest average CPCs at $8.58.
- Home & Home Improvement averaged $7.85 per click, matching Dentists & Dental Services among the higher-cost industries.
- Education & Instruction reported an average CPC of $6.23, reflecting increased advertiser competition.
- Arts & Entertainment recorded one of the lowest average CPCs at $1.60, making it one of the least expensive categories for paid search.
- Automotive, For Sale maintained a comparatively low average CPC of $2.41.
- Rising CPCs have encouraged advertisers to improve Quality Score, landing page relevance, and conversion optimization instead of simply increasing bids.
Google Ads Click-Through Rate Benchmarks
- The average Google Ads click-through rate (CTR) reached 6.66% in 2025, compared with 6.42% in 2024.
- Overall CTR increased 3.74% year over year, although performance varied significantly by industry.
- Arts & Entertainment recorded the highest average CTR at 13.10%.
- Sports & Recreation achieved an average CTR of 9.19%, placing it among the strongest-performing industries.
- Shopping, Collectibles & Gifts averaged 8.92%, reflecting strong commercial search intent.
- Real Estate averaged a healthy 8.43% CTR across search campaigns.
- Dentists & Dental Services reported one of the lowest average CTRs at 5.44%.
- Improved ad assets, AI-generated creatives, stronger keyword targeting, and richer search results continue to support higher click-through rates across many industries.
Google Ads Conversion Rate Benchmarks
- The average Google Ads conversion rate increased to 7.52% in 2025, up from 6.96% in 2024.
- Overall conversion rates improved 6.84% year over year, despite higher advertising costs.
- Automotive, Repair, Service & Parts achieved the highest average conversion rate at 14.67%.
- Animals & Pets followed with an average conversion rate of 13.07%.
- Physicians & Surgeons averaged 11.62%, ranking among the strongest-performing verticals.
- Education & Instruction achieved an average conversion rate of 11.38%.
- Finance & Insurance recorded one of the lowest average conversion rates at 2.55%, while Furniture averaged 2.73%.
- 65% of industries improved conversion rates during 2025, suggesting advertisers successfully adapted campaigns despite rising CPCs and increased competition.
Google Ads Return on Ad Spend (ROAS) Statistics
- The median ROAS across all Google Ads campaigns currently sits around 3.5x to 4x.
- Businesses typically generate an average 8:1 return on investment from Google Search advertising overall.
- Performance Max campaigns deliver an average 27% increase in conversion value while maintaining a similar ROAS.
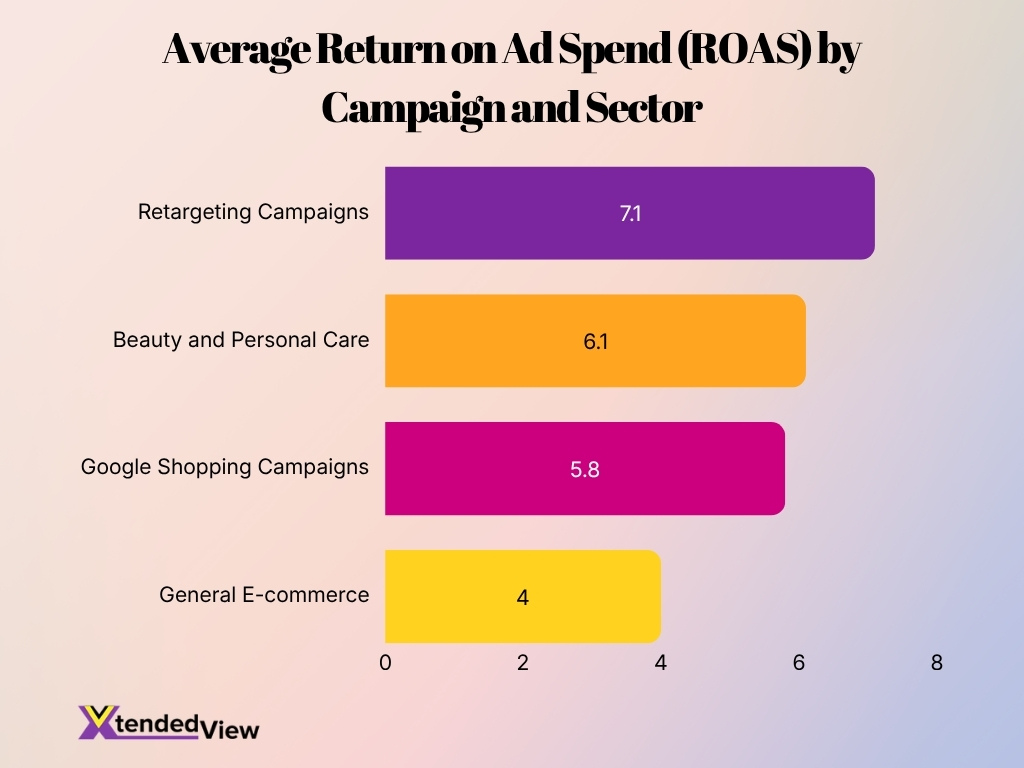
- Advertisers running Google Shopping campaigns achieve a high average ROAS of 5.8x due to strong commercial intent.
- The Beauty and Personal Care industry reports a median Google Ads ROAS of 6.1x, ranking among the highest performers.
- Retargeting campaigns on Google frequently yield a ROAS of 7.1x by effectively converting previous website visitors.
- The average click-through rate (CTR) across Google Ads is 6.42%, which directly influences the efficiency of ad spend.
- General e-commerce businesses operate with a median Google Ads ROAS of 4.0x across standard search campaigns.
- A target ROAS of 5.0x or higher is generally necessary for businesses operating with low profit margins to break even.
- Campaigns must generate at least 15 conversions in the past 30 days to successfully utilize Target ROAS Smart Bidding.
Performance Max (PMax) Campaign Statistics
- Advertisers adding Performance Max achieve an average 27% increase in conversions or conversion value.
- Integrating Performance Max with offline conversion tracking can lower the cost per trial by 51%.
- Businesses utilizing Performance Max can reliably increase their overall lead volume by 8%.
- Compared to traditional Smart Shopping, Performance Max campaigns achieve 227% higher revenue.
- Recent automated quality improvements have independently increased conversions and conversion value by 10%.
- More than 1 million advertisers worldwide have actively adopted Performance Max for their marketing.
- Automated Target CPA and Target ROAS strategies outperform manual bidding by 20-35%.
- E-commerce campaigns using Performance Max consistently average a 400-600% Return on Ad Spend (ROAS).
Google Ads Use of AI and Machine Learning Features
- AI predictive audiences analyze over 70,000 behavioral signals in real-time to determine targeting precision.
- Machine learning models can deliver 300-500% better performance than traditional manual audience targeting.
- Google’s predictive audience models forecast user conversion probability with an estimated 85-92% accuracy.
- Utilizing cross-device behavioral intelligence increases targeting precision by 40-60% across campaigns.
- Advertisers upgrading to AI Max typically see 14% more conversions while maintaining a similar cost per acquisition.
- Campaigns transitioning from exact match keywords to AI-driven automation can experience up to a 27% increase in conversions.
- Implementing enhanced conversions alongside AI modeling improves audience accuracy by 15-25%.
- Combining responsive search ads with Smart Bidding and broad match yields 20% higher conversions.
- Independent analyses of retail campaigns show a median revenue uplift of 13% when using advanced machine learning features.
How Demographic Targeting Improves Google Ads Performance
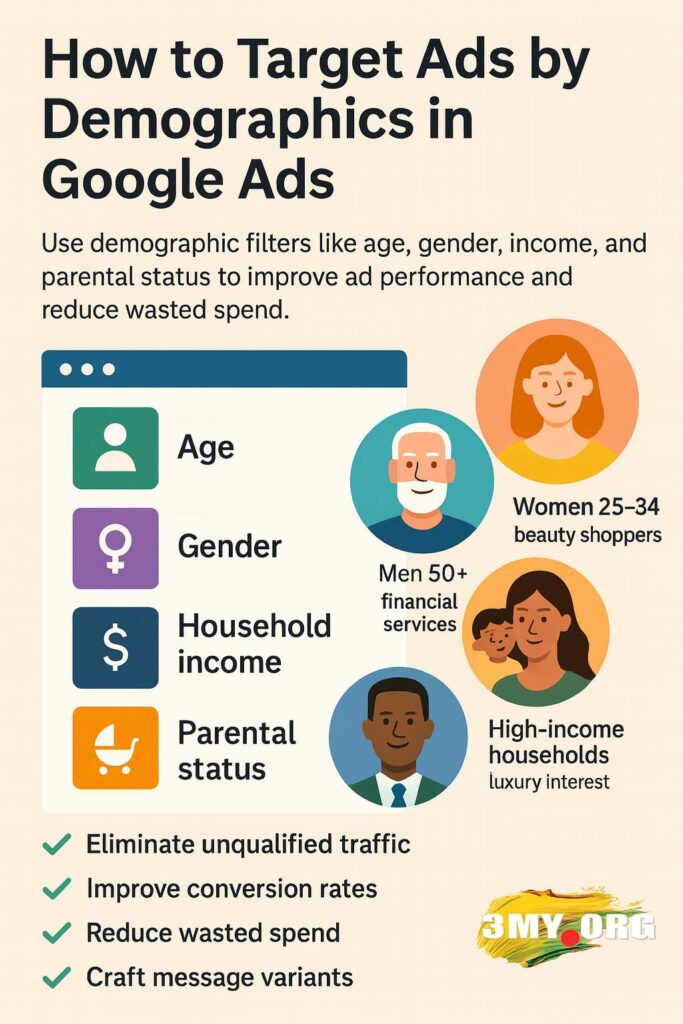
- Google Ads demographic targeting helps advertisers filter audiences by age, gender, household income, and parental status.
- Using demographic filters can help brands reach more relevant users and reduce wasted ad spend.
- The image highlights Age as a key targeting option for tailoring campaigns to different life stages and buying needs.
- Gender targeting can help advertisers create more relevant messages for audience groups such as women 25–34.
- Household income targeting is useful for campaigns focused on premium products, luxury services, or high-value customers.
- Parental status targeting can help brands reach families, parents, and household decision-makers more effectively.
- Example audience segments include women 25–34 beauty shoppers, men 50+ financial services, and high-income households.
- Demographic targeting can help eliminate unqualified traffic before it consumes the campaign budget.
- Better audience filtering can improve conversion rates by showing ads to users more likely to take action.
- Advertisers can use demographic insights to craft different message variants for each audience segment.
Google Ads Performance Trends Over Time
- Google’s advertising revenue has increased steadily over the past decade, reaching approximately $307 billion during 2025.
- Average Google Ads cost per click increased from $4.66 in 2024 to $5.26 in 2025, reflecting stronger advertiser competition.
- Average click-through rate improved from 6.42% in 2024 to 6.66% in 2025, showing continued gains in ad relevance.
- Average conversion rate increased from 6.96% to 7.52% over the same period despite rising advertising costs.
- More advertisers have shifted from manual bidding toward AI-powered Smart Bidding strategies over the past several years.
- Performance Max has rapidly evolved into one of Google’s fastest-growing campaign types since its full rollout.
- Privacy-focused advertising changes have accelerated adoption of first-party data strategies, enhanced conversions, and consent-based measurement.
- Industry analysts expect AI-powered optimization, automation, and predictive bidding to remain the primary drivers of Google Ads performance improvements throughout 2026.
Frequently Asked Questions (FAQs)
Google generated approximately $307 billion in advertising revenue during 2025.
The latest benchmark reports an average Search Ads CPC of about $2.10 globally.
The average Google Search Ads CTR is approximately 3.8% based on 2026 benchmark data.
The average Google Search Ads conversion rate is around 4.2% according to recent industry benchmarks.
Businesses earn an average of $8 in revenue for every $1 spent on Google Ads when campaigns are well optimized.
Conclusion
Google Ads continues to dominate the search advertising landscape, supported by strong revenue growth, widespread business adoption, and increasingly sophisticated AI-powered campaign optimization. Although advertising costs continue to rise, improvements in click-through rates, conversion rates, Smart Bidding, and Performance Max have helped many advertisers maintain or improve overall returns.
For businesses targeting customers in the United States and global markets, Google Ads remains one of the most measurable and scalable digital marketing platforms. As AI capabilities continue to expand and privacy standards evolve, advertisers that combine high-quality first-party data, value-based bidding, and continuous campaign optimization will be best positioned to maximize long-term advertising performance.
