Amazon Echo and Google Nest remain two of the most established smart-speaker ecosystems. Consumers use them for smart-home control, music, household routines, and AI assistance, while Alexa+ and Gemini for Home are making these devices more conversational. In February 2026, 35% of U.S. adults owned a smart speaker, while Amazon’s Echo represented about two-thirds of the U.S. installed smart-speaker market. Amazon also reports more than 600 million Alexa devices/endpoints, while Google’s wider Home ecosystem reaches hundreds of millions of connected devices.
Editor’s Choice
- Amazon Echo accounted for about two-thirds of the U.S. smart-speaker installed market in June 2026, maintaining a substantial lead even after its share slipped slightly from its previous peak.
- 35% of U.S. adults owned a smart speaker in February 2026, compared with 18% owning an AI-enabled smart doorbell, 13% an AI-enabled robot vacuum and 11% an AI-enabled smart thermostat.
- In 2025 purchase data, Amazon captured 60% of recently purchased or received U.S. smart speakers, while Google captured 18%.
- 51% of U.S. internet households reported owning a smart speaker and/or smart display in the 2025 household research associated with those purchase figures.
- Amazon’s Alexa footprint exceeds 600 million devices/endpoints, while the company says Alexa+ is designed to work across this established hardware base.
- Google’s Home APIs ecosystem expanded from access to more than 600 million devices in 2024 to more than 750 million in 2025, a gain of at least 150 million accessible devices.
- Amazon reported that Alexa+ customers were talking to Alexa twice as much, completing three times as many purchases on devices, streaming 25% more music and using smart-home features 50% more.
- The new Google Home Speaker launched in June 2026 at $99.99, putting Google’s Gemini-focused speaker directly into the mainstream $100 smart-speaker price segment.
Recent Developments
- Amazon introduced Alexa+ in February 2025 at $19.99 per month, while making the service available to Prime members without an additional Alexa+ subscription charge.
- Alexa+ initially targeted Echo Show 8, 10, 15, and 21 households during its early U.S. rollout, giving Amazon a screen-first route for deploying its new generative AI experience.
- The Alexa+ rollout exceeded 100,000 users by May 2025 and passed 1 million users by June 2025, demonstrating rapid early expansion from a controlled launch.
- By 2026, Amazon said 97% of Alexa devices it had shipped could support Alexa+, allowing the company to upgrade much of its installed hardware base without requiring every household to buy a new device.
- Google began rolling out Gemini for Home in 2025, replacing Google Assistant on compatible speakers and displays with a more conversational AI system.
- Google introduced Google Home Premium in 2025 at $10 per month for Standard and $20 per month for Advanced, adding paid Gemini Live, automation, and camera-intelligence features.
- Google released its Gemini-focused Google Home Speaker in June 2026 for $99.99. The device includes a 58 mm full-range driver, three far-field microphones, 1 GB of memory and 4 GB of storage.
- Google also bundled six months of Google Home Premium Standard, a stated $60 value, with qualifying Google Home Speaker purchases through Sept. 30, 2026.
Smart Speaker Brand Share by Voice Assistant
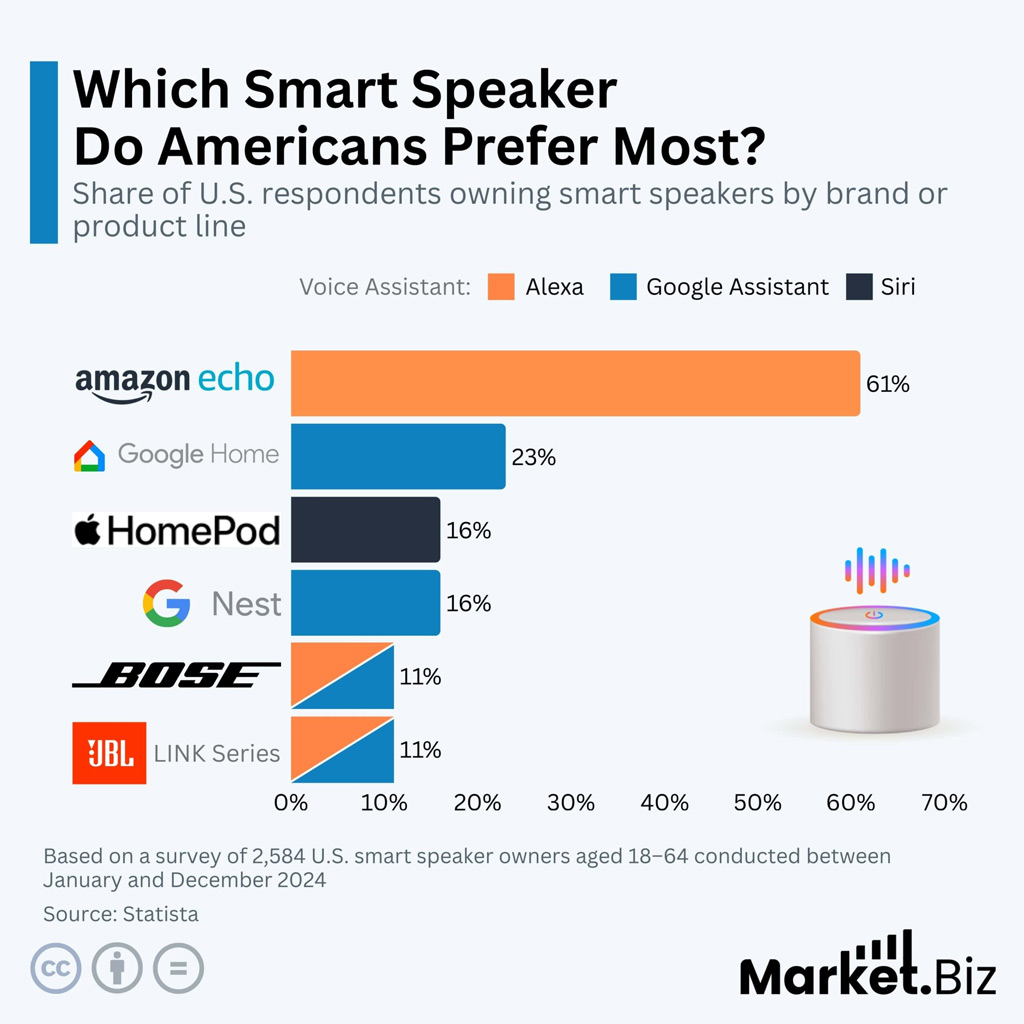
- Amazon Echo dominates the comparison with a 61% share, making it the clear leader among the listed smart speaker brands.
- Google Home ranks second at 23%, trailing Amazon Echo by 38 percentage points.
- Apple HomePod and Google Nest each hold a 16% share, placing them level in the comparison.
- Bose accounts for 11%, with support for both Alexa and Google Assistant.
- JBL Link Series also holds an 11% share, matching Bose among the listed brands.
- The data shows a substantial gap between Amazon Echo at 61% and every competing smart speaker brand shown.
Amazon Echo vs Google Nest Market Share
- As of June 2026, Amazon Echo accounted for approximately 66.7%, two-thirds, of the U.S. smart-speaker installed market in survey-based estimates.
- The same 2026 research found Amazon’s share had declined slightly from its previous peak, although Echo continued to hold a large lead over competing smart-speaker brands.
- A different 2024 ownership survey found 60% of U.S. smart-speaker owners had an Amazon Echo, while 23% had Google Home. Multiple ownership was allowed, so these numbers should not be summed into a conventional 100% market-share calculation.
- That 2024 ownership data gave Amazon a 37-percentage-point advantage over Google among surveyed U.S. smart-speaker owners.
- The corresponding Amazon-to-Google ownership ratio was approximately 2.6 to 1, based on the reported 60% and 23% ownership rates.
- Earlier survey data covering April 2023 through March 2024 put Amazon ownership at roughly two-thirds of U.S. smart-speaker owners, compared with 24% for Google Home.
- In 2025, Amazon also led new purchasing activity: 60% of U.S. households that had recently purchased or received a smart speaker chose Amazon, compared with 18% choosing Google.
- Amazon’s 60% share of those recent purchases was approximately 3.3 times Google’s 18%, indicating that Echo’s installed-base advantage continued to receive support from new-device demand in 2025.
Amazon Echo vs Google Nest Sales
- Amazon announced in 2023 that consumers had purchased well over 500 million Alexa-enabled devices worldwide, establishing a large hardware base before the Alexa+ transition.
- By 2025, Amazon was reporting more than 600 million Alexa devices in the market, meaning the disclosed ecosystem count had grown by at least 100 million compared with the half-billion milestone.
- Amazon’s 2026 disclosures continued to place its Alexa hardware footprint above 600 million devices, rather than announcing a newer cumulative Echo-only sales total.
- In 2025 U.S. purchase research, 60% of households that recently acquired a smart speaker chose an Amazon-branded model, making Amazon the largest brand within the surveyed recent-purchase group.
- Google captured 18% of those recent U.S. smart-speaker purchases, giving Amazon a 42-percentage-point advantage in that purchasing cohort.
- Apple accounted for 8% of the same recent-purchase group, meaning Google’s 18% share was more than twice Apple’s share, although it remained well below Amazon’s.
- Google does not publicly report an equivalent cumulative sales figure specifically for Nest and Google Home speakers. Instead, it reported that its broader Home APIs ecosystem gave developers access to more than 750 million connected devices in 2025.
- Amazon’s 2025-to-2026 figures therefore provide a clearer public measure of Alexa-enabled hardware scale, while Google’s disclosed numbers measure its wider connected-home ecosystem and should not be interpreted as 750 million Google Nest speakers sold.
Amazon Echo vs Google Nest User Base in India
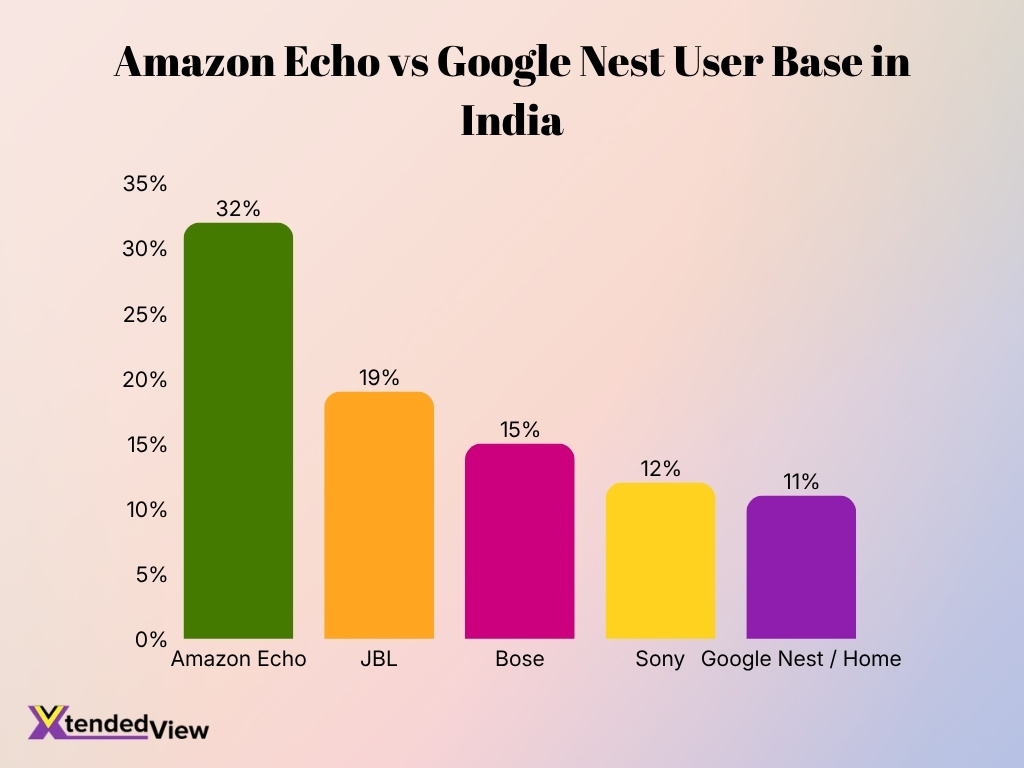
- Amazon Echo leads the smart speaker market in India, with 32% of smart speaker owners using an Echo device.
- Google Nest / Home holds an 11% share, giving Amazon Echo a substantial 21-percentage-point lead over Google.
- JBL ranks second at 19%, while Bose accounts for 15% of smart speaker ownership.
- Sony holds a 12% share, narrowly ahead of Google Nest / Home at 11%.
- Amazon Echo’s 32% share is nearly three times Google Nest / Home’s 11%, highlighting a significant difference in their Indian user bases.
- Together, Amazon Echo and Google Nest / Home account for 43% of the smart speaker ownership represented in the data.
Amazon Echo vs Google Nest Household Adoption
- In 2025, 51% of U.S. internet households reported owning a smart speaker and/or smart display, putting these devices in more than half of connected American households under that survey’s definition.
- A separate February 2026 survey found 35% of U.S. adults personally reported having a smart speaker. The difference reflects distinct populations and methodologies: one measures internet households and includes displays, while the other measures individual adults and smart speakers.
- Among households acquiring a smart speaker during the six months covered by the 2025 purchasing research, 60% selected Amazon, versus 18% selecting Google.
- The 42-percentage-point gap between Amazon and Google among those recent buyers indicates that Amazon continued adding Echo households faster within that particular U.S. purchasing sample.
- In 2024 consumer research, 75% of U.S. adults said they did not own a smart-speaker assistant, leaving 25% reporting ownership at that time.
- Amazon’s ecosystem extends beyond one speaker per household. The company has reported that millions of smart-home customers have more than 20 devices connected to Alexa, demonstrating how deeply the platform can penetrate established smart homes.
- Those customers collectively used Alexa to control connected smart-home equipment more than 1 billion times per week, highlighting that household adoption can translate into recurring device-control activity rather than occasional speaker use.
- Google has taken a similar ecosystem approach: its Home platform expanded from developer access to more than 600 million devices in 2024 to over 750 million in 2025, while Gemini for Home began extending AI functionality across speakers, displays, cameras, doorbells and automations.
Amazon Echo vs Google Nest Global Shipments
- Global smart-speaker and smart-display shipments reached 148 million units in 2024, down 4% year over year as mature markets faced slower replacement demand.
- The market showed signs of recovery in the second half of 2025. Global smart-speaker shipments reached 27.2 million units in 2H 2025, representing 4.6% year-over-year growth.
- Average selling prices also increased during 2025. The global smart-speaker ASP rose to $108 in 2H 2025, up from $98 during the first half of the year. That represents an increase of about 10.2%.
- For historical context, global smart-speaker shipments totaled 72.4 million units in 2023, down 27.9% from 100.4 million in 2022 under a narrower speaker-only measurement. Amazon strengthened its market-share position despite a 14% shipment decline that year.
- The different 72.4 million and 148 million totals should not be compared directly as annual growth figures because industry trackers can use different category definitions, particularly around smart displays.
- Amazon entered the current AI-driven upgrade cycle with more than 600 million Alexa devices already deployed across its broader ecosystem. This total covers Alexa-enabled endpoints rather than annual Echo shipments.
- Google’s comparable ecosystem measure reached more than 750 million devices accessible through its Home APIs in 2025, up from more than 600 million announced in 2024. Again, this measures the connected-home ecosystem rather than Nest speaker shipments.
- North American smart-speaker shipment growth had already slowed before the current AI refresh. Earlier forecasts put 2021-2026 shipment CAGR at just 1.3% for the region, compared with 118% CAGR from 2014 through 2021.
- Within that earlier forecast, Amazon’s North American speaker shipments were projected to record a -3.2% CAGR from 2021 through 2026, while Google’s forecast CAGR was 0.2%. These are historical forecasts, not measured 2026 results, but they illustrate why both companies now emphasize AI software and services alongside hardware.
Amazon Echo vs Google Nest U.S. Market Share
- As of June 2026, Amazon Echo devices accounted for approximately two-thirds of the U.S. smart-speaker installed market in a survey of U.S. smart-speaker owners.
- Echo’s roughly 66.7% installed share in June 2026 represented a slight decline from its earlier level, but Amazon remained the dominant U.S. smart-speaker brand.
- A separate survey conducted throughout 2024 found 60% of U.S. smart-speaker owners owned an Amazon Echo. Google Home reached 23%, while Apple HomePod reached 16%.
- Based on those 2024 ownership figures, Amazon held a 37-percentage-point advantage over Google’s 23% penetration among surveyed smart-speaker owners.
- Echo’s 60% ownership rate was approximately 2.6 times Google’s 23% rate in the same survey. Respondents could own multiple brands, so these percentages represent brand penetration rather than mutually exclusive shipment shares.
- The same research found 75% of U.S. adults did not own a smart speaker in 2024, leaving substantial room for both ecosystems to expand beyond existing owners.
- Amazon also led recent U.S. purchasing activity entering 2026. In 2025 household research, Amazon represented 60% of recently purchased or received smart speakers, versus 18% for Google.
- That purchasing split gave Amazon a 42-percentage-point lead over Google and made its share about 3.3 times Google’s among the measured recent acquisitions.
- Amazon’s installed-market leadership therefore appears in multiple measurements: roughly 60% ownership in the 2024 consumer survey and about two-thirds of the installed market in the June 2026 owner survey. The methodologies differ, so the figures show the direction of the market rather than a single continuous market-share series.
Amazon Echo vs Google Nest Usage Statistics
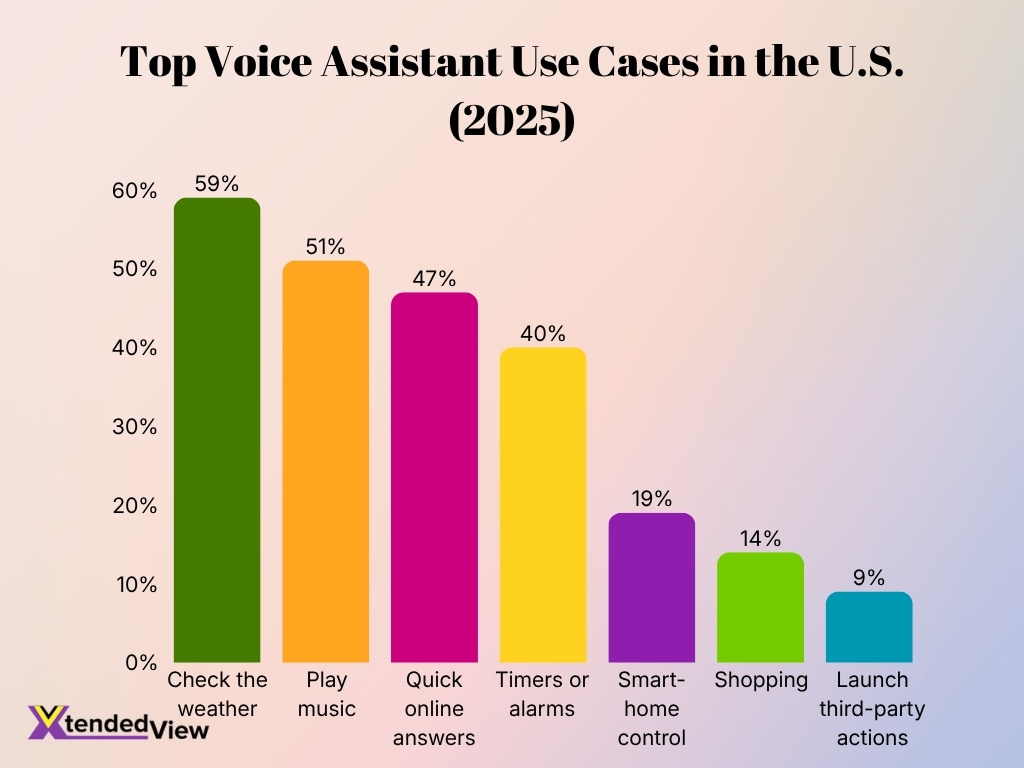
- In a 2025 U.S. survey, 59% of digital-assistant users said they used assistants to check the weather, making weather information the most common measured activity.
- 51% used digital assistants to play music, showing why audio quality remains central to both Echo and Google Home hardware development.
- Another 47% used assistants for quick online answers, while 40% used them for timers or alarms.
- Smart-home control reached 19% of U.S. digital-assistant users in that 2025 research, below basic information and entertainment tasks but important to the strategic role of Echo and Google Home as household hubs.
- Shopping through digital assistants remained less common at 14%, while only 9% reported launching third-party actions.
- Alexa+ changed usage among customers who received Amazon’s new assistant. Amazon reported that these users talked to Alexa twice as much and held longer conversations across a wider range of topics.
- Alexa+ customers also completed purchases on devices three times more often, suggesting Amazon’s generative AI upgrade could increase commerce activity through Echo hardware.
- Music streaming among Alexa+ customers increased 25%, while smart-home functionality usage rose 50% compared with prior behavior.
- Regional usage illustrates the scale of mature Alexa markets. Canadian customers engage with Alexa more than 500 million times per month and consume over 50 million hours of music monthly through Echo devices.
- In India, Alexa recorded more than 9 billion interactions during the 12 months preceding its September 2026 Alexa+ rollout, demonstrating that Echo usage extends well beyond the U.S. market.
Amazon Echo vs Google Nest Revenue
- Neither company separately reports annual Echo or Nest speaker revenue, which prevents a reliable direct revenue comparison between the two product families.
- Amazon generated $716.9 billion in total net sales in 2025, up 12% from $638.0 billion in 2024. Echo hardware forms only a small portion of that companywide figure.
- Amazon’s North American segment generated $426.3 billion in 2025 sales, compared with $387.5 billion in 2024, representing roughly 10% year-over-year growth.
- Amazon’s international segment generated $161.9 billion in 2025, up from $142.9 billion in 2024. Echo sales are included within broader company reporting rather than broken out as an independent product line.
- Amazon’s online-store revenue reached $269.3 billion in 2025, compared with $247.0 billion in 2024. This category includes a broad range of products and cannot serve as an Echo revenue proxy.
- Google’s parent company reported $48.03 billion in subscriptions, platforms and devices revenue in 2025, up from $40.34 billion in 2024. That equals growth of about 19.1%.
- The Google category increased by approximately $7.7 billion year over year, with the company attributing most of the increase to subscription growth rather than Nest hardware specifically.
- Google’s total 2025 revenue reached $402.84 billion, up from $350.02 billion in 2024. Nest hardware therefore sits inside a much larger advertising, subscription, cloud and device business.
- Industry estimates valued the overall global smart-speaker market at $15.10 billion in 2025 and project it to reach $16.61 billion in 2026. North America represented 40.2% of the 2025 market under that estimate.
- Consequently, companywide or segment revenue should not be presented as Echo-versus-Nest revenue. Neither company provides enough product-level financial disclosure to calculate a verified 2025 or 2026 revenue winner for the two speaker families.
Amazon Echo vs Google Nest Device Models
- Amazon’s major Alexa+-ready hardware refresh introduced four core devices in late 2025: Echo Dot Max, Echo Studio, Echo Show 8 and Echo Show 11.
- Echo Dot Max uses Amazon’s AZ3 chip and delivers nearly 3 times the bass of the fifth-generation Echo Dot. It also moved the Dot design to a two-speaker architecture with a woofer and tweeter.
- Echo Studio’s 2025 redesign made the speaker 40% smaller than the original model while retaining spatial audio and Dolby Atmos support.
- Echo Studio combines one high-excursion woofer with three full-range drivers, positioning it above Echo Dot Max for room-filling audio.
- Amazon allows users to connect as many as five Echo Studio or Echo Dot Max speakers with compatible Fire TV hardware for a multi-speaker home theater configuration.
- Echo Show 8 and Echo Show 11 both include 13-megapixel cameras and upgraded front-facing stereo speakers, expanding the Echo lineup beyond voice-only hardware into video calls, visual information, and smart-home dashboards.
- Google’s speaker strategy changed significantly in June 2026 when production of the Nest Mini and Nest Audio ended, with the new Google Home Speaker replacing the aging speaker models.
- The 2026 Google Home Speaker uses a 58 mm full-range driver, three far-field microphones, 1 GB of RAM, and 4 GB of storage and was designed specifically around Gemini for Home.
- Google still lists the Nest Hub (2nd gen) as a smart-display option at $99.99, giving its ecosystem a screen-based home-control device alongside the newer Gemini-focused speaker.
- As a result, Amazon entered 2026 with a broader, newly refreshed Echo hardware range spanning compact speakers, premium speakers, and two display sizes, while Google’s biggest speaker change centered on consolidating Nest Audio and Nest Mini around one new Gemini-first Google Home Speaker.
Amazon Echo vs Google Nest Price Comparison
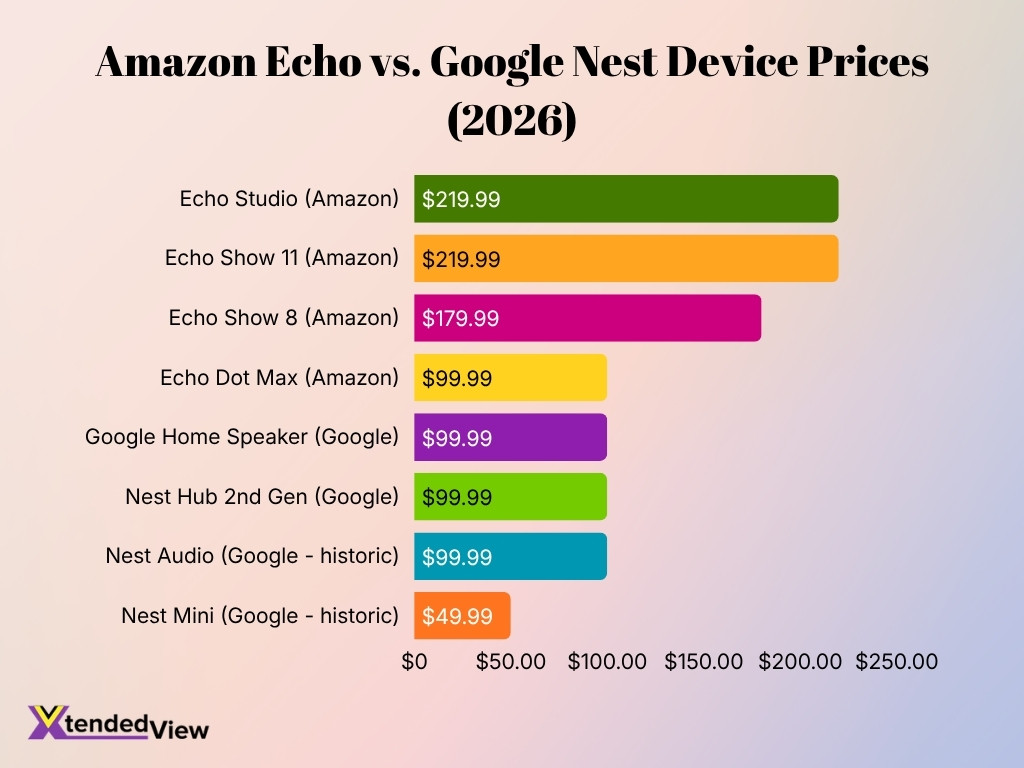
- Echo Dot Max launched in the U.S. at $99.99, placing Amazon’s upgraded compact speaker at the same launch-price level as Google’s 2026 Google Home Speaker.
- The Google Home Speaker went on sale in June 2026 for $99.99, creating a direct $100-class price comparison with Echo Dot Max.
- Amazon priced the redesigned Echo Studio at $219.99, making it $120 more expensive than the $99.99 Echo Dot Max at their original U.S. prices.
- Echo Show 8 entered the refreshed lineup at $179.99, adding an 8.7-inch-class display and upgraded spatial-audio hardware for $80 more than Echo Dot Max.
- Echo Show 11 launched at $219.99, matching Echo Studio’s original price while targeting consumers who want a larger display instead of an audio-focused speaker.
- Google’s Nest Hub (2nd gen) remains listed at $99.99, meaning Google’s speaker and smaller smart-display options can occupy the same approximate $100 price tier.
- Before Google ended Nest Mini production in 2026, its established U.S. price was $49.99, while Nest Audio sold for $99.99. Those models helped Google compete in both entry-level and midrange speaker tiers.
- At their original launch prices, two Echo Dot Max units cost $199.98, while two Google Home Speakers also cost $199.98, creating identical hardware entry costs for a two-speaker setup.
- Pricing can change substantially during promotions and over a product’s lifecycle. Therefore, the $99.99 versus $99.99 comparison between Echo Dot Max and Google Home Speaker is most useful as an original U.S. list-price benchmark rather than a guarantee of current checkout prices.
Amazon Echo vs Google Nest Voice Assistant Usage
- Nearly 64% of Alexa users in a multinational voice-assistant study reported using Alexa daily, compared with 55% of Google Assistant users.
- That creates a 9-percentage-point daily-usage advantage for Alexa over Google Assistant within that study’s user samples.
- U.S. consumers continue to favor simple voice-assistant functions. In 2025, weather checks reached 59% of users, music 51%, quick information 47%, and timers or alarms 40%.
- Alexa’s hardware reach now exceeds 600 million devices, giving Alexa+ a substantial installed base on which Amazon can expand conversational AI usage without relying entirely on new Echo purchases.
- Gemini’s broader consumer ecosystem reached more than 1 billion monthly Gemini app users by August 2026. This figure does not represent Google Nest users, but it shows the scale of the AI platform Google can connect to its home strategy.
- Voice already plays a large role within that wider Gemini population: 63% of Gemini users talk directly to the service, indicating strong consumer acceptance of voice interaction as Google extends Gemini into home hardware.
- Google expanded Gemini Live in July 2026 to additional older speakers and displays, including first-generation Google Home Mini and Nest Hub hardware for eligible subscribers. Gemini Live was already supported on Nest Mini, Nest Audio, Nest Hub, Nest Hub Max, and Google Home Speaker.
- Gemini for Home’s conversational memory window reached 15 minutes in 2026, allowing follow-up questions to retain context for substantially longer than traditional one-command voice-assistant interactions.
- Google Home’s Gemini Live listens for follow-up speech for up to 15 seconds after responding during an active conversation, reducing the need to repeat the wake phrase for every question.
- The competitive shift in 2026 therefore goes beyond traditional command counts: Amazon is measuring higher engagement after Alexa+, while Google is using Gemini’s billion-user AI footprint and conversational voice features to reshape interaction on Nest and Google Home hardware.
Amazon Echo vs Google Nest Smart Home Compatibility
- Alexa’s smart-home ecosystem supports more than 140,000 compatible device models, covering categories such as lights, locks, thermostats, cameras, plugs and appliances.
- More than 400 million smart-home devices had been connected to Alexa by 2023, up from more than 300 million reported a year earlier. The 100-million-plus increase illustrates the scale of Amazon’s connected-device ecosystem entering the Alexa+ era.
- Amazon had already added Matter support to more than 100 million Echo and eero devices, giving existing households a large installed base capable of using the cross-platform smart-home standard.
- Amazon’s Matter expansion covered 30 Echo and eero models after an initial rollout to 17 models, alongside support for device categories including thermostats, blinds and sensors.
- Echo Hub supports Zigbee, Matter, Thread, Bluetooth Low Energy and Amazon Sidewalk, while Wi-Fi and Ethernet provide network connectivity. This allows one control panel to manage products built around several major smart-home protocols.
- Echo Hub can execute some local smart-home commands in as little as 300 milliseconds, reducing dependence on cloud processing for compatible lights, switches and plugs.
- Google’s Home APIs gave developers access to more than 750 million devices in 2025, up from more than 600 million when the platform expansion was announced in 2024.
- Google’s 2025 Home APIs rollout also opened Matter commissioning through a potential base of 3 billion Android devices, allowing compatible products to use Fast Pair and connect directly through participating apps.
- Nearly 2,000 developers had signed up to learn more about Google’s Home APIs by January 2025, providing another indicator of developer interest around its expanding smart-home platform.
- Both ecosystems therefore support Matter, but their disclosed scale measures different things: Amazon reports Alexa-compatible models and connected devices, while Google reports devices accessible through its Home APIs. These figures should not be treated as identical compatibility counts.
Amazon Echo vs Google Nest Customer Satisfaction
- A 2025 academic comparison of domestic smart speakers analyzed responses from approximately 1,400 U.S. and U.K. participants, covering devices including Amazon Echo and Google Nest. The research evaluated multiple dimensions of AI user experience rather than relying only on sales or ownership data.
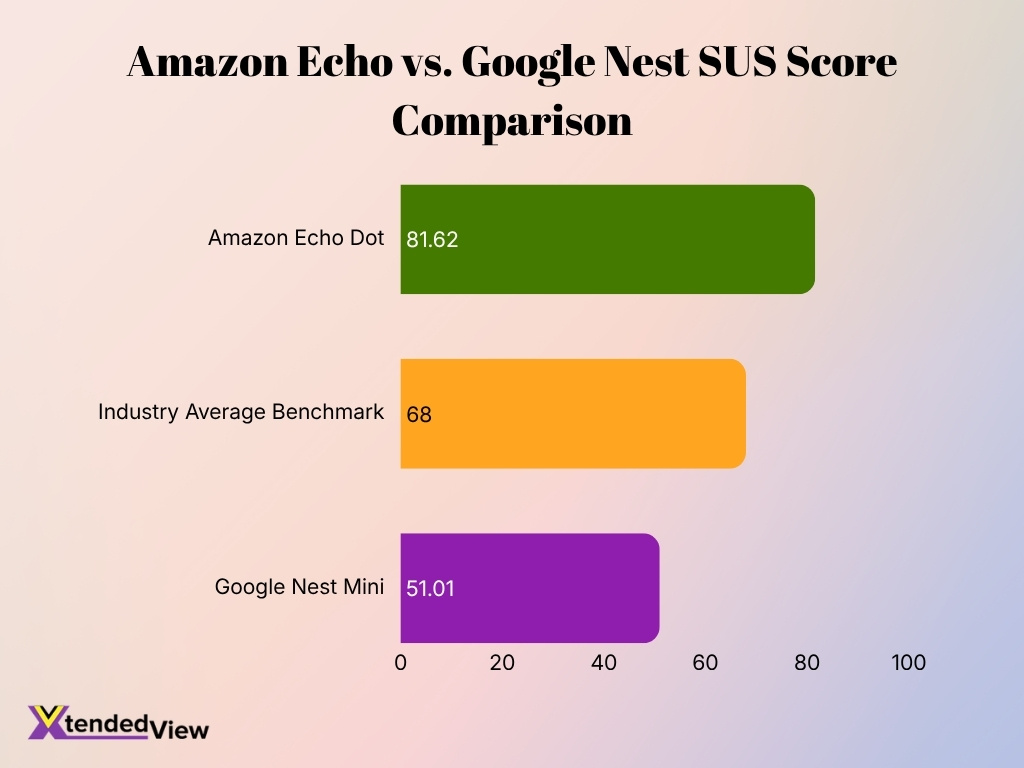
- Separate usability research produced a mean System Usability Scale score of 81.62 for Amazon Echo Dot, compared with 51.01 for Google Nest Mini in the study sample.
- The Echo Dot’s usability score was therefore approximately 30.6 points higher than the Google Nest Mini result in that specific study. The sample and testing methodology mean the result should not be generalized to every Echo and Nest owner.
- A System Usability Scale score of 68 is commonly treated as the approximate average benchmark. In that study, Echo Dot scored about 13.6 points above the benchmark, while Nest Mini scored roughly 17 points below it.
- A large 2025 reader poll involving nearly 10,000 Google Home and Nest users found that 55% reported frequent glitches or failed commands. This was an opt-in reader poll rather than a nationally representative consumer survey.
- Another 16.5% in that poll said their Google Home or Nest devices had become nearly unusable, bringing the combined share reporting major problems to 71.5%.
- A further 19.8% reported minor issues, meaning only a relatively small portion of that self-selected 2025 poll reported an experience free of the problems measured.
- A separate 2025 poll of 1,616 respondents found 12% describing their Google Home experience as seamless and bug-free, while 17% said bugs did not bother them much. Because this was also an online reader poll, it works best as a sentiment indicator rather than a population estimate.
- Despite those Google Home reliability complaints, Google’s U.S. smart-speaker ownership remained substantial: 23% of U.S. smart-speaker owners surveyed during 2024 reported owning Google Home, compared with 60% owning Amazon Echo.
- Current nationally representative 2026 head-to-head satisfaction scores for Echo and Google Nest are not publicly available. Academic usability research, owner polls, and installed-base data therefore provide useful but methodologically different indicators rather than one definitive satisfaction ranking.
Amazon Echo vs Google Nest Music Streaming Usage
- Music remains one of the leading voice-assistant applications in the U.S. In 2025, 51% of digital-assistant users reported using assistants to play music.
- Alexa+ has increased music engagement among upgraded customers. Amazon reported that Alexa+ users streamed 25% more music after moving to the generative AI experience.
- The same Alexa+ population talked to the assistant twice as much, suggesting that higher music consumption forms part of a broader increase in voice engagement rather than an isolated streaming change.
- Alexa+’s music capabilities expanded beyond direct song requests in 2026. Users can describe a song they cannot remember, request music for a mood or activity, or ask for music associated with a movie before starting playback.
- Alexa+ expanded to additional third-party audio hardware in 2026, including 10 listed Bose speaker, soundbar, and amplifier product lines or model families in the U.S., extending Alexa’s music experience beyond Echo hardware.
- Amazon Music supports HD, Ultra HD, and Spatial Audio on eligible subscription tiers and compatible hardware, although feature availability varies by plan and device.
- Older consumer research found 66% of virtual-assistant owners used their devices to play music or podcasts, showing that audio has remained a core smart-speaker activity across several product generations.
- Google’s 2026 Gemini for Home experience supports media discovery and playback on compatible speakers and displays. Standard Gemini for Home can handle media actions, while Gemini Live focuses on conversational exchanges rather than direct device actions during a Live session.
- Google’s 2026 Home Speaker uses a 58 mm full-range driver and supports pairing two speakers for stereo playback, reflecting the continued importance of music even as Gemini becomes the main software differentiator.
- Direct 2026 Echo-versus-Google Home streaming-hour figures are not publicly disclosed. Therefore, Alexa’s reported 25% music increase should not be interpreted as a 25-percentage-point advantage over Google Nest.
Amazon Echo vs Google Nest Privacy and Security
- A recent smart-speaker privacy study found that only 29% of Amazon Echo and Google Home/Nest users correctly understood that their data was processed online, while 28% believed processing happened locally.
- Only 35% of Echo and Google Home/Nest users in the same research said their data was stored online, highlighting a substantial gap between smart-speaker use and consumer understanding of data handling.
- Just 13% of Amazon and Google smart-speaker users in the study correctly identified the measured data-retention practice presented by researchers. Most respondents either answered incorrectly or did not know.
- 41% of Amazon and Google Home/Nest users believed employees of the manufacturer could view their data, while 40% thought voice data could reveal personal characteristics.
- Another 47% of Echo and Google Home/Nest users believed family members or other people in the household could review previous interactions.
- For Gemini for Home, Home History uses an 18-month default auto-delete period. Users can change that period to three or 36 months or turn automatic deletion off.
- When Google Home History is off, Gemini for Home activity such as voice-assistant queries may still remain in the account for up to 24 hours for service delivery, safety, security, and feedback processing.
- Google’s setting that allows voice, audio, and Gemini Live recordings to help improve services and train generative AI models is off by default and requires users to opt in.
- Google Guest Mode automatically deletes voice-assistant activity and audio recordings associated with the device owner’s account and prevents the assistant from presenting personal results such as calendar events and contacts.
- Alexa users can manage recordings and transcripts through privacy controls. One available configuration automatically deletes voice recordings after Alexa processes a request, while associated transcripts can remain available for 30 days unless users delete them sooner.
Amazon Echo vs Google Nest AI and Generative AI Features
- Alexa+ became available to all U.S. customers in 2026, with unlimited access priced at $19.99 per month for non-Prime customers and included at no additional charge with Prime.
- Amazon said Alexa+ had scaled to tens of millions of customers by January 2026, after beginning its Early Access rollout in 2025.
- Alexa+’s generative AI transition increased conversations by roughly 2 times, purchases made through devices by 3 times, and recipe requests by 5 times among customers using the new assistant.
- Amazon separately reported 25% higher music streaming and 50% greater smart-home functionality usage among Alexa+ customers, suggesting that generative AI is influencing established Echo use cases as well as conversational queries.
- Alexa+ works across a broader footprint of 600 million active Alexa endpoints, although that number includes devices, cars, offices, Fire TV and Prime Video rather than Echo speakers alone.
- Google began replacing Google Assistant with Gemini for Home across compatible home hardware in 2025 and said the upgrade would extend to speakers, displays, cameras and doorbells produced over roughly the previous 10 years.
- Gemini Live reached additional first-generation Google Home hardware in July 2026, while compatible devices already included Nest Mini, Nest Audio, Nest Hub, Nest Hub Max and the new Google Home Speaker.
- Gemini for Home’s conversational memory expanded to 15 minutes in July 2026, allowing follow-up questions to reference topics discussed during that window.
- During Gemini Live conversations, compatible Google speakers and displays can listen for follow-up questions for up to 15 seconds after a response, reducing the need to repeat the wake phrase.
- Google Home Premium costs $10 per month or $100 annually for Standard and $20 per month or $200 annually for Advanced. Standard adds Gemini Live and 30-day video history, while Advanced adds features such as AI event descriptions, Home Brief, and searchable video history.
Frequently Asked Questions (FAQs)
Amazon-branded devices accounted for 60% of recent U.S. smart-speaker purchases, compared with 18% for Google, giving Amazon a 42-percentage-point lead.
In 2025 research, 51% of U.S. internet households reported owning a smart speaker and/or smart display.
A February 2026 survey found that 35% of U.S. adults owned a smart speaker, rising to 41% among adults ages 30 to 49.
Alexa+ costs $19.99 per month for unlimited access without Prime and is included with Prime, while the Google Home Speaker launched at $99.99.
Recent U.S. household research puts Amazon’s broader consumer-device ecosystem at 46% of internet households, compared with 29% for Google’s ecosystem, a 17-percentage-point difference.
Conclusion
Amazon Echo retains the larger measured U.S. smart-speaker footprint, at roughly two-thirds of the installed market, while Google is rebuilding its home experience around Gemini. Amazon is pursuing the same AI transition through Alexa+, backed by 600 million active Alexa endpoints and increased engagement among upgraded users. Both ecosystems now compete as AI-powered smart-home platforms rather than simply speaker brands, making interoperability, privacy, recurring usage, and conversational AI increasingly important measures of their position.