



Amazon enters the year as one of the world’s largest commerce and technology companies, with operations spanning online retail, cloud computing, digital advertising, subscriptions, logistics, entertainment, and marketplace services. Its scale affects both consumers and businesses: shoppers rely on Amazon for fast delivery and everyday purchases, while companies use AWS for computing, storage, data processing, and AI workloads. Independent merchants also use Amazon’s marketplace and fulfillment infrastructure to reach customers across the U.S. and international markets.
In 2025, Amazon generated $716.9 billion in net sales, while Q2 2026 revenue reached $200.6 billion, reflecting continued growth across retail, AWS, advertising, and subscription services. The statistics in this article show how Amazon is expanding its revenue base, delivery network, seller ecosystem, customer reach, and global market position.
Editor’s Choice
- Amazon’s Q2 2026 revenue of $200.6 billion was about $32.9 billion higher than Q2 2025 revenue, marking 20% annual growth.
- Full-year 2025 revenue reached $716.9 billion, an increase of nearly $79 billion from 2024.
- Amazon’s 2025 operating income climbed to $80.0 billion, compared with $68.6 billion in 2024.
- Net income increased to $77.7 billion in 2025, up from $59.2 billion in 2024. Diluted earnings per share rose from $5.53 to $7.17.
- AWS sales reached $42.2 billion in Q2 2026, giving the cloud business an annualized revenue run rate of roughly $169 billion.
- Advertising services generated $19.8 billion in Q2 2026, 26% more than the $15.7 billion generated a year earlier.
- Third-party sellers generated an estimated $575 billion in GMV during 2025, or roughly 69% of Amazon’s estimated worldwide merchandise volume.
Recent Developments
- Amazon’s Q2 2026 operating income reached $27.5 billion, up 43% from $19.2 billion in Q2 2025.
- AWS accelerated sharply in 2026. Quarterly sales increased from $30.9 billion in Q2 2025 to $42.2 billion in Q2 2026, a 37% gain.
- Amazon Business reached a $60 billion annualized gross-sales run rate in Q2 2026, while its selection expanded by nearly 30% from the prior year.
- Amazon Business also extended Same-Day Delivery for fresh groceries to businesses across more than 2,300 U.S. cities and towns.
- New Amazon Pharmacy customers more than doubled during the first six months of 2026, while same-day prescription deliveries increased nearly fivefold.
- Manufacturer discounts delivered through Amazon Pharmacy saved customers nearly $250 million in out-of-pocket costs during the first half of 2026, more than 400% above the comparable year-earlier level.
- Usage of Amazon’s combined Rufus and Alexa+ shopping experience expanded rapidly in Q2 2026: active users came close to doubling, while interactions increased more than fivefold year over year.
- Amazon completed four additional Amazon Leo launches by Q2 2026, bringing its low Earth orbit satellite constellation to nearly 400 satellites as it prepared to begin initial service.
Amazon Company Overview
- Amazon finished 2025 with $716.9 billion in consolidated net sales, compared with $638.0 billion in 2024 and $574.8 billion in 2023.
- Amazon’s North America segment generated $426.3 billion in sales in 2025, representing about 59% of consolidated annual revenue before considering segment presentation differences.
- International segment sales increased 13% to $161.9 billion in 2025, or 10% when excluding foreign exchange movements.
- AWS contributed $128.7 billion in 2025 revenue, up nearly 20% from $107.6 billion in 2024.
- Online stores remained Amazon’s largest individual revenue category, generating $269.3 billion in 2025, compared with $247.0 billion in 2024.
- Third-party seller services contributed $172.2 billion in 2025, up 10.3% from $156.1 billion in 2024. This category includes commissions and related fulfillment, shipping, and seller-service fees.
- Advertising services produced $68.6 billion in 2025 revenue, up 22.1% from $56.2 billion in 2024.
- Subscription services, including Prime membership fees and eligible digital subscriptions, generated $49.6 billion in 2025, compared with $44.4 billion in 2024.
U.S. E-Commerce Market Share
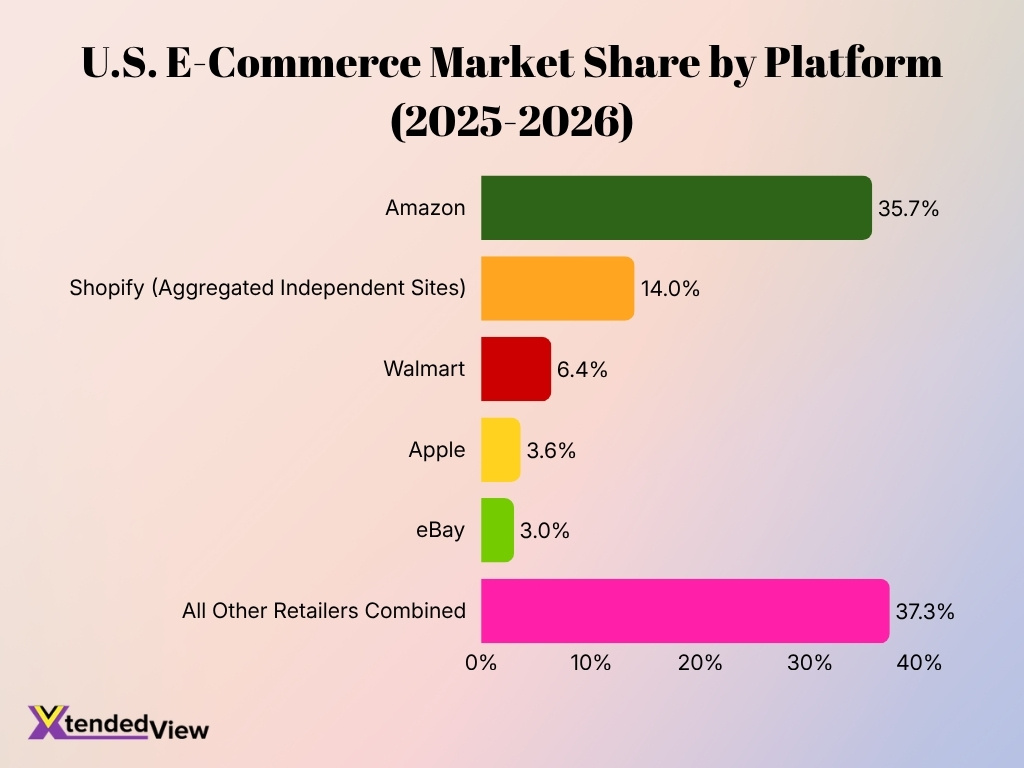
- Amazon dominates the U.S. e-commerce market with a 35.7% market share, making it the largest individual platform by a substantial margin.
- Shopify-powered independent sites collectively account for 14.0% of the market, highlighting the significant scale of merchants operating outside major centralized marketplaces.
- Walmart holds a 6.4% share, placing it well behind Amazon but making it another notable competitor in U.S. online retail.
- Apple represents 3.6% of U.S. e-commerce market share, while eBay accounts for a slightly smaller 3.0%.
- Amazon’s 35.7% share is more than 2.5 times Shopify’s aggregated 14.0% share, demonstrating Amazon’s considerable lead over its nearest listed platform.
- All other retailers combined capture 37.3% of the market, slightly exceeding Amazon alone and showing that a substantial portion of U.S. e-commerce remains distributed across smaller retailers and platforms.
Amazon Revenue and Financial Performance
- Amazon reported $716.924 billion in 2025 net sales, a 12.4% increase from $637.959 billion in 2024.
- Revenue growth accelerated further in 2026, with first-half sales reaching $382.1 billion, compared with $323.4 billion during the first half of 2025.
- Q2 2026 alone generated $200.6 billion in revenue, up 20% year over year. Foreign exchange had only a $0.1 billion favorable impact on the reported quarterly comparison.
- North America generated $116.2 billion in Q2 2026 sales, 16% above the prior-year quarter.
- International revenue rose 15% year over year to $42.2 billion in Q2 2026, compared with $36.8 billion in Q2 2025.
- Q2 2026 operating income increased to $27.46 billion, from $19.17 billion in Q2 2025.
- First-half 2026 operating income totaled $51.3 billion, up from $37.6 billion during the corresponding six months of 2025.
- Q2 2026 net income reached $62.6 billion, compared with $18.2 billion a year earlier. The unusually large increase included $53.4 billion of non-operating income, primarily associated with the valuation of Amazon’s Anthropic investment.
- Amazon generated $139.5 billion in operating cash flow during the trailing 12 months ended December 2025, up 20% from $115.9 billion a year earlier.
- However, trailing-12-month free cash flow stood at $11.2 billion at the end of 2025, as property and equipment spending increased by $50.7 billion year over year.
Amazon User and Customer Base
- A June 2026 U.S. consumer survey found that 65.2% of recent e-commerce shoppers had purchased from Amazon during the previous three months.
- The comparable measure stood at 71.3% in March 2026 and 74.5% in December 2025, showing that Amazon remained a common destination even as purchase rates moved between survey periods.
- A separate August 2026 retail survey found 39.6% of U.S. respondents had recently purchased from Amazon, compared with 37.5% in May 2026 and 44% in December 2025.
- The typical U.S. Amazon customer spent an estimated $1,000 annually during the 12 months ending March 2025, up from $960 in the comparable period ending March 2024.
- Prime membership creates a large difference in shopping frequency: U.S. Prime customers ordered from Amazon about twice per month in early 2026, compared with roughly once per month for non-Prime shoppers.
- That frequency gap helps explain why Prime customers have historically spent approximately twice as much per year as shoppers without Prime access.
- In 2024, estimated annual spending reached $1,170 per Prime customer, compared with $570 among non-Prime Amazon customers.
- Amazon’s customer base increasingly relies on fast fulfillment for routine purchases. In 2025, groceries and everyday essentials represented 50% of U.S. Prime items arriving the same day or next day.
- Fast delivery also reduced physical shopping trips. Amazon estimated that the average U.S. Prime member avoided 64 store trips in 2025, equal to more than 55 hours of shopping time.
Amazon Global GMV Growth Trends
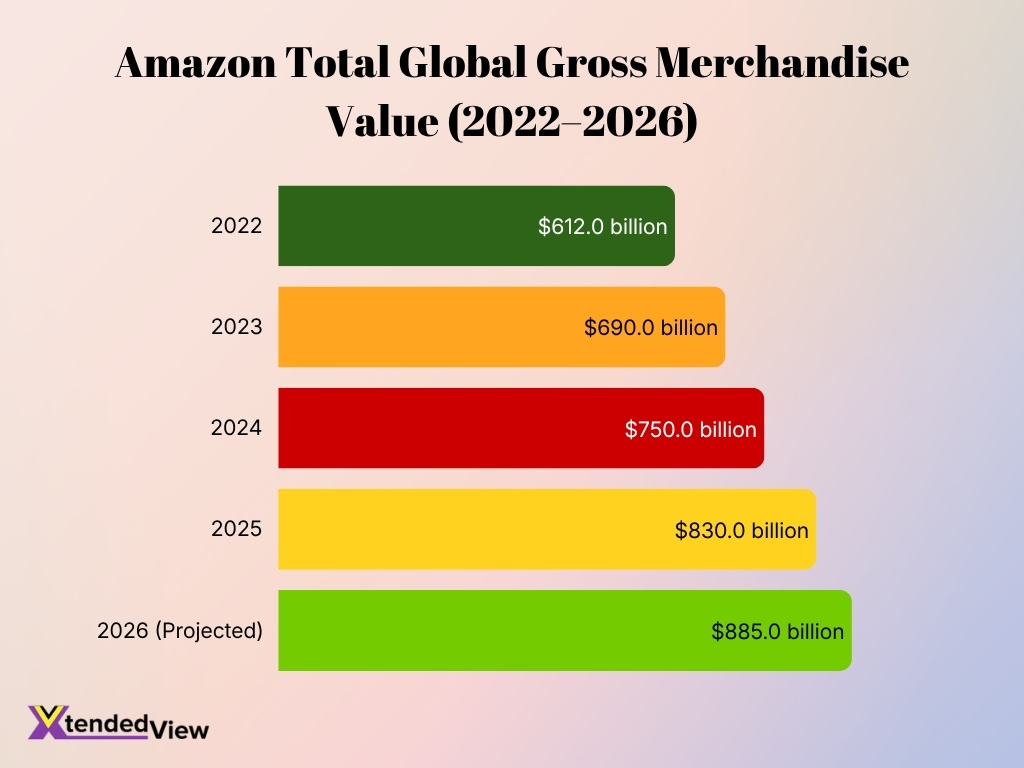
- Amazon’s estimated global gross merchandise value (GMV) increased from $612 billion in 2022 to $830 billion in 2025, reflecting substantial expansion in merchandise sales.
- Global GMV rose by $78 billion between 2022 and 2023, reaching approximately $690 billion.
- In 2024, Amazon’s estimated GMV climbed to $750 billion, an increase of $60 billion from the previous year.
- The strongest annual dollar increase in the period occurred in 2025, when GMV grew by $80 billion to reach $830 billion.
- Amazon’s global GMV is projected to reach approximately $885 billion in 2026, representing an additional $55 billion in merchandise value.
- From 2022 through the 2026 projection, Amazon’s GMV is expected to increase by $273 billion, or approximately 44.6% overall.
Amazon Order Volume and Shipping Statistics
- Amazon’s worldwide paid unit volume increased 17% year over year in Q2 2026, accelerating from 12% growth in Q2 2025.
- Worldwide paid units grew 15% in Q1 2026, compared with 8% growth in Q1 2025. That means unit growth strengthened through the first half of 2026.
- More than 13 billion items reached Prime members worldwide on the same day or next day during 2025, setting a delivery-speed record for the third consecutive year.
- U.S. Prime customers received more than 8 billion same-day or next-day items in 2025, an increase of more than 30% from 2024.
- Groceries and everyday essentials represented half of those U.S. fast-delivery orders, translating to a record 4 billion items delivered the same day or next day.
- The number of products reaching U.S. customers in less than one day increased 70% year over year in 2025 as the Same-Day Delivery network expanded.
- By early 2026, more than 500 million units had already moved through Amazon’s specialized same-day fulfillment centers in the U.S.
- Same-Day Delivery had expanded to more than 10,000 U.S. cities and towns by 2026, including smaller communities and rural markets.
- Amazon recorded $27.87 billion in worldwide shipping costs in Q2 2026, up 19% from $23.37 billion in Q2 2025.
Amazon Prime Day Sales Performance
- Prime Day 2026 ran for four days, June 23-26, continuing the four-day format introduced in 2025 while moving the event from July into June.
- U.S. consumers spent $26.4 billion online across retailers during the four-day Prime Day period, up 9.3% from the comparable 2025 event. This figure measures the broader U.S. e-commerce effect, not Amazon sales alone.
- The comparable four-day event in 2025 generated approximately $24.1 billion in U.S. online spending, meaning the 2026 promotional period added roughly $2.3 billion.
- U.S. online spending reached $8.3 billion on June 23, the first day of Prime Day 2026, up 5.3% from the first day of the 2025 event.
- Mobile devices generated 54.2% of online sales over the four-day 2026 promotional period, representing about $14.2 billion in spending.
- The average observed Amazon Prime Day order totaled $47.66 in 2026, down from $53.34 in the comparable 2025 tracking period.
- Approximately 63% of Prime Day households placed at least two orders, producing average household spending of about $143.45.
- About 69% of products purchased during Prime Day 2026 cost less than $20, while only 3% sold for more than $100. Average spending per item was $23.23.
- Returning shoppers dominated the event, with 89% of surveyed Prime Day customers reporting that they had participated in Prime Day before.
- Buy now, pay later generated approximately $2.1 billion in U.S. online spending during the four-day event and represented 6.6% of online orders.
Amazon Prime Membership Statistics
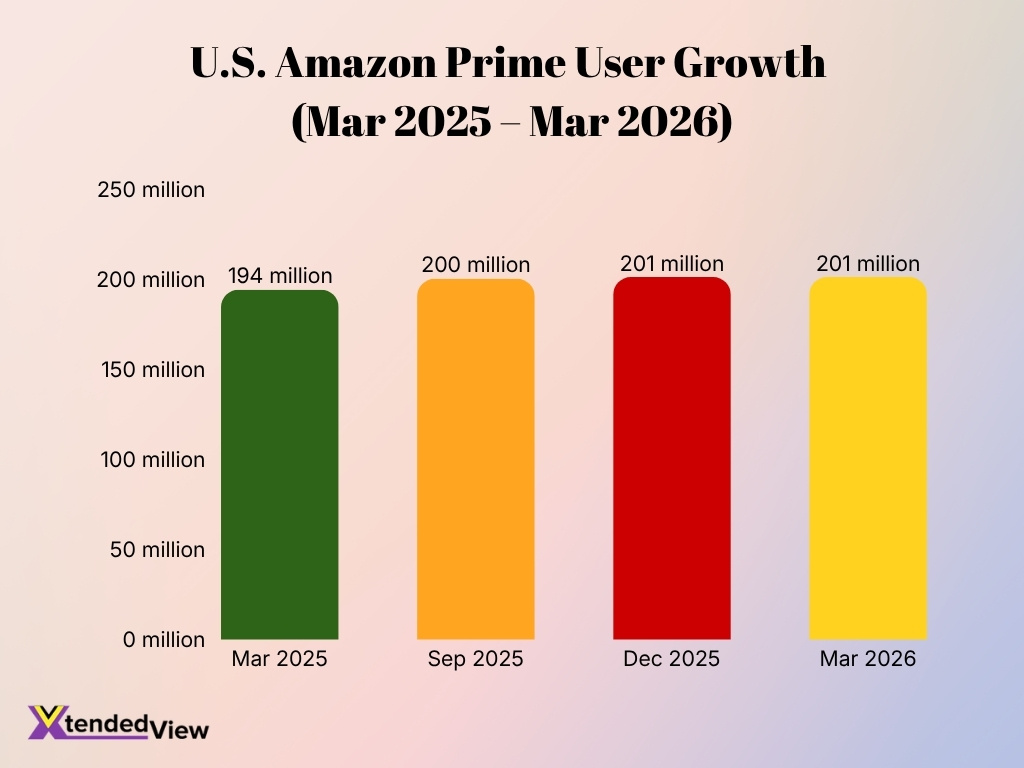
- An independent estimate placed the U.S. Prime user base at 201 million people in March 2026, unchanged from December 2025. This figure counts individuals who use a Prime membership rather than only paying households.
- U.S. Prime usage increased approximately 3% year over year, from an estimated 194 million users in March 2025 to 201 million in March 2026.
- Prime reached an estimated 200 million U.S. users in September 2025, up from 189 million in September 2024.
- By December 2025, the estimate had climbed to 201 million U.S. users, around 4% above 194 million a year earlier.
- Prime represented an estimated 73% of recent U.S. Amazon customers in March 2026, down slightly from a 75% share one year earlier.
- U.S. Prime membership costs $139 annually at the standard rate, while members saved an average of $550 on delivery during 2025, nearly four times the annual membership price.
- Prime customers worldwide saved approximately $105 billion on fast, free delivery in 2025.
- Prime members in the U.S. can access free shipping across more than 300 million items, with tens of millions eligible for same-day or next-day delivery.
- During the 21 days leading up to and including Prime Day 2025, Amazon recorded about 5.4 million new U.S. Prime sign-ups, roughly 2% fewer than during the comparable 2024 period.
Amazon Third-Party Seller Statistics
- Independent sellers generated more than 60% of sales in Amazon’s store during 2025, confirming that outside merchants now drive most marketplace commerce.
- In Q2 2026, third-party merchants accounted for 61% of worldwide paid units, compared with 62% in Q2 2025.
- Amazon collected $46.78 billion from third-party seller services in Q2 2026, up 16% year over year from $40.35 billion.
- Third-party seller services generated $41.58 billion in Q1 2026, 14% above the $36.51 billion recorded in Q1 2025.
- Across full-year 2025, third-party seller services produced $172.16 billion in revenue, compared with $156.15 billion in 2024.
- U.S.-based independent sellers sold more than 4.6 billion items during 2025, equal to more than 8,900 products every minute.
- Independent U.S. sellers averaged more than $375,000 in annual sales in 2025 through Amazon’s store.
- More than 75,000 independent sellers surpassed $1 million in sales during 2025.
- More than 11,000 U.S. independent sellers increased sales by over 10 times during 2025, highlighting the smaller group of merchants experiencing unusually rapid growth.
- U.S.-based independent sellers exported more than 580 million products globally in 2025, extending marketplace sales beyond their domestic customer base.
Amazon Seller Performance and Profitability
- Independent U.S. sellers averaged more than $375,000 in Amazon store sales during 2025, although individual results varied widely by product, category, scale, and operating model.
- More than 75,000 independent sellers crossed the $1 million annual-sales threshold in 2025, providing one measure of the marketplace’s higher-performing merchant base.
- A 2025 survey of nearly 1,500 sellers and e-commerce businesses found 38% of enterprise brands cited higher shipping expenses as a major selling challenge.
- In the same 2025 research, 34% cited higher product costs as a significant concern, showing how inventory economics can squeeze seller margins even when revenue grows.
- Another 32% identified rising advertising expenses as a major concern in 2025, underscoring the increasing cost of winning visibility inside the marketplace.
- A separate seller survey found 67% of sellers raised prices during 2024, yet nearly 60% still reported declining profitability heading into 2025.
- Among very large sellers in that survey, 50.8% reported lower profit in 2024, showing that scale alone did not protect merchants from higher operating costs.
- Historical profitability benchmarks found 57% of small and midsize Amazon sellers achieved margins above 10%, while 28% reported margins above 20%. These figures provide context rather than a 2026 profitability estimate.
- About 13% of surveyed SMB sellers were not yet profitable in that benchmark, illustrating the difference between generating marketplace sales and producing positive bottom-line returns.
- Amazon said it helped U.S. small and medium-sized businesses access more than $1 billion in financing during 2025, giving merchants additional working capital for inventory and growth.
Amazon Referral Fees by Product Category
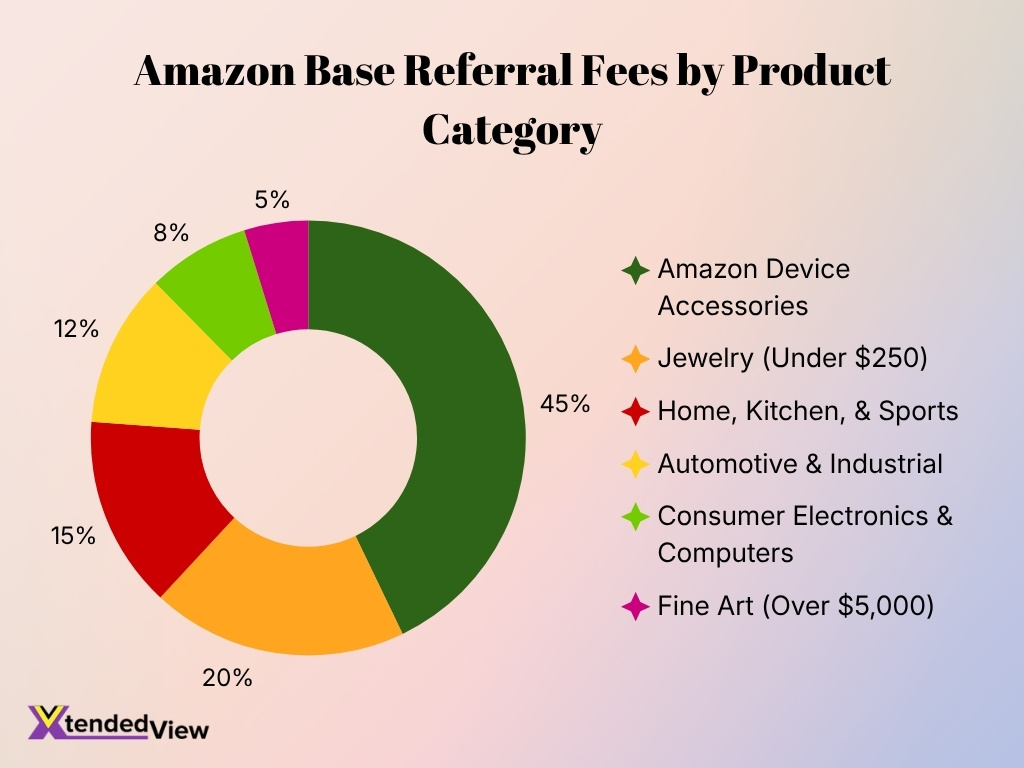
- Amazon Device Accessories carry the highest base referral fee at 45%, significantly exceeding every other category shown.
- Jewelry priced under $250 has the second-highest referral fee at 20%, less than half the rate charged for Amazon device accessories.
- Sellers in Home, Kitchen, & Sports face a 15% base referral fee, placing the category in the middle of the fee range.
- Automotive & Industrial products have a 12% referral fee, which is 3 percentage points lower than Home, Kitchen, & Sports.
- Consumer Electronics & Computers have a comparatively low referral fee of 8%, despite being major categories on Amazon.
- Fine Art priced over $5,000 has the lowest base referral fee in the comparison at just 5%, a 40-percentage-point gap from the highest-fee category.
Amazon Advertising Revenue and Growth
- Amazon generated $19.81 billion in advertising services revenue in Q2 2026, up 26% from $15.69 billion in Q2 2025.
- The 26% Q2 growth rate accelerated from 22% year-over-year growth in Q1 2026, making advertising one of Amazon’s fastest-growing major revenue categories.
- Q1 2026 advertising services revenue reached $17.24 billion, compared with $13.92 billion in the first quarter of 2025.
- Combined advertising revenue for the first half of 2026 reached about $37.05 billion, calculated from the company’s reported Q1 and Q2 figures.
- During full-year 2025, advertising services produced $68.64 billion, up from $56.21 billion in 2024.
- That represents an annual increase of roughly 22.1% in 2025, adding approximately $12.42 billion in advertising revenue in one year.
- Advertising revenue has increased by about 46% in two years, rising from $46.91 billion in 2023 to $68.64 billion in 2025.
- Q4 2025 was the largest advertising quarter of that year at $21.32 billion, up 23% year over year on a reported basis.
- Amazon’s advertising category includes sponsored advertising, display advertising, and video placements sold to sellers, vendors, publishers, authors, and other advertisers, giving the business revenue streams beyond marketplace merchant ads alone.
Amazon Web Services (AWS) Revenue
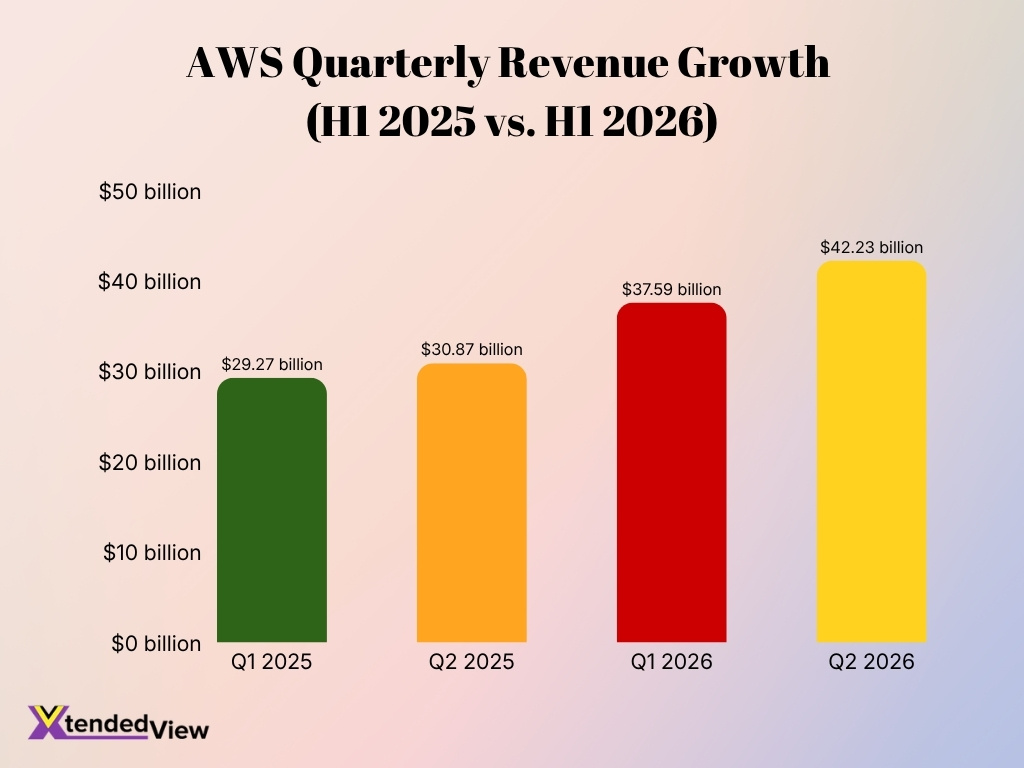
- AWS generated $42.23 billion in Q2 2026 revenue, up 37% from $30.87 billion in Q2 2025. This marked its fastest revenue growth rate in 18 quarters.
- AWS revenue reached $37.59 billion in Q1 2026, compared with $29.27 billion in Q1 2025, representing 28% year-over-year growth.
- AWS produced $128.73 billion in full-year 2025 sales, up approximately 20% from $107.56 billion in 2024.
- AWS operating income climbed to $16.62 billion in Q2 2026, 64% above the $10.16 billion reported one year earlier.
- The AWS operating margin reached 39.4% in Q2 2026, compared with 32.9% in Q2 2025. That 6.5-percentage-point expansion shows how cloud growth translated into higher segment profitability.
- AWS generated $30.78 billion in operating income during the first half of 2026, compared with $21.71 billion in the first half of 2025.
- By the end of Q2 2026, AWS had reached an annualized revenue run rate of approximately $169 billion, based on its quarterly sales level.
- Trailing-12-month AWS revenue reached $148.40 billion in Q2 2026, 28% higher year over year.
- Trailing-12-month AWS operating income rose to $54.68 billion, compared with $42.79 billion at the end of Q2 2025.
- AWS represented 18% of Amazon’s consolidated net sales in 2025, up from 17% in 2024, despite Amazon’s much larger retail operations.
Amazon Subscription Services Revenue
- Amazon generated $13.73 billion in subscription services revenue in Q2 2026, up 12% from $12.21 billion in Q2 2025.
- Subscription revenue reached $13.43 billion in Q1 2026, compared with $11.72 billion in Q1 2025, representing 15% reported growth.
- Subscription services produced $49.62 billion in full-year 2025 revenue, up from $44.37 billion in 2024.
- The annual increase between 2024 and 2025 amounted to approximately $5.25 billion, or 11.8%.
- Subscription revenue has expanded by 23.4% since 2023, rising from $40.21 billion to $49.62 billion over two years.
- Q4 2025 generated $13.12 billion in subscription sales, the highest quarterly total reported during 2025.
- Q3 2025 subscription revenue totaled $12.57 billion, compared with $11.28 billion in Q3 2024.
- Subscription services grew 12% year over year on a constant-currency basis in Q2 2026, maintaining a double-digit growth rate despite the business’s larger revenue base.
- The subscription category includes annual and monthly Prime membership fees as well as revenue from digital video, audiobooks, digital music, e-books and other non-AWS subscriptions, giving Amazon several recurring-revenue streams.
Amazon Mobile App Usage Statistics
- The Amazon Shopping app had more than 128 million monthly active U.S. users in March 2025, recovering after activity softened following the holiday shopping period.
- During Q2 2025, weekly active users regularly exceeded 105 million in the U.S., with engagement peaking above 109 million during the quarter.
- By Q3 2025, U.S. active users averaged about 98 million, with the quarterly peak reaching approximately 104 million.
- Amazon Shopping ended Q3 2025 with approximately 99.3 million U.S. weekly active users, nearly unchanged from 99.2 million at the beginning of the quarter.
- During the 2025 holiday quarter, U.S. active users surpassed 105 million in late November, highlighting the seasonal lift created by holiday shopping.
- On iOS alone, Amazon Shopping maintained an average of more than 65 million active U.S. users during Q4 2025.
- The Android version reached more than 36 million U.S. active users in late November 2025, while weekly downloads peaked at roughly 173,000 in early December.
- Current Android distribution exceeds 1 billion downloads, while the app has accumulated more than 4.6 million user reviews.
- Recent 2026 tracking estimated roughly 5 million worldwide Android downloads in one month, indicating that the mature app continues attracting substantial new installations.
- On iOS, Amazon Shopping has accumulated approximately 8.4 million ratings and maintains a 4.8-out-of-5 rating in the U.S. store.
Amazon’s Top International Markets by Net Sales
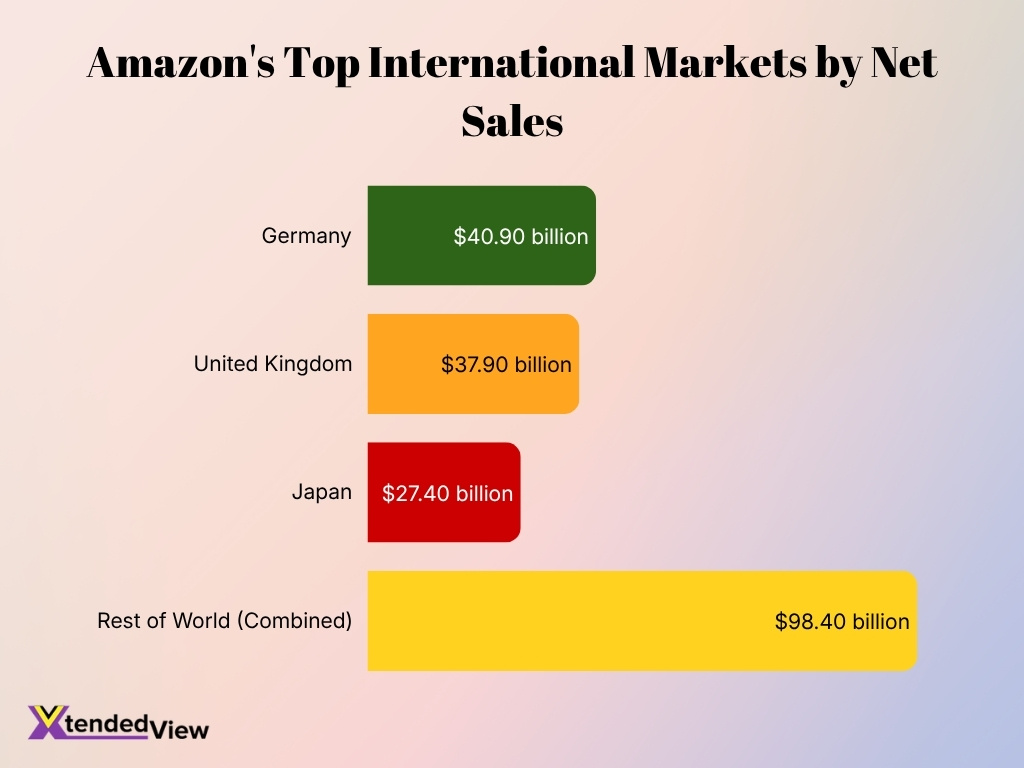
- Germany is Amazon’s largest individual international market in the dataset, generating $40.90 billion in annual net sales.
- The United Kingdom ranks second, contributing $37.90 billion, just $3 billion behind Germany.
- Japan represents another major international market for Amazon, with annual net sales reaching $27.40 billion.
- Combined, Germany, the UK, and Japan account for approximately $106.20 billion in Amazon net sales.
- The Rest of World category generates $98.40 billion, highlighting Amazon’s substantial revenue base across markets beyond its three leading international countries.
Amazon Logistics and Fulfillment Network
- Amazon delivered more than 13 billion items worldwide to Prime members on the same day or next day during 2025, setting its third consecutive annual delivery-speed record.
- U.S. Prime members received more than 8 billion same-day or next-day items in 2025, over 30% more than in the previous year.
- Same-Day Delivery now reaches more than 10,000 U.S. cities and towns, including a growing number of smaller and rural communities.
- Amazon committed more than $4 billion to expand its U.S. rural delivery network and plans to grow the network to more than 200 delivery stations by the end of 2026.
- Once completed, the rural expansion is expected to add capacity for more than 1 billion additional packages annually across over 13,000 ZIP codes covering 1.2 million square miles.
- The rural logistics investment could create more than 100,000 jobs and driving opportunities across facility, delivery and flexible-work roles.
- Amazon passed the milestone of 1 million robots deployed across its operations network in 2025, spanning more than 300 facilities worldwide.
- Its DeepFleet AI system is designed to improve robotic fleet travel efficiency by 10%, reducing congestion and shortening movement paths inside fulfillment facilities.
- Amazon Now expanded to dozens of U.S. cities in 2026, offering delivery of thousands of grocery and household products in about 30 minutes or less and targeting tens of millions more customers by year-end.
- In India, Amazon announced plans for more than 100 specialized Urban Fulfillment Centers in 2026, adding infrastructure that can offer four times the product selection previously available through its ultra-fast delivery service.
Frequently Asked Questions (FAQs)
Amazon generated $200.6 billion in net sales in Q2 2026, up 20% year over year from $167.7 billion.
AWS generated $42.2 billion in Q2 2026 revenue, up 37% year over year, and reached an annualized revenue run rate of about $169 billion.
Amazon generated $68.64 billion from advertising services in 2025, up from $56.21 billion in 2024, an increase of about 22.1%.
Amazon generated $172.16 billion from third-party seller services in 2025, compared with $156.15 billion in 2024, representing growth of about 10.3%.
Amazon delivered more than 13 billion items worldwide to Prime members on the same or next day in 2025, including more than 8 billion items in the U.S.
Conclusion
Amazon’s statistics show a company that now operates through several large, interconnected businesses rather than relying on online retail alone. AWS reached $42.23 billion in Q2 2026 revenue, International sales totaled $42.20 billion, and subscription services continued to post double-digit growth. At the same time, Amazon expanded same-day delivery, invested in rural logistics, increased automation across fulfillment centers, and strengthened its presence in international markets. Third-party sellers remain central to marketplace activity, while advertising has become another major source of high-growth revenue.
Prime membership, mobile engagement, and faster fulfillment also continue to deepen customer activity across Amazon’s ecosystem. Together, these figures show how Amazon is using commerce, cloud infrastructure, subscriptions, advertising, and logistics to support growth across multiple markets.
