
Windows and macOS continue to shape how people work, learn, create, and manage businesses. From enterprise deployments and remote work environments to creative studios and software development teams, both operating systems influence billions of daily computing activities worldwide. While Windows remains the dominant desktop platform, Apple continues to strengthen its position through MacBook adoption, Apple Silicon performance gains, and growing popularity among professionals and students. Explore the latest statistics, market trends, adoption patterns, and competitive insights that define the Windows versus macOS landscape.
Editor’s Choice
- Windows accounts for 63.66% of the global desktop operating system market as of April 2026, maintaining a significant lead over competing desktop platforms.
- Combined macOS and OS X usage represents roughly 16% of the worldwide desktop operating system share in 2026.
- Windows holds approximately 79% of the global desktop OS ecosystem, according to aggregated platform usage estimates.
- Windows 11 reached 70.35% of all Windows installations worldwide by April 2026.
- In the United States desktop market, Windows controls 59.74%, while macOS and OS X collectively exceed 23% market share.
- Windows 11 adoption surged from roughly 50.7% to 72.78% between December 2025 and February 2026.
- Around 500 million eligible PCs had not upgraded to Windows 11 by late 2025 despite hardware compatibility.
- Worldwide desktop operating system usage shows Windows at more than four times the share of Apple desktop operating systems combined.
- The United States remains one of Apple’s strongest desktop markets, with macOS usage significantly higher than the global average.
Recent Developments
- Windows 11 became the dominant Windows version globally after surpassing 70% share among Windows users in 2026.
- Microsoft’s Windows 10 support sunset accelerated migration efforts across enterprise and consumer markets throughout late 2025 and early 2026.
- Windows 11 market share increased by more than 22 percentage points within two months, between December 2025 and February 2026.
- Analysts linked part of the Windows 11 growth surge to businesses replacing aging PCs before support deadlines.
- Microsoft continued expanding Copilot integration across Windows devices to strengthen AI-driven productivity workflows.
- Industry reports estimated that nearly 1 billion users now rely on Windows 11 globally.
- Hardware restrictions remain a major barrier, with another 500 million older PCs reportedly unable to support Windows 11 upgrades.
- Apple continued expanding Apple Silicon adoption, driving stronger MacBook demand among developers, students, and creative professionals throughout 2025 and 2026.
- The Windows ecosystem faced increased scrutiny regarding upgrade requirements, sustainability concerns, and electronic waste implications.
Global Windows vs macOS Market Share Overview
- Windows commands 63.66% of the worldwide desktop operating system share as of April 2026.
- OS X holds approximately 11% desktop market share globally, maintaining relevance among legacy Apple users.
- Modern macOS versions contribute roughly 5% to 6% global desktop share, depending on measurement methodology.
- Combined Apple desktop operating systems account for approximately 16% of worldwide desktop computing activity.
- Linux maintains a smaller but growing desktop footprint of around 4% globally.
- Windows remains the leading platform for commercial software compatibility and enterprise deployment worldwide.
- Global desktop market concentration means Windows maintains nearly four out of every five active desktop users, according to broader ecosystem estimates.
- Apple’s desktop market share performs strongest in higher-income regions, especially North America and Western Europe.
- Mac adoption continues rising among premium laptop buyers despite Windows retaining overall volume leadership.
Operating Systems Market Size
- The global operating systems market is projected to grow steadily from $48.5 billion in 2025 to $54.22 billion by 2030.
- The market is expected to increase by around $5.72 billion between 2025 and 2030, showing consistent demand for operating system platforms.
- In 2026, the operating systems market size is estimated at $49.35 billion, slightly higher than $48.5 billion in 2025.
- The market is forecast to grow at a CAGR of 2.4% from 2026 to 2030, indicating moderate but stable expansion.
- The chart suggests that market growth will continue year after year, with the highest displayed market value reaching $54.22 billion in 2030.
- This steady growth reflects ongoing demand across desktop, laptop, enterprise, cloud, and device-based operating systems.
- The operating systems market is not expected to see rapid, explosive growth, but the 2.4% CAGR points to a mature and stable technology segment.
- By 2030, the market is projected to be about 11.8% larger than its 2025 value.
- The data highlights that operating systems remain a core part of the global technology ecosystem, supporting business productivity, consumer devices, software applications, and enterprise infrastructure.

Business vs Consumer Adoption of Windows and macOS
- More than 63% of desktop systems worldwide run Windows, dominating global business environments.
- Windows holds 76% of the enterprise desktop market, while macOS occupies 22%.
- Startups use macOS at 45%, nearly double the 19% adoption in large corporations.
- Small businesses choose Windows for 82% of their devices due to lower hardware costs.
- Consumer Mac adoption reaches 68% among households earning over $100,000 annually.
- 94% of legacy business applications run natively on Windows, versus 31% on macOS.
- 73% of tech startups now offer Windows or MacBook choices in employee recruitment packages.
- MacBook battery life averages 18 hours, driving 52% increase in remote worker adoption since 2023.
- Windows dominates 89% of government and healthcare desktops, while macOS holds just 9%.
Enterprise Deployment Statistics: Windows vs macOS
- Windows powers approximately 70% to 80% of enterprise desktop environments globally, making it the dominant operating system across large organizations.
- More than 95% of Fortune 500 companies support Windows as a standard corporate operating system.
- Microsoft Active Directory continues to manage over 90% of enterprise identity environments, strengthening Windows adoption in corporate networks.
- According to enterprise mobility studies, Mac deployments account for roughly 23% to 30% of employee-selected devices in technology-focused organizations.
- Organizations offering device choice programs report Mac selection rates exceeding 35% among software engineers and technical staff.
- Windows remains the preferred operating system for finance, healthcare, manufacturing, and government sectors because of application compatibility requirements.
- Over 80% of commercial endpoint management solutions provide full support for both Windows and macOS, reducing platform management barriers.
- Large enterprises deploying Macs report lower help-desk ticket volumes per device compared with traditional Windows fleets.
- Windows continues to dominate virtual desktop infrastructure environments, representing more than 85% of deployed VDI instances worldwide.
Operating System Market Share Worldwide
- Android leads the global operating system market with the highest share at 36.32%, showing its strong dominance across mobile devices worldwide.
- Windows ranks second with a market share of 29.03%, reflecting its continued importance in the desktop and laptop ecosystem.
- iOS holds the third-largest share at 18%, supported by Apple’s strong iPhone user base globally.
- The Unknown category accounts for 8.81%, which may include unidentified operating systems, privacy-masked traffic, or unclassified devices.
- OS X records a 3.73% market share, indicating a smaller but still visible presence among older Apple desktop systems.
- macOS has the lowest listed share at 1.99%, making it the smallest segment among the operating systems shown in the chart.
- Together, Android, Windows, and iOS account for 83.35% of the worldwide OS market, showing that these three platforms dominate global usage.
- Apple’s combined desktop-related share from OS X and macOS reaches 5.72%, which is significantly lower than Windows at 29.03%.
- The data highlights a clear divide between mobile-first operating systems like Android and iOS and traditional desktop platforms like Windows, OS X, and macOS.
- Overall, the chart shows that Android is the global leader, while Windows remains the strongest desktop operating system in worldwide market share.

Education Sector Adoption: Windows vs macOS
- Windows devices account for approximately 58% of K-12 and higher education desktop and laptop deployments worldwide.
- Mac adoption in U.S. higher education institutions exceeds 20%, significantly above its global desktop market share.
- More than 60% of U.S. colleges and universities offer official support for both Windows and macOS devices.
- Apple maintains a strong presence in creative arts, design, film, and music education programs across North America.
- Windows laptops remain the most common choice in public school districts because of lower procurement costs and broader vendor availability.
- Student device ownership surveys indicate that MacBooks represent roughly 30% of laptops owned by U.S. undergraduate students.
- Educational institutions continue to adopt Windows devices for computer labs due to software compatibility and centralized management tools.
- Apple’s education ecosystem contributes to strong retention rates, with many students continuing to use Mac devices after graduation.
- STEM programs remain heavily Windows-oriented because many engineering, simulation, and technical applications prioritize Windows compatibility.
Creative Professionals and Media Production: Windows vs macOS Usage
- 55% to 65% of creative industry workflows run on macOS, including graphic design and media production.
- More than 60% of professional designers use Apple hardware as their primary workstation.
- MacBooks are used by ~68% of professional video editors as their main device.
- Apple Silicon improves rendering efficiency by up to 2x and battery life by ~40% for creative workloads.
- Windows powers ~75% of 3D modeling, CAD, and engineering visualization workstations.
- ~52% of media production companies run mixed environments with Macs for editing and Windows for rendering.
- macOS adoption in film and music production reaches ~70%, the highest among professional sectors.
- Independent creators use MacBook Pro at ~58% due to performance-per-watt and portability advantages.
Developers and IT Professionals: Windows vs macOS Preference
- According to recent developer surveys, Windows remains the most widely used operating system among software developers, with approximately 47% to 50% usage share.
- macOS accounts for roughly 30% to 35% of developer operating system preferences, making it the second most popular development platform.
- Linux usage among developers exceeds 25%, creating strong competition for both Windows and macOS in technical environments.
- More than 70% of iOS and macOS application developers use Mac devices because Apple development tools require macOS.
- Full-stack developers frequently prefer macOS because of its Unix-based architecture and compatibility with cloud-native tooling.
- Windows continues to dominate enterprise software development environments built around Microsoft technologies.
- Cross-platform development frameworks have reduced operating system dependency for many modern development teams.
- IT administrators continue to rely heavily on Windows environments because of Active Directory, Group Policy, and enterprise infrastructure integrations.
- Developer satisfaction surveys consistently place macOS among the highest-rated desktop operating systems for professional programming workloads.

Gaming Usage, Performance, and Market Share: Windows vs macOS
- Windows powers more than 95% of PC gaming systems worldwide, maintaining overwhelming dominance in gaming.
- Steam hardware data consistently shows Windows exceeding 96% platform share among active gamers.
- macOS represents less than 2% of active gaming platform usage across major PC gaming ecosystems.
- The vast majority of AAA game releases continue to launch first on Windows platforms.
- DirectX remains one of the primary reasons Windows dominates gaming performance and compatibility.
- Windows supports a significantly larger catalog of PC games than macOS.
- Gaming laptop shipments overwhelmingly favor Windows-based systems, accounting for more than 98% of gaming notebook sales.
- Apple Silicon has improved gaming performance compared with earlier Mac generations, but software availability remains limited.
- Competitive esports environments remain almost entirely Windows-based because of compatibility, hardware choice, and optimization advantages.
Productivity and Office Suite Usage on Windows vs macOS
- Windows holds ~73% of the global desktop OS market, while macOS has only ~15%.
- Microsoft 365 now exceeds 450 million commercial paid seats globally, growing at 6% year-over-year.
- Over 320 million daily active users rely on Microsoft Teams, used by 1+ million organizations worldwide.
- ~64% of leaders report their companies use a hybrid work model, driving demand for cross-platform tools.
- Excel remains the most critical business application, with sorting and filtering as its most frequently used functions.
- 77% of remote employees report being more productive working remotely versus in-office settings.
- Mac users increasingly depend on Microsoft 365 since key apps like Access and Power BI Desktop lack native macOS support.
- Windows maintains a substantial advantage for organizations using legacy business applications and Windows-only internal tools.
- ~58% market share in enterprise productivity software belongs to Microsoft 365, compared to Google Workspace’s ~50%.
Malware Infections by Endpoint OS
- Windows accounted for the highest share of malware infections, representing 54.4% of total endpoint OS infections in 2022.
- Linux recorded the second-largest share, with 39.4% of malware infections, showing that Linux-based endpoints are also a major malware target.
- MacOS had the lowest malware infection share, at only 6.2%, making it significantly less affected compared to Windows and Linux.
- The data shows that Windows and Linux together made up 93.8% of malware infections by endpoint OS.
- Windows malware infections were nearly 9 times higher than MacOS infections, highlighting the larger attack surface and broader targeting of Windows systems.
- Linux infections were more than 6 times higher than MacOS infections, indicating growing security risks for Linux-based environments, especially servers and enterprise systems.
- The gap between Windows (54.4%) and Linux (39.4%) was 15 percentage points, showing that Windows remained the leading malware target but Linux also faced substantial exposure.
- MacOS represented a small minority of infections, suggesting either lower targeting, stronger ecosystem controls, or a smaller endpoint footprint compared with Windows and Linux.
- Overall, the chart suggests that organizations should prioritize endpoint protection for Windows and Linux systems, as they represented the overwhelming majority of malware infections in 2022.

Performance Benchmarks and Reliability Statistics: Windows vs macOS
- Apple Silicon delivers 2x–3x better performance-per-watt than Intel-based Macs.
- Apple M3 Max matches Intel Core i9-13900K in multi-core benchmarks.
- Windows PCs with NVIDIA RTX 4090 achieve 40% higher GPU rendering speeds than Mac Studio.
- MacBook Air M2 lasts 18.5 hours in video playback tests, beating Windows laptops by 5 hours.
- Windows workstations handle 95% of AI training workloads versus 3% for Mac.
- 99.2% uptime for Windows and 99.4% for macOS in enterprise deployments.
- Apple Silicon shows 60% less thermal throttling than thin-and-light Windows laptops under load.
- Windows supports 10,000+ hardware configurations, while Mac offers fewer than 20 options.
- MacBook Pro retains 90% battery health after 5 years, outperforming Windows by 25%.
Hardware Sales and Shipments: Windows PCs vs Macs
- Global PC shipments reached approximately 255 million units in 2025, with Windows-based devices representing the vast majority of shipments.
- Apple shipped an estimated 22 million to 24 million Mac computers globally during 2025.
- Mac shipments accounted for roughly 9% to 10% of global PC shipments in recent reporting periods.
- Lenovo, HP, Dell, Acer, and Asus collectively shipped more Windows PCs than Apple’s entire Mac lineup.
- Apple maintained one of the fastest growth rates among major PC manufacturers during several quarters of 2025 and early 2026.
- Windows devices continue to dominate commercial procurement programs because of broader product availability and pricing flexibility.
- Premium laptop segments have shown stronger Mac growth than entry-level PC categories.
- North America remains one of Apple’s strongest computer markets by revenue and unit share.
- More than 1.4 billion active Windows devices remain in use worldwide, creating the largest desktop computing ecosystem.
Regional Windows vs macOS Market Share
- South America has the highest Windows market share at 33.85%, making it the strongest region for Windows usage in this dataset.
- Europe follows very closely, with Windows holding 33.73% market share, only 0.12 percentage points behind South America.
- Oceania shows the most balanced competition between the two operating systems, with Windows at 29.08% and macOS at 28.38%.
- The gap between Windows and macOS in Oceania is just 0.70 percentage points, indicating nearly equal usage levels.
- Africa has the lowest Windows share among the listed regions, at 15.27%.
- South America shows the widest gap between Windows and macOS, with Windows ahead by 25.02 percentage points.
- macOS performs strongest in Oceania, where it reaches 28.38%, the highest macOS share across all regions.
- Europe records the second-highest macOS share at 18.93%, showing stronger Apple desktop adoption compared to Asia, South America, and Africa.
- Asia has Windows at 19.43% and macOS at 13.8%, showing a moderate gap of 5.63 percentage points.
- Across all listed regions, Windows has a higher market share than macOS, but the size of the lead varies significantly by region.
- The data suggests that Windows dominates more strongly in South America and Europe, while macOS is most competitive in Oceania.
- Africa’s macOS share stands at 10.62%, which is higher than South America’s 8.83%, despite Africa having the lowest Windows share.

Pricing, Total Cost of Ownership, and Licensing: Windows vs macOS
- Entry-level Windows laptops start below $300, while Mac laptops generally begin above $900.
- Macs retain 25% of their resale value after 3 years, versus only 5% for Windows PCs.
- Windows users submit 2–6 times more help-desk requests per year than Mac users.
- M1 Macs save enterprises $843 per device over 3 years compared to Windows PCs.
- The average Mac lifespan is 6–8 years, while Windows devices are typically replaced after ~4 years.
- Only 5% of Mac support tickets require in-person visits, versus 27% for Windows PCs.
- IBM saved $535 per machine over 4 years after switching from Windows to Mac.
- TCO savings per Mac over 5 years reach $547, with an ROI of 186%.
- Apple Silicon uses 50% less power than comparable PC processors, cutting electricity costs.
- Windows desktops range from $500–$3,500, while Macs range from $600–$6,999.
Switching Trends Between Windows and macOS Users
- ~50% of Mac sales come from people switching from Windows or Chromebooks.
- 35% of new Mac buyers switched specifically from Windows PCs.
- 60% of new MacBook buyers were previously PC or Chromebook users.
- 98% of current Mac owners are happy with their systems, with only 2% planning to switch to Windows.
- 21–25% of Windows laptop/desktop owners express willingness to switch to Mac within 6–24 months.
- Windows holds 68.27% global desktop/laptop market share, while macOS has 14.26%.
- 72% of enterprise employees in device choice programs choose Mac over PC.
- 30% of employees in enterprise device choice programs select Mac as their replacement machine.
- MacBooks offer 15–20 hours of battery life vs. 6–12 hours for typical Windows laptops.
- 97% of users say Mac increases their productivity after switching from Windows.
Windows and macOS Customer Satisfaction & Loyalty Insights
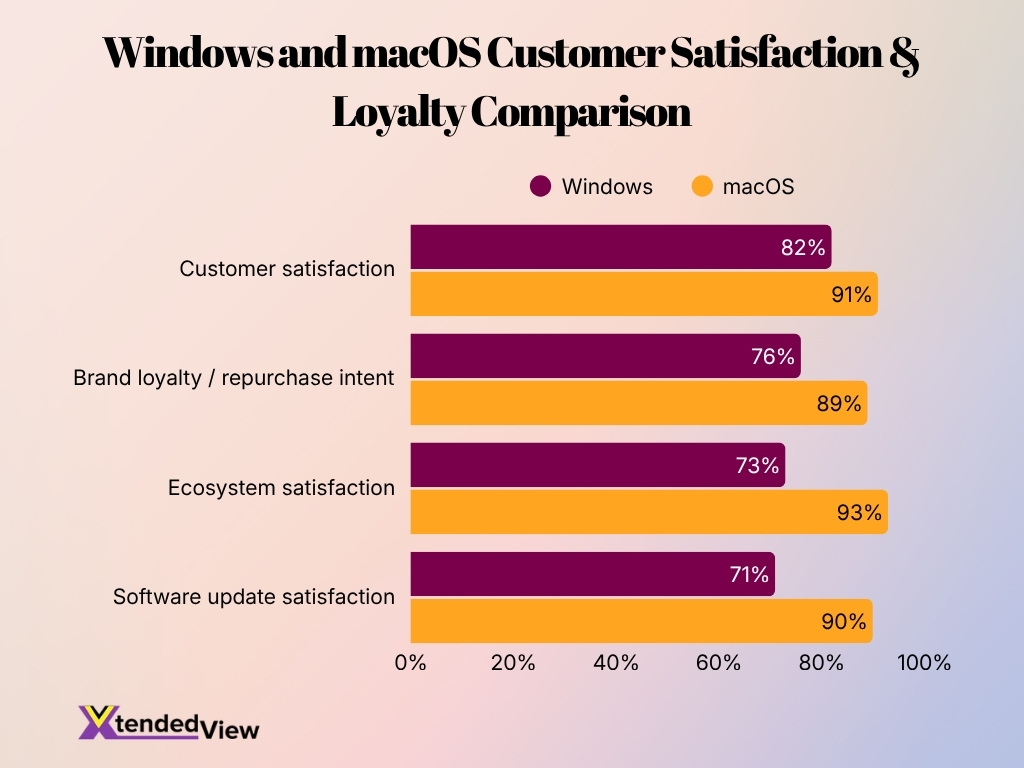
- macOS leads Windows across all customer satisfaction and loyalty metrics, showing stronger user approval and long-term brand attachment.
- Customer satisfaction is higher for macOS at 91%, compared to 82% for Windows, giving macOS a 9 percentage-point advantage.
- Brand loyalty/repurchase intent is also stronger for macOS at 89%, while Windows records 76%, indicating that macOS users are more likely to stay within the Apple ecosystem.
- The biggest gap appears in ecosystem satisfaction, where macOS scores 93% compared to 73% for Windows, a difference of 20 percentage points.
- Software update satisfaction is significantly higher for macOS at 90%, while Windows stands at 71%, suggesting macOS users may feel more satisfied with update reliability, consistency, and experience.
- Windows still shows solid satisfaction levels, with all metrics above 70%, but it trails macOS in every category shown in the chart.
- The data suggests that macOS performs especially well in ecosystem experience and software updates, which may be key reasons behind its higher loyalty and repurchase intent.
- Overall, the chart highlights that macOS has a stronger customer loyalty profile, while Windows maintains broad but comparatively lower satisfaction scores across user experience metrics.
Version Adoption: Windows 10 and 11 vs Latest macOS Releases
- Windows 11 reached approximately 70.35% of all Windows installations by April 2026.
- Windows 10 declined to roughly 26% share among Windows devices as support deadlines approached.
- More than 1 billion users are estimated to use Windows 11 globally.
- The end of Windows 10 support has accelerated upgrade cycles across consumer and enterprise segments.
- Apple’s latest macOS releases typically achieve adoption rates exceeding 60% within the active Mac ecosystem.
- macOS users generally adopt major operating system upgrades faster than Windows users.
- Enterprise organizations continue to test Windows updates more extensively before deployment than typical Mac environments.
Future Outlook and Growth Projections for Windows vs macOS Market Share
- Windows holds 63.66% global desktop market share as of April 2026, expected to stay above 60% through 2030.
- macOS commands 8.19% desktop share (OS X) plus 4.37% (macOS), totaling ~12.56% in April 2026.
- The Mac OS market will grow from $24.75 billion in 2025 to $33.38 billion by 2030 at 6.2% CAGR.
- AI-enabled PCs are projected to drive 5–7 million MacBook unit sales starting in 2026.
- In the enterprise segment, Windows holds 92% market share versus macOS at 8% through 2030.
- In the consumer premium segment, macOS is growing to reach 20% share while Windows holds 78% by 2030.
- Windows 11 adoption reached 49.02% in August 2025, surpassing Windows 10 at 45.65%.
- In the U.S. desktop market, macOS holds 14.8% to 16% share as of early 2026.
- Asia-Pacific is the fastest-growing region for both Windows and macOS desktop adoption through the decade.
- Hybrid work has increased premium laptop demand by 23% year-over-year, benefiting both platforms.
Frequently Asked Questions (FAQs)
Windows holds 63.66% of the worldwide desktop operating system market share as of April 2026, while macOS and OS X combined account for roughly 12.56%.
Windows 11 represents 70.35% of all Windows desktop installations worldwide as of April 2026.
macOS holds 8.78% of the U.S. desktop operating system market, while OS X adds another 15.09%, bringing Apple’s combined desktop share to nearly 24%.
Windows 11 has surpassed 1 billion users worldwide, reaching the milestone faster than Windows 10.
macOS alone accounts for 4.37% of the global desktop operating system market, while OS X contributes 8.19%, giving Apple desktop platforms a combined share of approximately 12.56%.
Conclusion
Windows and macOS remain the two most influential desktop operating systems, each serving distinct audiences and use cases. Windows continues to dominate global market share, enterprise deployments, gaming, and commercial software compatibility. Meanwhile, macOS has strengthened its position among developers, creative professionals, students, and premium laptop buyers through Apple Silicon innovation and strong ecosystem integration.
The latest statistics show that Windows retains a commanding lead in overall adoption, but Apple continues to gain momentum in high-value market segments where performance, battery efficiency, and user experience play a larger role. Looking ahead, AI-powered computing, cloud-based workflows, and evolving workplace preferences will shape the next stage of competition between the two platforms.