


iOS remains one of the world’s most influential mobile operating systems, powering millions of consumer and business workflows every day. From mobile banking and healthcare apps to retail, enterprise mobility, and digital payments, the platform continues to shape how people interact with technology. Apple’s growing device ecosystem, high user engagement, and strong app economy make iOS a key benchmark for developers, marketers, and business leaders. Explore the statistics below to understand how iOS is evolving.
Editor’s Choice
- Apple’s active installed base exceeded 2.5 billion devices in early 2026, marking another record for the company’s ecosystem.
- Around 66% of all active iPhones were running iOS 26 by February 2026, highlighting Apple’s fast software adoption compared to competing mobile platforms.
- iOS accounted for approximately 16.6% of the global operating system market across all connected devices during mid-2026.
- Apple continues to lead the premium smartphone segment, with roughly one in four active smartphones worldwide being an iPhone in 2025.
- More than 74% of iPhones released within the last four years had upgraded to iOS 26 by February 2026.
- The App Store continues to generate significantly higher consumer spending per user than competing mobile app marketplaces, reinforcing Apple’s premium ecosystem.
- Apple’s integrated hardware, software, and services strategy continues to support industry-leading customer retention, with independent research consistently estimating iPhone loyalty above 90% in major markets.
Recent Developments
- Apple released iOS 26 in September 2025 with expanded Apple Intelligence features, interface updates, and deeper cross-device integration.
- By February 2026, 66% of all active iPhones had already migrated to iOS 26, demonstrating continued rapid adoption.
- Apple reported that 74% of iPhones introduced during the previous four years were already using iOS 26.
- Counterpoint Research reported that Apple added more net new smartphone users in 2025 than the next seven leading smartphone brands combined, strengthening its installed base leadership.
- Apple expanded Apple Intelligence availability across additional languages and regions during 2026, increasing the practical value of newer iPhones.
- Regulatory changes in the European Union continued to reshape App Store policies, including broader support for alternative app marketplaces and payment options.
- Apple continued increasing iPhone manufacturing capacity outside China, with India becoming a larger production hub during 2025 and 2026.
- The latest iOS releases placed greater emphasis on privacy, including expanded permission controls, communication safety features, and on-device AI processing.
- Apple further strengthened ecosystem integration through updates across iPhone, iPad, Mac, Apple Watch, and Vision products, encouraging multi-device adoption.
iOS Statistics Overview
- iOS powers hundreds of millions of active iPhones worldwide, making it one of the two dominant smartphone operating systems globally.
- Apple surpassed 2.5 billion active devices across its ecosystem in early 2026.
- The company continues to generate over half of its total revenue from the iPhone, demonstrating the platform’s strategic importance.
- iOS consistently records one of the highest software update adoption rates among major consumer operating systems.
- Apple maintains one of the industry’s highest customer satisfaction and retention rates, with loyalty estimates remaining above 90% in several mature markets.
- Independent research indicates that roughly one-quarter of all active smartphones globally are iPhones.
- Apple’s ecosystem includes tightly integrated services such as iCloud, Apple Pay, Apple Music, Health, and Apple Intelligence, helping increase long-term user engagement.
- Premium smartphone buyers continue to choose iPhone at disproportionately high rates compared with the broader smartphone market.
- Apple’s focus on long-term software support allows many iPhones to receive operating system updates for five years or longer, exceeding the support lifecycle offered by many Android manufacturers.
Global iOS Market Share Trends (2022–2026)
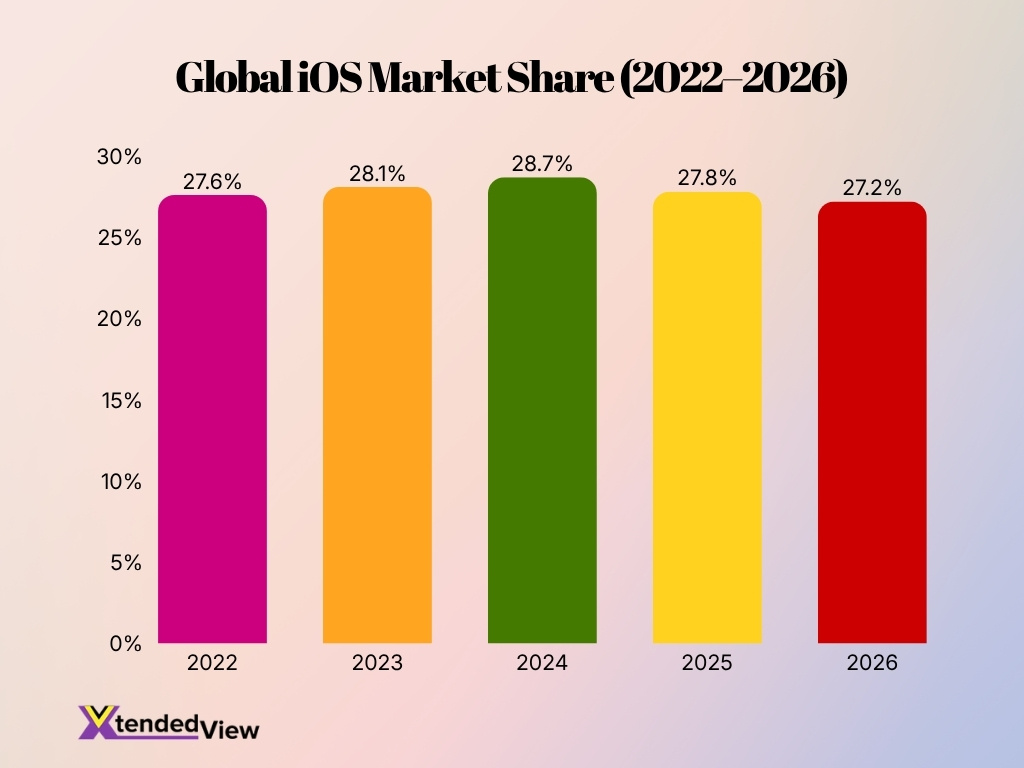
- Global iOS market share increased from 27.6% in 2022 to 28.7% in 2024, representing a 1.1 percentage point gain over two years.
- 2024 recorded the highest iOS market share in the five-year period at 28.7%.
- After peaking in 2024, iOS market share declined to 27.8% in 2025, a decrease of 0.9 percentage points year over year.
- In 2026, global iOS market share fell slightly further to 27.2%, marking the lowest level since 2022.
- Despite the recent decline, iOS maintained a market share of over 27% throughout the entire 2022–2026 period.
- The overall variation in iOS market share remained relatively small, fluctuating within a narrow range of 27.2% to 28.7%.
- Between 2022 and 2026, iOS market share recorded a modest net decline of 0.4 percentage points, indicating a largely stable global presence.
- The greatest annual improvement occurred between 2023 and 2024, when iOS market share increased from 28.1% to 28.7%.
- The combined decline from the 2024 peak (28.7%) to 2026 (27.2%) totaled 1.5 percentage points.
- The data suggests that while iOS experienced short-term fluctuations after 2024, it continued to hold a consistent share of roughly one-quarter of the global smartphone market.
iOS Market Share by Country and Region
- iOS currently commands a dominant 55% to 58% of the United States smartphone market.
- Japan stands out as a leading global market with its iOS market share reaching approximately 68%.
- Apple maintains strong adoption in affluent countries, securing roughly 60% in Canada and 52% in the United Kingdom.
- Android completely dominates India with a 92% share, leaving iOS at roughly 8% despite its recent premium growth.
- Apple holds roughly 14% to 18% of the Chinese smartphone market, navigating intense competition from domestic Android brands.
- United States iPhone users are 48% more likely to earn over $125,000 annually compared to their Android counterparts.
- South America remains heavily Android-reliant, with iOS capturing a modest 15.8% of the region’s total mobile market.
- The European region maintains a robust Apple presence, with iOS accounting for 34.1% of the overall mobile OS share.
- Apple firmly controls approximately 31.6% of the global mobile operating system market as of early 2026.
- Apple successfully shipped over 247.8 million iPhones worldwide throughout 2025 to sustain its global premium market position.
Number of iOS Users Worldwide
- There are currently over 1.56 billion active iPhone users globally as of 2025–2026.
- Apple’s total active installed base across all hardware officially surpassed 2.5 billion devices in early 2026.
- The iOS ecosystem rapidly expanded by adding 150 million new active devices between January 2025 and January 2026.
- Apple successfully captured 20% of all global smartphone shipments during 2025, drawing in millions of first-time users.
- An average iPhone user spends $140 annually on apps, which is more than double the $69 spent by Android users.
- The monthly app spending for iOS users averages an impressive $10.40, drastically outpacing Android’s $1.40 average.
- The iOS App Store generated a staggering $117 billion in revenue in 2025, maintaining a massive 2.4× revenue advantage over competitors.
- Apple currently earns approximately $44 in services revenue annually per active unit, making each iPhone a recurring-revenue anchor.
- The United States market remains a massive stronghold, accounting for approximately 150.7 million active iPhone users.
- Apple sustains an exceptional brand retention rate of 92 percent, ensuring reliable and long-term ecosystem growth.
Mobile Operating System Market Share Worldwide
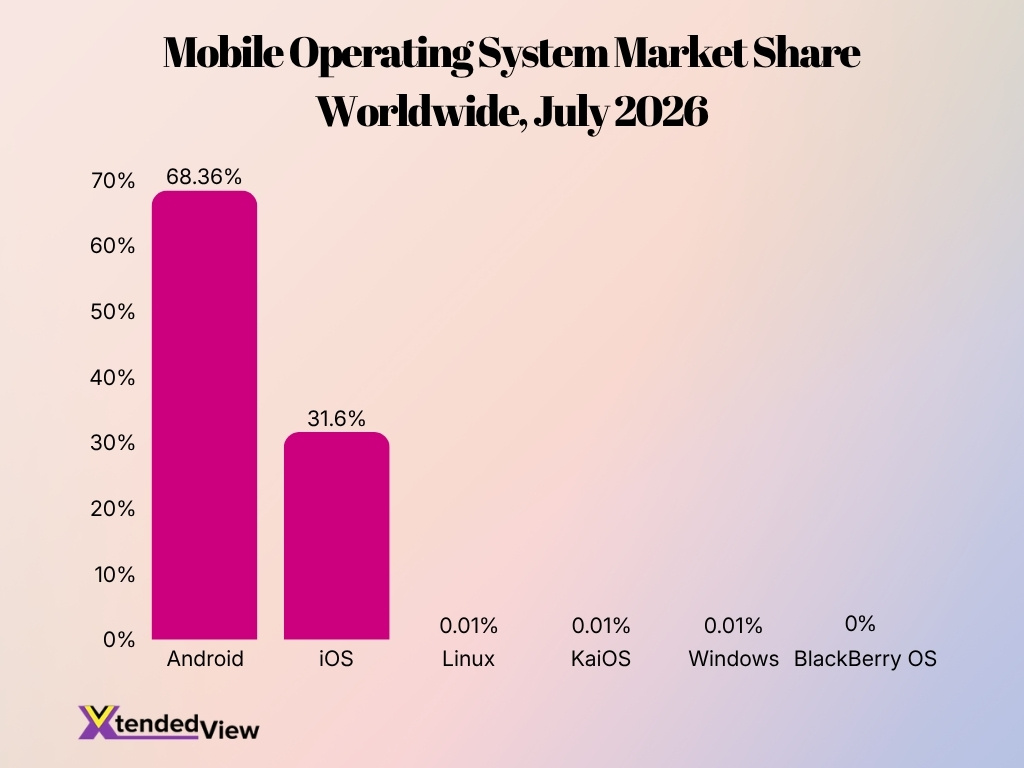
- Android remained the world’s leading mobile operating system with a 68.36% market share, accounting for more than two-thirds of the global mobile OS market.
- iOS ranked second with a 31.60% market share, giving Apple nearly one-third of the worldwide mobile operating system market.
- Combined, Android and iOS controlled 99.96% of the global mobile operating system market, leaving almost no room for competing platforms.
- Linux held just 0.01% of the global mobile OS market, highlighting its extremely limited presence on consumer mobile devices.
- KaiOS also accounted for only 0.01% of the worldwide market, reflecting its niche adoption in feature phones.
- Windows Mobile retained a negligible 0.01% market share, indicating that the platform is virtually absent from the current smartphone ecosystem.
- BlackBerry OS recorded a 0% market share, marking its complete disappearance from the global mobile operating system market.
- The data demonstrates a highly duopolistic market, with Android and iOS overwhelmingly dominating mobile operating systems worldwide.
- Android’s 68.36% share was approximately 2.2 times larger than iOS’s 31.60% share, reinforcing Google’s leadership in the global smartphone ecosystem.
- Alternative operating systems collectively represented only 0.04% of the market, underscoring the near-total dominance of the Android and iOS platforms.
Number of Active Apple Devices
- Apple reported an all-time high of 2.5 billion active devices worldwide during 2026.
- The global installed base expanded from 2.35 billion devices in the previous year.
- The company added roughly 150 million new active devices between 2025 and 2026.
- There are currently over 1.56 billion active iPhone users across the world.
- The United States accounts for approximately 150.7 million of those active iPhone users.
- The active iPhone installed base experienced a solid 8% year-over-year growth.
- Over 78% of the active iPhones currently in use support 5G connectivity.
- Each active iPhone user generates approximately $99 per year in recurring Services revenue.
- This massive device ecosystem drove an all-time Services revenue record of $30.01 billion in Q1 2026.
iPhone Installed Base and User Growth
- Apple now accounts for roughly one in every four active smartphones worldwide, according to installed-base research released in 2026.
- The global active smartphone installed base grew approximately 2% during 2025, with Apple contributing the largest increase among major smartphone brands.
- Apple added more net new active smartphone users during 2025 than the next seven largest smartphone manufacturers combined.
- Analysts estimate the worldwide iPhone installed base now exceeds 1.4 billion active users, continuing steady annual growth.
- Longer replacement cycles have increased the size of the active iPhone installed base even as annual smartphone shipments fluctuate.
- Apple’s high resale value helps older iPhones remain in active use for years, supporting long-term installed-base growth.
- Emerging markets, particularly India and Southeast Asia, continue contributing a growing share of first-time iPhone buyers.
- Customer loyalty remains one of Apple’s strongest competitive advantages, with independent studies consistently reporting retention rates above 90% in several mature markets.
- Apple’s integrated ecosystem of hardware, software, and services continues encouraging existing users to upgrade instead of switching platforms.
iOS Version Share Statistics
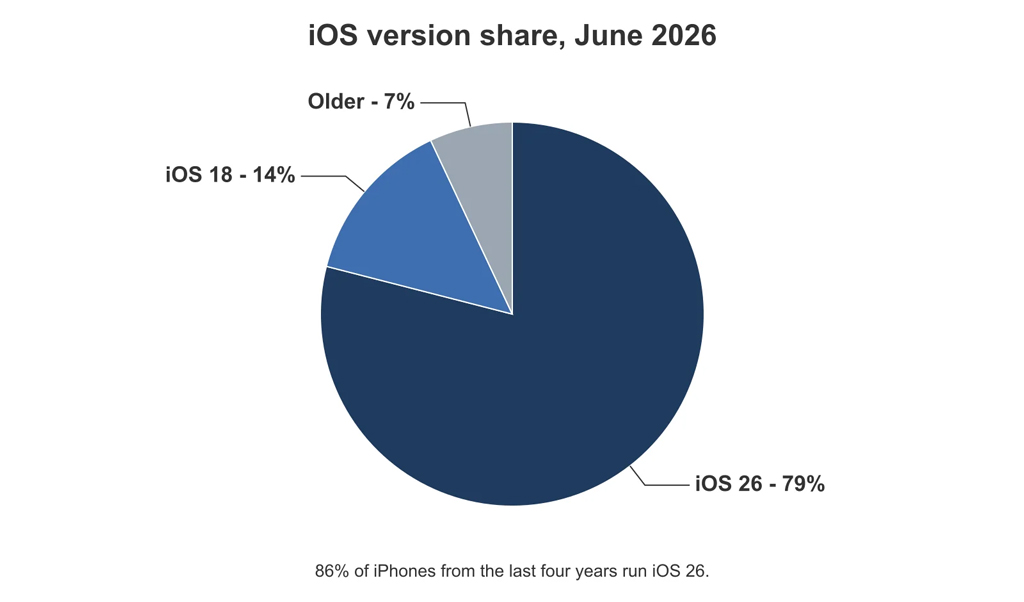
- iOS 26 dominates the market with a 79% share, making it the most widely used iOS version as of June 2026.
- iOS 18 accounts for 14% of the installed iPhone base, remaining the second most-used version.
- Older iOS versions collectively represent just 7% of all active iPhones, indicating limited usage of legacy software.
- Nearly 4 out of every 5 iPhones (79%) are already running iOS 26, highlighting Apple’s rapid software adoption.
- Only 21% of iPhones continue to use versions older than iOS 26, including iOS 18 and previous releases.
- Apple reports that 86% of iPhones released within the last four years have already upgraded to iOS 26, reflecting a strong adoption rate among newer devices.
- The relatively small 7% share for older versions suggests that most supported iPhones continue to receive and install the latest software updates.
- The gap of 65 percentage points between iOS 26 (79%) and iOS 18 (14%) demonstrates how quickly users migrate to Apple’s newest operating system.
- The distribution shows a highly consolidated ecosystem, with the latest iOS version powering the vast majority of active iPhones.
- The high adoption of iOS 26 helps developers prioritize support for the latest platform while reducing compatibility issues with outdated versions.
iOS Adoption Rate
- iOS 26 reached 66% adoption on all active iPhones within five months of its release.
- The operating system’s adoption increased to 79% across all active iPhones by June 2026.
- Among recently released iPhones, the adoption climbed from 74% to 86% by June 2026.
- Apple provides major iOS updates and security patches to supported iPhones for 5 to 7 years.
- There are currently over 1.56 billion active iPhone users worldwide adopting these frequent updates.
- The iOS platform maintains a dominant 29.25% market share in the global smartphone industry.
- The United States alone accounts for approximately 150.7 million active iPhone users.
- For historical context, iOS 18 successfully reached 88% adoption on newer iPhones within a similar timeframe.
iOS vs. Android Market Share
- Android leads the global market with approximately 71% of total smartphone shipments.
- Apple accounts for nearly 25% of all active smartphones globally.
- Apple secured a dominant 65% of premium smartphone sales in early 2026.
- Samsung captured just 19% of the premium smartphone segment in the same period.
- Premium smartphones priced above $600 made up 29% of total global sales.
- iOS users generate roughly 67% of all mobile app revenue worldwide.
- Android dominates emerging markets like India with over 95% of the user base.
- Apple leads the North American market with roughly 58% of all smartphone users.
iOS User Demographics
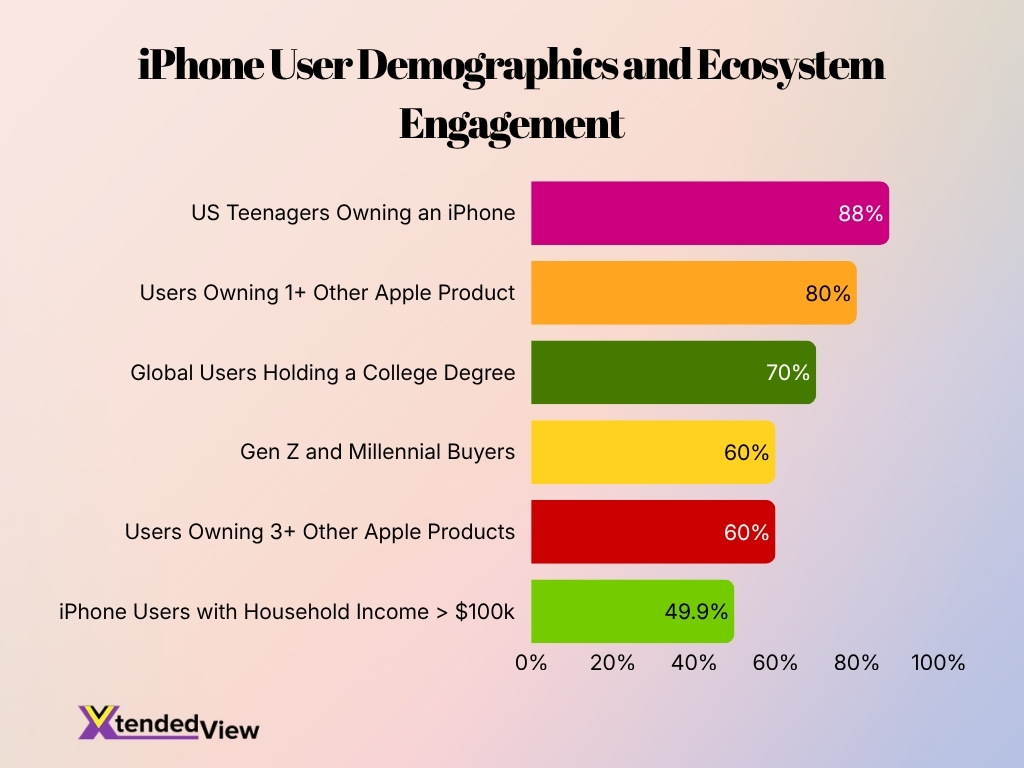
- Nearly 49.9% of iPhone users report a household income exceeding $100,000, highlighting strong purchasing power in developed markets.
- Roughly 60% of iPhone buyers belong to the Gen Z and Millennial demographics, with 88% of US teenagers owning the device.
- The iOS App Store attracts over 850 million average weekly users spanning across 175 countries and regions.
- Mobile app sales of physical goods and services accounted for $1.1 trillion in 2025, driven heavily by grocery and travel purchases.
- More than 40 of the top 100 apps on the App Store feature consumer-facing AI integrations, driving four times higher billing growth.
- Approximately 80% of iPhone users own at least one other Apple product, while nearly 60% own three or more ecosystem devices.
- Apple consistently maintains a dominant iPhone retention rate of 92%, showcasing one of the highest brand loyalty scores globally.
- Around 70% of the global iPhone customer base holds a college degree, representing a highly educated demographic of professionals.
- The active global iPhone user base surpassed 1.56 billion users in 2025, fueled significantly by rapid expansion across emerging markets.
iPhone Sales and Revenue
- Apple generated a record June-quarter iPhone revenue of $54.3 billion in 2026, representing 22% year-over-year growth.
- During Apple’s holiday quarter, iPhone revenue reached $85.3 billion, accounting for approximately 59% of total company revenue.
- Apple achieved record iPhone upgrader numbers across every geographic segment during 2026.
- The iPhone continues generating more than half of Apple’s total revenue, making it the company’s largest business segment.
- Apple captured a record 49% of global smartphone revenue during the second quarter of 2026 despite shipping fewer units than Android collectively.
- Counterpoint Research estimated Apple’s smartphone shipment share at 20% during Q2 2026, second only to Samsung.
- Premium pricing continues allowing Apple to generate significantly higher revenue per smartphone than most competitors.
- Services attached to iPhone ownership, including subscriptions and digital purchases, continue increasing lifetime customer value.
- Continued demand for flagship models and strong upgrade cycles supported Apple’s record financial performance throughout 2026.
Apple App Store Statistics
- The App Store facilitated over $1.4 trillion in developer billings and sales during 2025.
- The overall ecosystem size has nearly tripled in growth since 2019.
- More than 90% of all billings and sales generated no commission for Apple.
- AI-enabled apps recorded 4× faster billing growth than other leading applications.
- More than 40 of the top 100 apps featured consumer-facing AI capabilities.
- The App Store continues operating across 175+ countries and regions globally.
- Sales of physical goods and services accounted for $1.1 trillion of the total economic activity.
- Developer billings for digital goods and services totaled $149 billion.
- In-app advertising revenue reached $151 billion during the year.
- The platform saw over 850 million average weekly users.
iOS App Categories Statistics
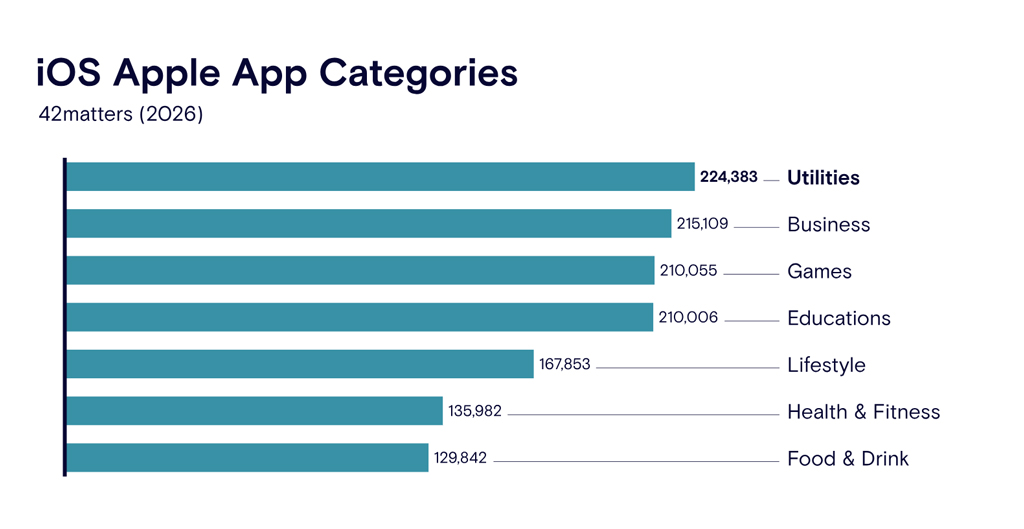
- Utilities is the largest iOS app category with 224,383 apps, making it the most populated category on the Apple App Store in 2026.
- Business ranks second with 215,109 apps, highlighting strong demand for productivity and enterprise-related applications.
- Games holds the third position with 210,055 apps, remaining one of the most competitive categories on the App Store.
- Education closely follows with 210,006 apps, trailing the Games category by only 49 apps.
- The top four categories, Utilities, Business, Games, and Education, each feature more than 210,000 apps, demonstrating a highly competitive app ecosystem.
- Lifestyle ranks fifth with 167,853 apps, significantly below the four leading categories but still representing a substantial share of available apps.
- Health & Fitness includes 135,982 apps, reflecting continued investment in wellness, exercise, and health-tracking applications.
- Food & Drink is the smallest category among those listed, with 129,842 apps available on the Apple App Store.
- The gap between the largest category (Utilities, 224,383 apps) and the smallest category (Food & Drink, 129,842 apps) is 94,541 apps.
- The data indicates that utility, business, gaming, and education remain the dominant focus areas for iOS app developers in 2026.
iOS App Downloads and Consumer Spending
- Global mobile app consumer spending reached approximately $155.8 billion in 2025, an increase of 21.6% from the previous year despite lower download volumes.
- Global app downloads across major mobile platforms totaled 106.9 billion in 2025, marking the fifth consecutive annual decline in downloads.
- Apple’s App Store ecosystem facilitated more than $1.4 trillion in developer billings and sales during 2025.
- Sales of physical goods and services generated approximately $1.1 trillion of App Store ecosystem commerce in 2025.
- Digital goods and services, including games, subscriptions, and enterprise software, accounted for $149 billion in App Store ecosystem billings during 2025.
- In-app advertising generated another $151 billion in App Store ecosystem revenue during 2025.
- Subscription-based apps remained one of the fastest-growing monetization models, contributing significantly to higher consumer spending despite slower download growth.
- AI-powered consumer apps experienced 4× faster billing growth than other leading App Store apps during 2025.
- Productivity, finance, health, streaming, and AI applications continued attracting higher average consumer spending than many traditional app categories.
Apple App Store Developer Earnings
- Developers selling digital goods and services through the App Store have earned more than $550 billion since the platform launched in 2008.
- During 2025, the App Store ecosystem enabled over $1.4 trillion in total developer billings and sales worldwide.
- More than 90% of App Store billings and sales generated no commission for Apple because they involved physical goods, services, or qualifying transactions.
- The App Store ecosystem has nearly tripled in size since 2019, creating additional earning opportunities for developers.
- More than 850 million average weekly users visited the App Store across 175 countries and regions during 2025, expanding developer reach.
- AI-enabled applications ranked among the fastest-growing revenue categories for developers in 2025.
- Games, enterprise software, and video streaming apps remained among the largest contributors to digital goods and services revenue.
- Apple continues providing developers with detailed analytics covering purchases, paying users, downloads, and revenue attribution to improve business performance.
- Continued growth in subscriptions, AI services, and premium applications is expected to support further developer earnings throughout 2026.
Why Businesses Choose iPhones
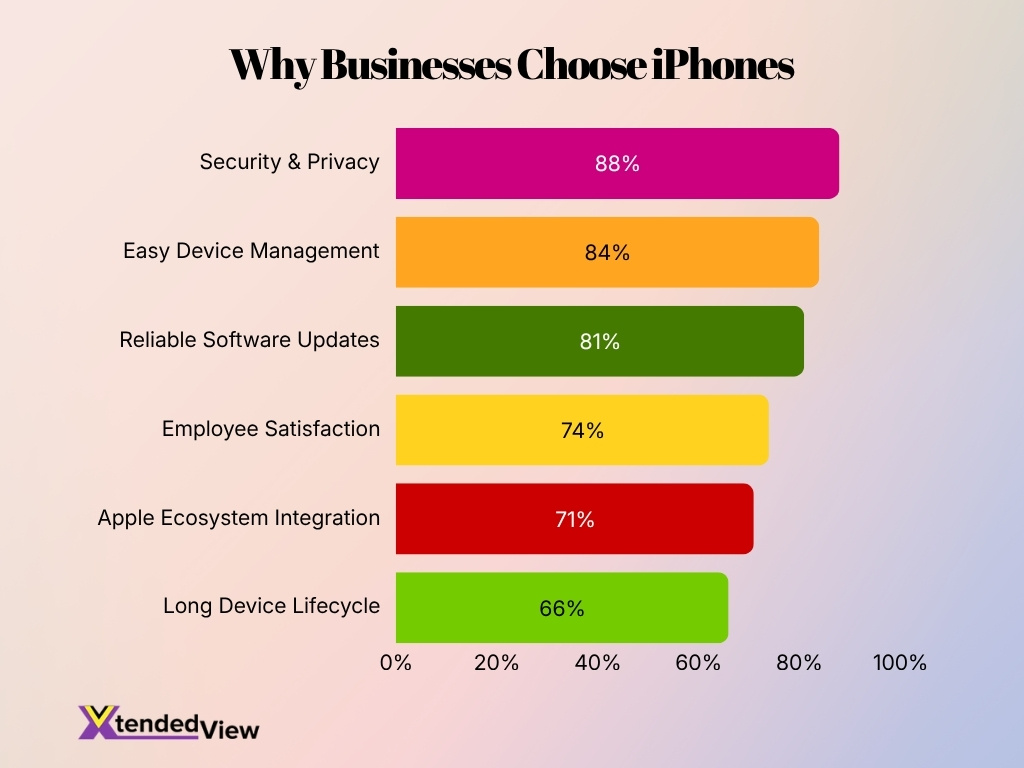
- Security & Privacy is the leading reason organizations choose iPhones, with 88% citing it as their primary factor.
- 84% of businesses value easy device management, highlighting the importance of streamlined IT administration.
- Reliable software updates influence 81% of organizations, reflecting Apple’s reputation for long-term software support.
- 74% of companies report that employee satisfaction is a key benefit of deploying iPhones in the workplace.
- 71% of organizations choose iPhones because of Apple ecosystem integration, enabling seamless connectivity across Apple devices and services.
- A long device lifecycle is important to 66% of businesses, helping reduce hardware replacement costs and improve return on investment.
- The top three decision factors, security & privacy (88%), device management (84%), and software updates (81%), all exceed 80%, indicating that IT and operational priorities drive enterprise iPhone adoption.
- Every listed reason is supported by at least 66% of organizations, demonstrating consistently strong confidence in iPhones across multiple business needs.
- The data suggests that organizations prioritize security, manageability, reliability, and employee experience when selecting smartphones for enterprise use.
- Overall, the findings show that iPhones remain a preferred enterprise device because they combine strong security, simplified management, dependable updates, and long-term value.
iOS Privacy and Security Statistics
- Apple prevented more than $2.2 billion in potentially fraudulent App Store transactions during 2025.
- Over the past six years, Apple has blocked more than $11.2 billion in fraudulent App Store transactions.
- Apple rejected more than 2 million app submissions during 2025 for failing to meet quality, privacy, or security standards.
- The company terminated approximately 193,000 developer accounts over fraud concerns during 2025.
- Apple also rejected more than 138,000 developer enrollment attempts because of suspected fraudulent activity.
- App Store analytics reports use privacy-enhancing techniques, including aggregation and statistical thresholding, to help protect user identities.
- Standard analytics reports intentionally omit fields that could directly identify individual users, reinforcing Apple’s privacy-first approach.
- iOS continues emphasizing on-device processing, permission controls, privacy labels, and App Privacy Reports to improve transparency around app data collection.
- Apple’s ongoing investments in fraud prevention, app review, and privacy technologies continue strengthening user trust across the iOS ecosystem.
Frequently Asked Questions (FAQs)
Apple’s active installed base surpassed 2.5 billion devices worldwide in 2026.
As of June 2026, 79% of all active iPhones and 86% of iPhones released in the last four years were running iOS 26.
The App Store ecosystem facilitated more than $1.4 trillion in developer billings and sales during 2025.
Apple accounts for about 25% of the global active smartphone installed base, or roughly one in every four active smartphones.
By June 2026, 86% of iPhones introduced within the previous four years had upgraded to iOS 26.
Conclusion
iOS continues to strengthen its position as one of the world’s leading mobile operating systems through steady user growth, rapid software adoption, and a highly engaged ecosystem. Apple achieved major milestones in active devices, App Store commerce, developer earnings, enterprise adoption, and privacy protection, reinforcing the long-term value of its integrated hardware and software strategy. The platform also continues to attract premium smartphone users, drive higher consumer spending, and support one of the most profitable mobile app ecosystems globally.
As Apple expands AI capabilities, enhances security features, and grows its services portfolio, iOS is expected to remain a key driver of innovation across consumer technology, enterprise mobility, and the global app economy in the years ahead.
