


Software as a service continues to reshape how businesses buy, deploy and manage software. Organizations now rely on SaaS across sales, finance, cybersecurity, collaboration, health care, retail and customer support, while AI-powered applications are changing how teams automate work and pay for software. At the same time, usage-based pricing, decentralized purchasing and expanding application portfolios are creating new cost and governance challenges. The statistics below show how SaaS market growth, adoption, spending, retention, security and AI integration are evolving.
Editor’s Choice
- Median SaaS spending reached $9,455 per employee in the 2026 SaaS management benchmark, showing how substantial subscription costs have become inside modern organizations.
- AI-native SaaS spending increased 108% year over year across organizations in the 2026 benchmark.
- Among enterprises with more than 10,000 employees, spending on AI-native applications jumped 393% year over year.
- Business units controlled 81% of SaaS spending in the 2026 benchmark, while IT directly managed only 15%.
- Organizations left an average 36% of SaaS licenses unused relative to recommended utilization levels, creating a significant source of avoidable spending.
- Expense-based SaaS spending climbed 267% year over year, reflecting the growing role of employee-led software and AI purchasing.
- By the end of 2026, 40% of enterprise applications are forecast to contain task-specific AI agents, compared with less than 5% in 2025.
Recent Developments
- In 2026, 78% of IT leaders surveyed reported unexpected charges linked to consumption-based or AI-oriented software pricing during the previous 12 months.
- Moreover, 61% of IT leaders said unexpected SaaS cost increases forced their organizations to cut projects.
- Large enterprises now add an average of 21 applications per month, even though total application portfolios appear relatively flat year over year.
- In 2025, AI-native application spending had already risen 75.2% year over year, showing that the acceleration began before 2026.
- Nearly 90% of IT leaders in the 2025 benchmark expressed concern about security risks associated with AI tools.
- By 2026, organizations deploy an average of 27 AI-powered SaaS applications, including AI-native products and intelligent feature add-ons.
- AI companies represented 42% of the aggregate value of a major 2025 private cloud-company benchmark, double their 21% share in 2024.
- Global AI software spending is forecast to reach $453.21 billion in 2026, up from $282.90 billion in 2025.
SaaS Market Size and Growth Statistics
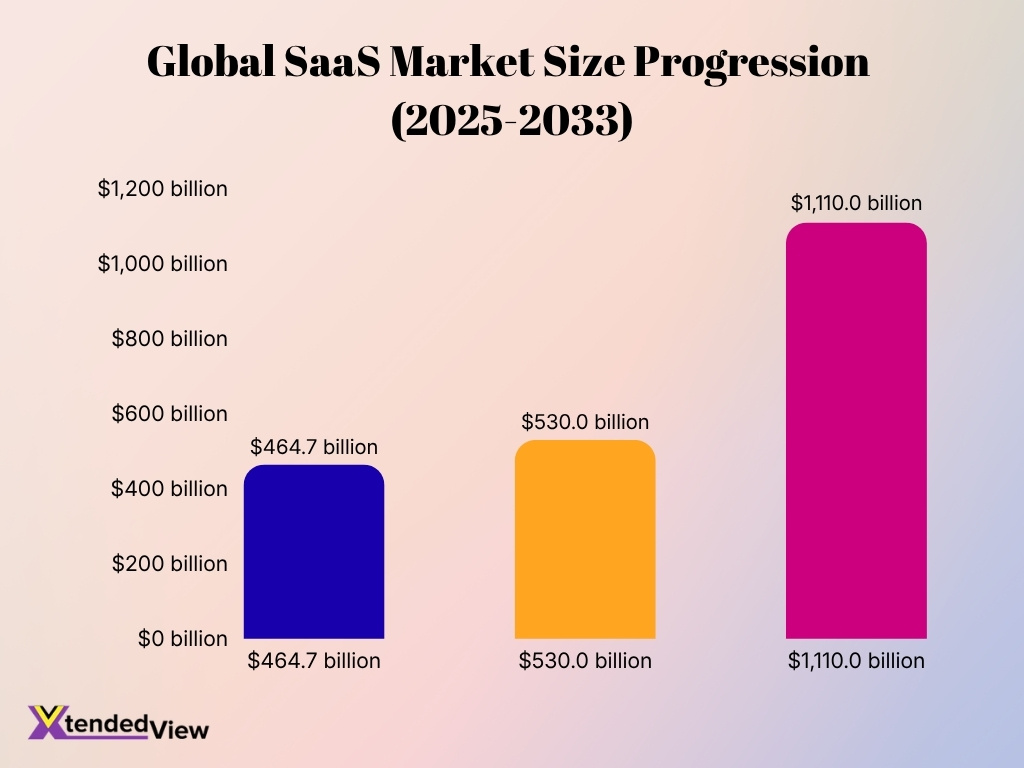
- One current market model estimates the global SaaS market at $530 billion in 2026, compared with $464.7 billion in 2025.
- Under the same forecast, global SaaS revenue could reach $1.11 trillion by 2033.
- That forecast implies an 11.1% compound annual growth rate between 2026 and 2033.
- Another 2026 market analysis forecasts SaaS growing from $375.57 billion in 2026 to $1.48 trillion in 2034. Differences between estimates largely reflect methodology and market scope.
- The latter projection corresponds to an 18.7% CAGR during its 2026-2034 forecast period.
- North America held 44.1% of SaaS revenue in 2025 under one market definition, supported by mature cloud adoption and a dense concentration of software vendors.
- Large enterprises accounted for 57.9% of SaaS market revenue in 2025 in the same analysis.
- Software accounted for more than 85.7% of SaaS market revenue by component in 2025, with services representing the remainder.
- Content, collaboration and communication SaaS is forecast to record a 17.9%+ CAGR from 2026 to 2033, making it one of the faster-growing application categories in that forecast.
SaaS Revenue and Spending Statistics
- Average SaaS spending stood at $4,830 per employee in 2025, an increase of 21.9% year over year in a benchmark covering more than 40 million licenses.
- That implies the comparable prior-year level was roughly $3,960 per employee, based on the reported 21.9% increase.
- Organizations wasted an average of $21 million annually on unused SaaS licenses in the 2025 benchmark, 14.2% more than the previous year.
- Small organizations with 1 to 500 employees spent an average $11.5 million annually on SaaS in the 2025 dataset.
- Enterprises with more than 10,000 employees spent an average $284 million annually on SaaS in that same benchmark.
- In 2025, 66.5% of IT leaders reported unexpected SaaS charges associated with consumption-based or AI pricing.
- The comparable measure rose to 78% in the 2026 study, signaling increased budget uncertainty as usage-based pricing spread.
- India’s SaaS public cloud spending is forecast to increase 18.9% in 2026, from $3.90 billion in 2025 to $4.64 billion.
- Australia’s SaaS spending is forecast to reach A$16.38 billion in 2026, up 13.8% from A$14.39 billion in 2025.
- For additional context, global spending on AI overall is forecast at $2.59 trillion in 2026, 47% higher year over year, increasing pressure on software vendors to embed AI into cloud products.
SaaS Adoption and Usage Statistics
- Companies managed an average of 106 SaaS applications in 2025 in one survey of about 600 IT professionals.
- The corresponding figure was 112 applications in 2023, meaning the average portfolio had fallen by about 5.4% by 2025 as companies consolidated software.
- However, the direction changed again in 2026, with application portfolios expanding as organizations added an average of 27 AI-powered SaaS apps.
- In 2025, 95% of surveyed companies said they had already invested in AI use cases, showing that AI software had moved beyond a niche adoption pattern.
- Almost 60% of IT teams still worried somewhat or significantly about shadow IT in the 2025 survey.
- The average IT staffing ratio reached approximately one IT employee for every 108 workers in 2025, increasing pressure to automate SaaS administration.
- More than half of surveyed organizations cited budget pressure and underused applications or licenses as factors driving SaaS consolidation or spending reductions in 2025.
- In 2026, business departments controlled 81% of SaaS spend, up from 70% reported in the 2025 benchmark, highlighting continued decentralization of application purchasing.
- Large enterprises with more than 10,000 employees used an average of 660 SaaS applications in the 2025 benchmark, compared with 152 apps among organizations with 1 to 500 employees.
SaaS Companies by Industry Statistics
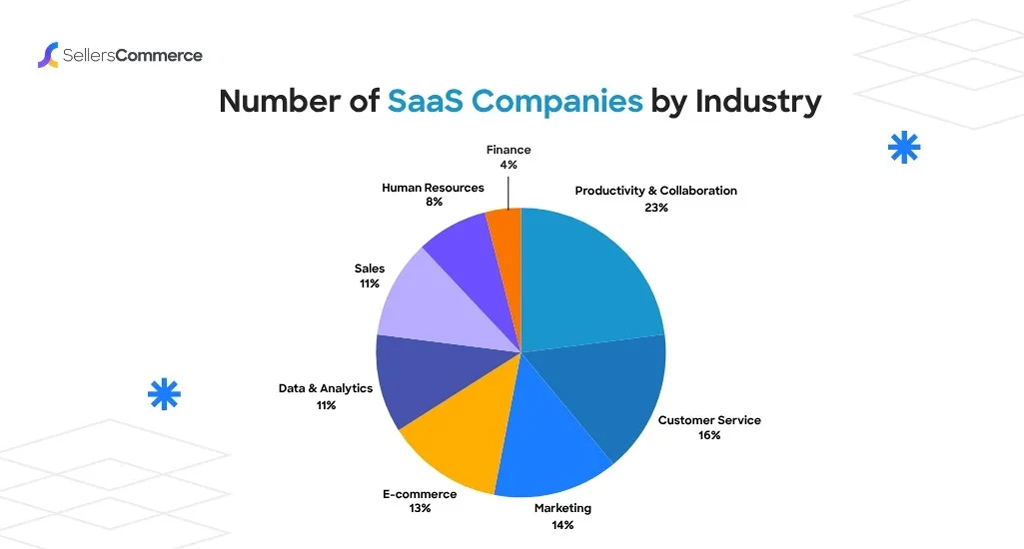
- Productivity and collaboration is the largest SaaS category, accounting for 23% of companies in the industry.
- Customer service SaaS ranks second with a 16% share, highlighting strong demand for digital customer support solutions.
- Marketing software represents 14% of SaaS companies, making it the third-largest segment.
- E-commerce SaaS accounts for 13% of companies, reflecting the importance of software platforms in online retail operations.
- Data and analytics and sales solutions each hold an 11% share of SaaS companies.
- Human resources SaaS represents 8% of the industry, covering areas such as recruitment, payroll and workforce management.
- Finance SaaS has the smallest share at 4%, compared with 23% for the leading productivity and collaboration segment.
- Combined, productivity and collaboration, customer service, and marketing account for 53% of SaaS companies across the industries shown.
B2B SaaS Statistics
- Private B2B SaaS companies recorded a 22% median growth rate in the 2026 benchmark, down from 25% in the previous comparable survey.
- Bootstrapped B2B SaaS businesses posted 20% median growth, compared with 25% for equity-backed companies.
- Only 7.3% of surveyed private SaaS companies reported flat or negative growth in 2025, compared with 6.9% in the previous year.
- Among bootstrapped companies with $3 million to $20 million in annual recurring revenue, median net revenue retention reached 103% in 2026.
- Median gross revenue retention for that same bootstrapped group reached 91%.
- The top 10% of bootstrapped companies achieved approximately 117.9% net revenue retention, well above the 103% median.
- Moving from 90%-100% net revenue retention to the 100%-110% range corresponded with a 5-percentage-point improvement in median growth.
- Companies in the highest net revenue retention group recorded median growth 173% above the overall population median, highlighting the importance of expansion revenue.
- In a separate 2025 private B2B SaaS benchmark, net revenue retention stood at 101%, showing that expansion only narrowly offset churn for the typical surveyed company.
- Expansion from existing customers generated 40% of total new annual recurring revenue in that benchmark, up 5 percentage points year over year.
B2C SaaS Statistics
- In the 2026 subscription benchmark, only 28% of annual-plan subscribers remained after one year, down from 31% for the previous cohort.
- Median 12-month retention for monthly subscriptions declined from 10% to 8%, showing how difficult long-term B2C retention remains.
- Weekly plans retained only 1.2% of subscribers after one year, compared with 1.7% in the prior cohort.
- North American subscription apps achieved a median Day-35 download-to-paid conversion rate of 2.56%, versus 1.37% in India and Southeast Asia.
- The top 10% of North American apps reached 11.3% download-to-paid conversion, showing a wide gap between median and leading products.
- Health and fitness apps recorded a 2.9% median download-to-paid rate, nearly three times Gaming’s 1.0%.
- Business subscription apps achieved a 9.1% median download-to-trial rate, more than twice Gaming’s 4.4%.
- Hard-paywall apps converted approximately 10.7% of downloads to paid subscriptions, versus 2.1% for freemium products.
- AI-powered apps generated $30.16 in median first-year realized lifetime value per payer, 41% more than the $21.37 recorded by non-AI apps.
- However, AI subscription apps retained only 21.1% of annual subscribers after 12 months, versus 30.7% among non-AI apps, indicating stronger monetization but weaker retention.
SaaS Pricing Statistics
- In a January 2025 survey of 100 SaaS companies, 85% had adopted usage-based pricing in at least part of their business model.
- Larger SaaS businesses increasingly incorporate variable revenue: 40% of companies above $50 million in annual recurring revenue included consumption or outcome-based revenue in ARR calculations.
- By comparison, only around 20%-27% of smaller SaaS companies incorporated consumption or outcome revenue into annual recurring revenue.
- Hybrid models combining subscriptions with variable pricing produced the highest net revenue retention among pricing approaches measured in a 2025 SaaS benchmark.
- Outcome-based pricing generated the highest year-over-year growth rate among the subscription, consumption, outcome and hybrid models evaluated in the same study.
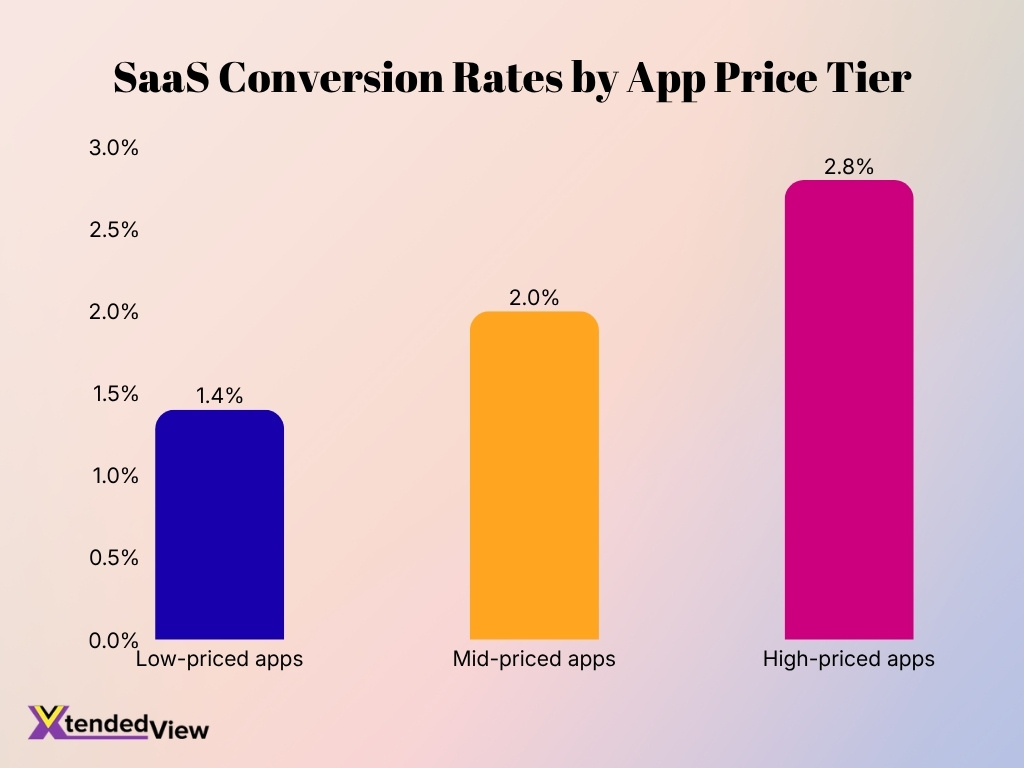
- High-priced consumer subscription apps posted a 2.8% median download-to-paid rate, twice the 1.4% achieved by low-priced products.
- Mid-priced subscription apps converted 2.0% of downloads to paid subscriptions, placing them between low-priced and high-priced offerings.
- The upper quartile of high-priced apps exceeded 6.1% download-to-paid conversion, compared with 3.7% among low-priced apps.
- Median trial conversion climbed from 4.4% for low-priced apps to 8.9% for high-priced apps, indicating that higher prices can coexist with stronger conversion when product value and targeting align.
- AI subscription apps rely heavily on monthly billing: 59.8% of AI subscriptions use monthly plans, compared with 26.2% for non-AI apps.
SaaS Customer Acquisition and Retention Statistics
- The median new-customer CAC ratio reached $2 of sales and marketing spending for every $1 of new customer ARR in the 2025 B2B benchmark.
- That new-customer CAC ratio increased 14% year over year, indicating that acquiring new SaaS customers became more expensive.
- Lower-performing companies spent a median $2.82 to acquire each $1 of new customer ARR, substantially above the industry midpoint.
- Median CAC payback periods increased 12.5% between 2022 and 2024, reflecting weaker acquisition efficiency.
- Existing customers generated 40% of total new ARR in the latest benchmark, making expansion an increasingly important alternative to new-logo acquisition.
- For SaaS businesses with $50 million to $100 million in ARR, expansion contributed a median 58% of total new ARR.
- Among companies above $100 million in ARR, expansion reached 67% of total new ARR in the surveyed cohort, although that subgroup contained relatively few companies.
- Gross revenue retention across private SaaS companies slipped from 90% to 88% over a three-year period in one industry benchmark.
- In a separate 2025 SaaS study, median net revenue retention ranged from 100% for sub-$1 million companies to 101% for businesses above $50 million ARR.
- Companies with $5 million to $20 million in ARR reached 103% median NRR, while upper-quartile businesses in that group achieved 115%.
SaaS Churn Rate Statistics
- Bootstrapped B2B SaaS companies with $3 million to $20 million in ARR posted 91% median gross revenue retention in 2026, implying roughly 9% annual revenue loss before expansion.
- Their median net revenue retention reached 103%, meaning upsells and expansions more than offset the revenue lost through churn and contraction.
- In the 2025 broader SaaS benchmark, gross revenue retention declined to 88%, compared with 90% several years earlier.
- Annual gross retention among companies with less than $1 million in ARR had a 92% median, while the upper quartile reached 100%.
- Companies with $1 million to $5 million in ARR also recorded 92% median gross retention, with the upper quartile at 95%.
- For companies with $5 million to $20 million in ARR, median gross retention fell to 88%, while the upper quartile achieved 95%.
- B2C annual subscription retention reached only 28% after one year in the latest measured cohort, compared with 31% previously.
- Monthly consumer subscriptions retained just 8% of subscribers after 12 months, down from 10% in the prior cohort.
- AI subscription apps showed particularly high long-term churn, retaining 6.1% of monthly subscribers at 12 months versus 9.5% among non-AI products.
- Refunds also ran higher for AI subscription products, with a 4.2% median refund rate compared with 3.5% for non-AI apps.
Cloud and SaaS Security Incident Trends
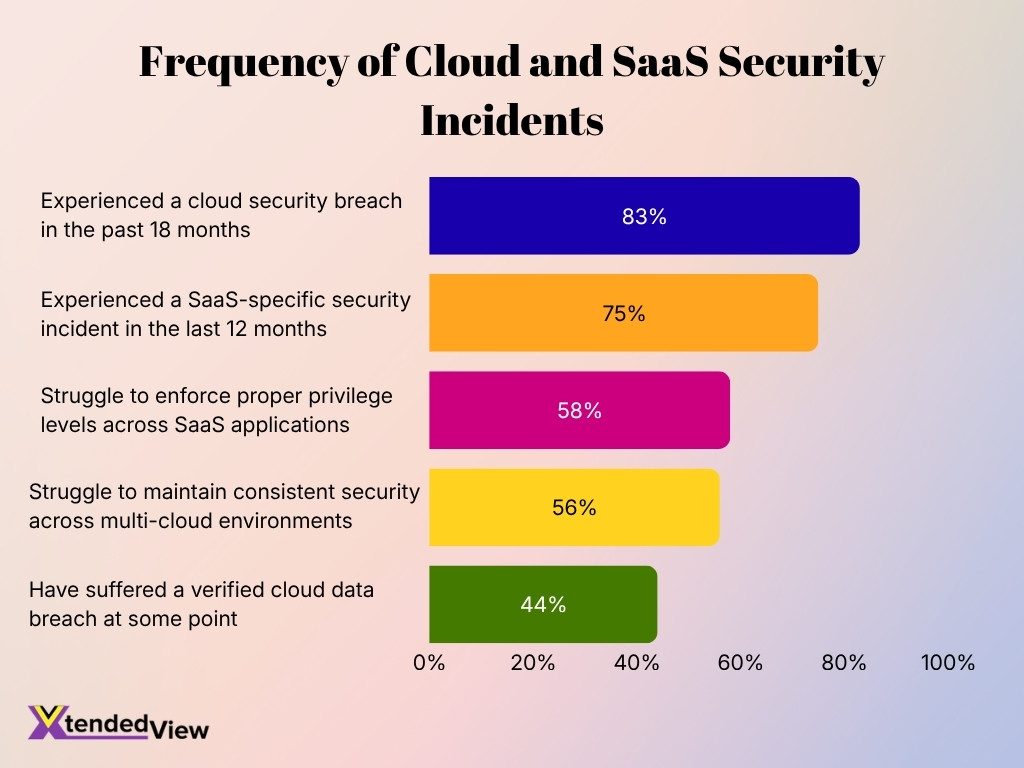
- Cloud security breaches are widespread, with 83% of organizations reporting a breach within the past 18 months.
- SaaS-specific security incidents affected 75% of organizations in the last 12 months, highlighting the growing exposure of cloud-based applications.
- Privilege management remains a major challenge, as 58% of organizations struggle to enforce appropriate access levels across SaaS applications.
- Maintaining consistent multi-cloud security is difficult for 56% of organizations, indicating persistent gaps across complex cloud environments.
- More than 4 in 10 organizations (44%) have experienced a verified cloud data breach at some point, underscoring the long-term prevalence of cloud security risks.
Shadow IT and SaaS Sprawl Statistics
- The average organization’s SaaS portfolio increased 11% year over year in 2026, reversing two years of software consolidation.
- Companies now deploy an average of 27 AI-powered SaaS applications, representing roughly 22% of their total application portfolios.
- Midmarket organizations experienced particularly rapid growth, with average application counts jumping 41% from 116 to 164 in a single year.
- Only 56% of applications in use in 2026 had IT approval, leaving nearly 44% outside formal IT sanctioning.
- An average company adds nine new unique SaaS applications each month, or roughly 103 applications over one year.
- Enterprises with more than 10,000 employees add around 21 applications per month, equivalent to approximately 257 new apps annually before removals and consolidation.
- The average SaaS environment in that benchmark contained 305 applications, meaning annual inflow could equal about 34% of the portfolio.
- In 2025, almost 60% of IT teams remained concerned about shadow IT, despite efforts to centralize application governance.
- Another 2025 security study found that 55% of employees adopted SaaS without security-team involvement, limiting oversight of new applications and integrations.
- Shadow SaaS also creates data exposure risks: 56% of organizations reported employees uploading sensitive information into unauthorized SaaS applications, while 63% reported external data oversharing.
SaaS License Management Statistics
- Organizations used only 54% of provisioned SaaS licenses in the 2026 benchmark, leaving a substantial portion of paid seats unused or underused.
- Unused and underutilized SaaS licenses translated into approximately $19.8 million in annual waste for the average organization.
- Large enterprises recorded an unused-license rate of roughly 43% in 2026, showing that license inefficiency remains significant even in organizations with mature procurement teams.
- Maintaining an accurate software inventory ranked as the top software asset management responsibility for 78% of IT asset teams in 2026.
- Among advanced software asset management programs, reclaiming unused software jumped from 59% in 2025 to 79% in 2026, a 20-percentage-point increase.
- Tracking software licenses in public cloud environments increased from 62% to 75% among advanced organizations year over year.
- Advanced teams tracking license usage in containers increased from 38% to 49%, reflecting the expanding scope of software license management.
- Optimization based on software use rights increased from 51% to 59% among advanced teams in 2026.
- In one 2025-2026 benchmark of Indian SMBs, companies without structured renewal management experienced an average 30% price increase at renewal.
- In that same SMB dataset, 34% of purchased video-conferencing seats sat dormant, illustrating how category-level license audits can uncover hidden waste.
AI SaaS Automation Performance Impact
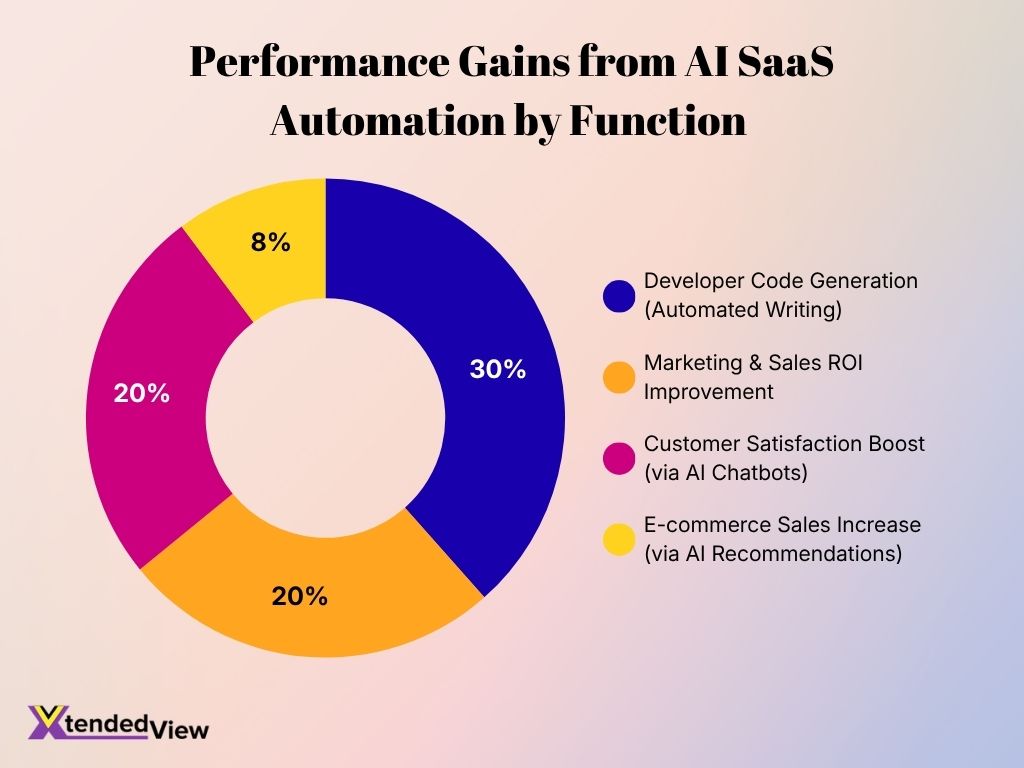
- Developer code generation delivers the strongest measurable impact, with AI automating or improving roughly 30% of coding-related work.
- Marketing and sales teams see an estimated 20% improvement in ROI through AI-powered SaaS automation.
- AI chatbots contribute to a 20% boost in customer satisfaction, highlighting their growing role in automated customer service.
- E-commerce businesses achieve an approximately 8% increase in sales through AI-powered product recommendations.
- Overall, the data shows that AI SaaS automation delivers the largest gains in software development, while also producing measurable improvements across marketing, customer service and e-commerce.
SaaS Management Platform Statistics
- 86% of IT leaders consider SaaS management platforms crucial for effective AI governance.
- Automation of IT operations is the top near-term priority for 29% of IT leaders.
- 19% of IT leaders rank improving SaaS security as their primary focus.
- Only 4% of organizations prioritize standalone AI governance over operational tooling.
- Security and governance is the top SaaS challenge for 47% of IT leaders, up from 28%.
- Manual work prevents 62% of IT leaders from dedicating time to strategic projects.
- Only one in four organizations currently automate employee offboarding.
- Just 9.8% of workflows utilize dedicated software asset management tools.
- 47.5% of software-tracking teams continue to rely on manual spreadsheets.
- 75.4% of tracking teams value identifying reclaimable licenses as a critical capability.
SaaS Statistics by Region
- North America generated $205.2 billion in SaaS revenue in 2025 under one current market methodology.
- The North American SaaS market is estimated to reach $232.6 billion in 2026, representing an increase of about $27.4 billion in one year.
- North American SaaS revenue is projected to reach $465.8 billion by 2033, representing a 10.4% CAGR from 2026.
- Asia-Pacific SaaS revenue reached $102.8 billion in 2025 and is estimated at $119.8 billion for 2026 under the same methodology.
- Asia-Pacific SaaS revenue is forecast to grow at a 13.3% CAGR through 2033, faster than the projected North American rate.
- Another market methodology places Europe at $70.81 billion in 2026, compared with $60.04 billion in 2025.
- Under that methodology, Asia Pacific rises from $69.43 billion in 2025 to $86.06 billion in 2026, representing approximately 24% year-over-year growth.
- India’s SaaS public-cloud spending is forecast to reach $4.64 billion in 2026, up 18.9% from $3.90 billion in 2025.
- Australian organizations are forecast to spend A$16.38 billion on SaaS in 2026, up 13.8% from A$14.39 billion in 2025.
- India is expected to post the highest SaaS CAGR in Asia Pacific through 2033, while Mexico is expected to record the fastest growth within North America.
SaaS Statistics by Company Size
- Organizations with 1 to 500 employees averaged 162 SaaS applications in the 2026 benchmark.
- Companies with 501 to 2,500 employees averaged 263 applications, about 62% more than the smallest company segment.
- Organizations with 2,501 to 10,000 employees averaged 408 SaaS applications, illustrating how portfolios expand with headcount and functional complexity.
- Enterprises with more than 10,000 employees averaged 696 SaaS applications, more than four times the portfolio size of organizations with 500 or fewer workers.
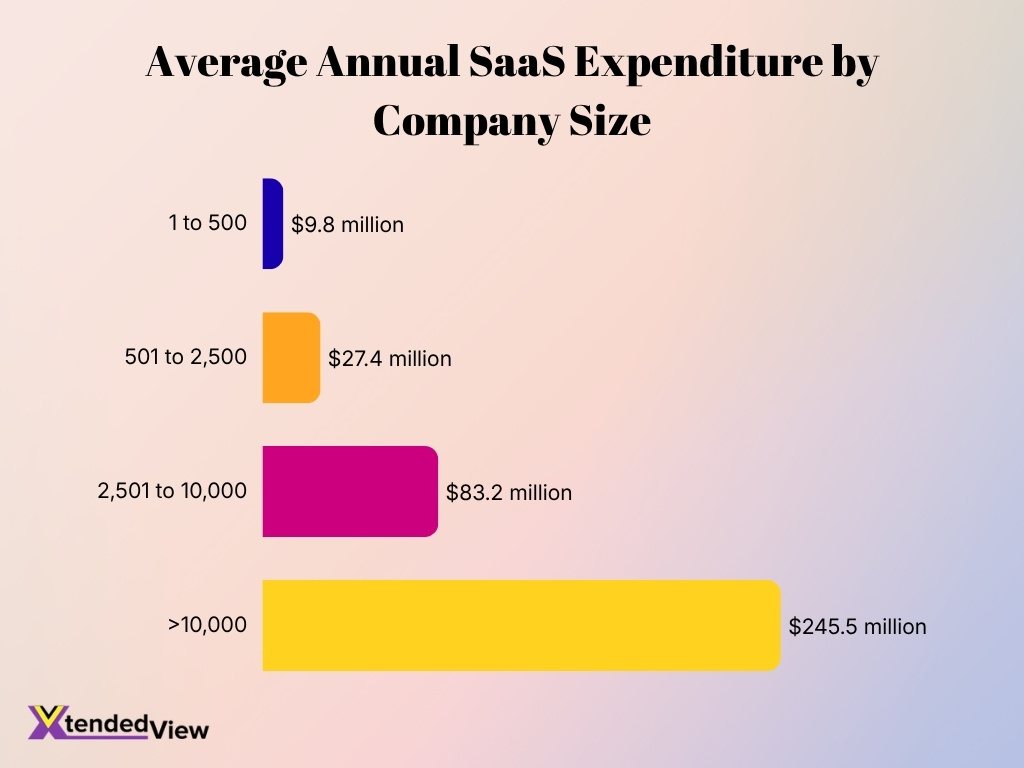
- Annual SaaS spending averaged $9.8 million among organizations with 1 to 500 employees.
- Organizations with 501 to 2,500 employees spent an average $27.4 million per year on SaaS.
- Companies with 2,501 to 10,000 employees averaged $83.2 million in annual SaaS spending, more than triple the spending of the preceding company-size band.
- Enterprises with more than 10,000 employees averaged $245.5 million annually, or roughly $20.5 million per month, on SaaS.
- Dedicated software asset management tool adoption rose from 6.2% among SMB trackers to 9.6% among midmarket organizations in one 2026 survey.
- Enterprise adoption of dedicated software asset management tools reached 21.4%, more than three times the rate among SMBs.
SaaS Trends and Future Predictions
- The global SaaS market is forecast to reach $1.11 trillion by 2033 under one 2026 market model, more than doubling from its estimated 2026 level.
- Another current forecast places the market at $1.48 trillion by 2034, reflecting a broader market definition and an 18.7% projected CAGR.
- Up to $234 billion in enterprise application SaaS spending could face agentic-AI substitution pressure between 2026 and 2030.
- That exposed spending could represent roughly 20% of enterprise application SaaS expenditure by 2030, as AI agents complete tasks across several systems without requiring direct user interaction with each application.
- Content, collaboration and communication SaaS is forecast to expand at more than 17.9% annually from 2026 through 2033, making it one of the fastest-growing application segments.
- Asia Pacific’s SaaS market is forecast to reach $287.7 billion by 2033, up from $102.8 billion in 2025.
- AI software visibility remains limited in 2026, with only 31% of organizations reporting visibility into AI software across their IT estates.
- 59% of organizations reported that wasted AI software spending increased year over year, suggesting AI cost optimization will become a larger component of SaaS management.
- Tracking or adopting new AI applications ranked as a challenge for 84% of IT asset management respondents, making AI governance one of the leading operational concerns in 2026.
- Negotiating SaaS contract terms increased by 14 percentage points year over year as a software asset management responsibility, signaling growing attention to pricing, renewals and consumption-based contracts.
Frequently Asked Questions (FAQs)
The global SaaS market is estimated at $530 billion in 2026, up from $464.7 billion in 2025.
The global SaaS market is projected to grow at an 11.1% CAGR from 2026 to 2033, reaching about $1.11 trillion.
North America accounted for 44.1% of global SaaS revenue in 2025, making it the largest regional market.
Organizations deploy an average of 27 AI-powered SaaS applications, representing roughly 22% of their application portfolios.
By the end of 2026, 40% of enterprise applications are forecast to integrate task-specific AI agents, up from less than 5% in 2025.
Conclusion
The SaaS market continues to expand, but the factors driving growth are changing quickly. AI adoption, usage-based pricing, decentralized software purchasing and rising application counts are reshaping how organizations evaluate software value. At the same time, unused licenses, shadow IT, weak visibility and security gaps are placing more pressure on IT and finance teams to manage SaaS more carefully.
Looking ahead, companies will need to focus less on simply adding software and more on utilization, automation, governance and measurable business outcomes. Organizations that connect SaaS spending with actual usage, retention, security and productivity will be better positioned to control costs while benefiting from the next phase of cloud software growth.
