


The competition between iPhone and Android continues to shape the global smartphone industry. Businesses rely on these platforms to build mobile apps, deliver digital payments, and power enterprise mobility, while consumers use them for communication, entertainment, shopping, and productivity. As AI features, premium devices, and regional preferences influence buying decisions, the gap between the two ecosystems continues to evolve. Explore the statistics below to understand how iPhone and Android compare across market share, users, and sales performance.
Editor’s Choice
- Android powers 68.0% of the global mobile operating system market as of May 2026, while iOS accounts for 31.94%, maintaining Android’s lead in worldwide device usage.
- Apple held 21.0% of worldwide smartphone shipments during Q1 2026, making it the second-largest smartphone vendor globally.
- Samsung shipped 62.4 million smartphones in Q1 2026, narrowly ahead of Apple’s 61.8 million units.
- Global smartphone shipments reached 293.8 million units in Q1 2026, representing a 2.9% year-over-year decline.
- Apple’s global smartphone shipments increased 4.4% year over year in Q1 2026 despite a broader market slowdown.
- Consumers spent $167 billion on in-app purchases during 2025, with non-gaming apps generating more revenue than games for the first time.
- Apple achieved a record 9% smartphone shipment share in India during 2025, highlighting one of its fastest-growing markets.
Recent Developments
- IDC reported that worldwide smartphone shipments declined 2.9% year over year in Q1 2026 because of memory supply shortages and rising component costs.
- Apple recorded 4.4% shipment growth in Q1 2026, outperforming the overall smartphone market.
- Samsung reclaimed the top vendor position with 21.2% global shipment share in Q1 2026, while Apple closely followed at 21.0%.
- IDC forecasts worldwide smartphone shipments to decline 13.9% during 2026 because of memory shortages and higher production costs.
- IDC projects iOS to reach a record 22% annual shipment share in 2026 despite the overall market slowdown.
- Counterpoint Research estimated Apple captured a record 20% global shipment share during Q2 2026 while overall shipments fell 11% year over year.
- Global smartphone average selling prices are projected to reach $550 in 2026 as manufacturers shift toward premium devices.
- In China, Apple’s smartphone shipments increased 24.4% year over year during Q2 2026 despite a declining market.
- Huawei and Apple were the only major smartphone vendors to post shipment growth in China’s Q2 2026 market.
iPhone vs Android Mobile Market Share Trends
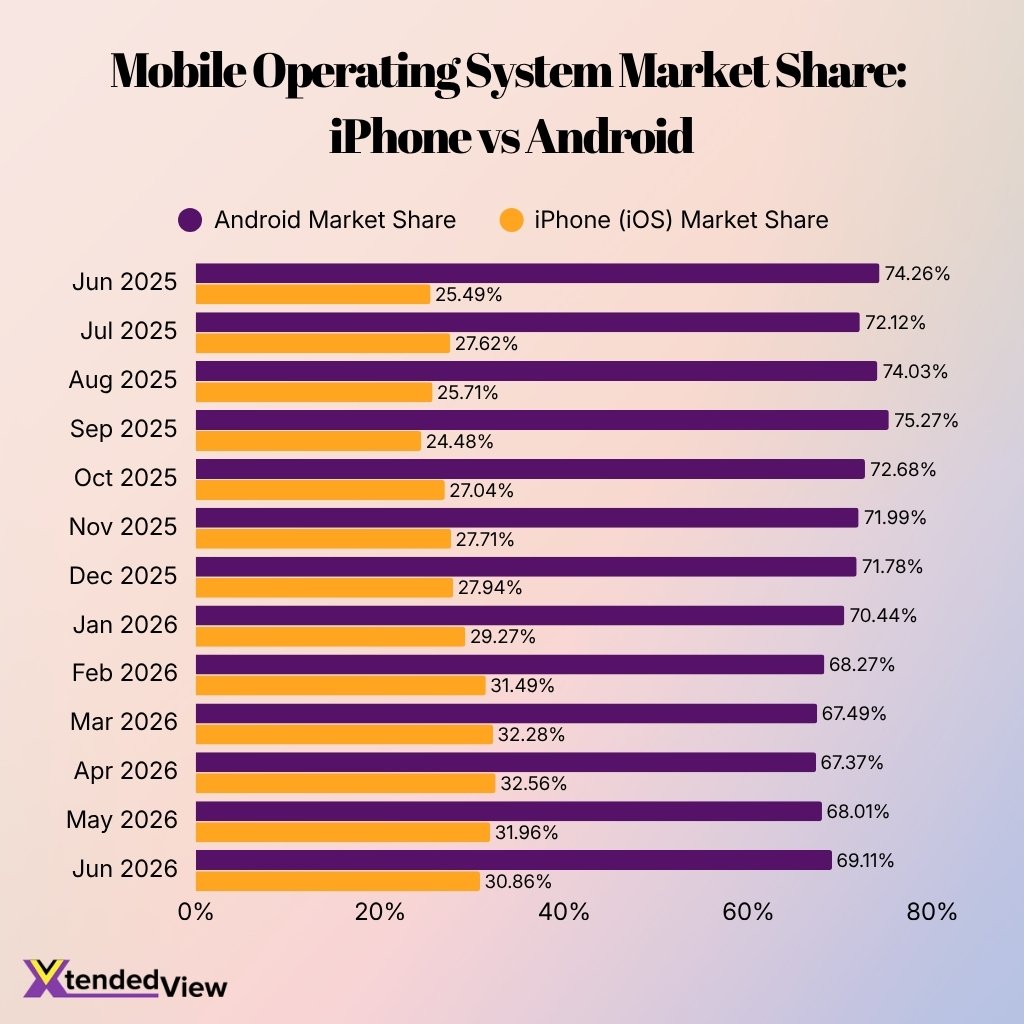
- Android remained the leading mobile operating system, holding between 67.37% and 75.27% of the market from June 2025 to June 2026.
- Android reached its highest share of 75.27% in September 2025, while iOS fell to its lowest point of 24.48%.
- iOS gained significant momentum in early 2026, rising from 27.94% in December 2025 to 32.56% in April 2026.
- iOS recorded its highest market share of 32.56% in April 2026, narrowing the gap with Android to 34.81 percentage points.
- Android’s share declined by 6.89 percentage points, from 74.26% in June 2025 to 67.37% in April 2026.
- The trend shifted slightly after April 2026, with Android recovering to 69.11% in June 2026 as iOS eased to 30.86%.
- Between June 2025 and June 2026, iOS increased by 5.37 percentage points, while Android declined by 5.15 percentage points.
- Despite iOS growth, Android still controlled more than two-thirds of the mobile OS market throughout the entire period.
Market Share by Country for iPhone vs Android
- In the United States, iPhone continues to lead the premium smartphone market, while Android maintains a strong presence across mid-range and budget segments.
- Apple reached a record 9% shipment share in India during 2025, up from 7% in 2024.
- India’s smartphone market remained relatively stable at approximately 152–153 million shipments during 2025.
- In China, Apple held 18.1% smartphone market share during Q2 2026.
- Huawei led the Chinese smartphone market with 22.6% share in Q2 2026.
- Apple’s iPhone 17 lineup helped the company achieve more than 30% growth in China during Q1 2026.
- North America remains one of Apple’s strongest regions, with 60% of smartphone shipments priced above $800 in early 2026.
- Emerging markets across Africa and parts of Asia continue to favor Android because of the availability of lower-priced smartphones.
- IDC expects emerging regions such as the Middle East and Africa to experience a 23% shipment decline in 2026 due to higher device costs, affecting Android vendors the most.
User Base Size of iPhone vs Android
- Android maintains its position as the world’s largest mobile OS with a 70.6% global market share in 2026.
- Apple’s iOS accounts for roughly 28.7% of the global mobile operating system usage across all devices.
- Apple’s ecosystem active installed base exceeds 2 billion devices, including 1.17 billion active iPhones globally.
- The Android ecosystem spans across hundreds of brands, comprising an estimated 3.03 billion active smartphones worldwide.
- Android dominates first-time adoption in developing markets, holding an 84.1% share in Brazil and 89.6% in Indonesia.
- The iPhone captures a massive 71.4% market share among premium smartphones priced at $800 and above.
- Over 90% of iPhone users choose to stay with Apple when upgrading, supporting steady active-user retention.
- Android overwhelmingly controls the massive Indian market with a 95.7% share compared to Apple’s 4.0%.
- Android and iOS collectively control 99.3% of the market, with alternative systems representing only 0.7% of active devices.
Global Smartphone Brands by Shipments
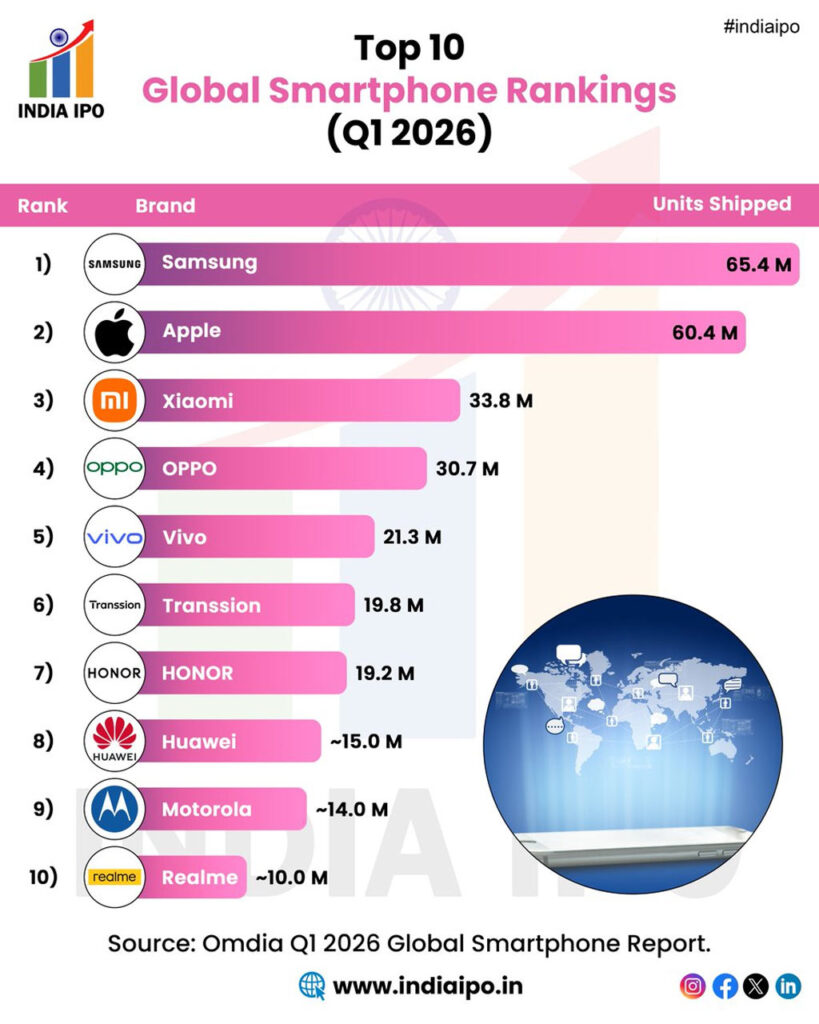
- Samsung ranked first globally with 65.4 million smartphone shipments in Q1 2026.
- Apple secured second place after shipping 60.4 million units, just 5 million fewer than Samsung.
- Xiaomi ranked third with 33.8 million shipments, significantly behind the two market leaders.
- OPPO shipped 30.7 million smartphones, placing it fourth in the global rankings.
- Vivo completed the top five with 21.3 million units shipped during the quarter.
- Transsion ranked sixth with 19.8 million shipments, narrowly ahead of HONOR.
- HONOR shipped 19.2 million units, only 0.6 million fewer than Transsion.
- Huawei ranked eighth with approximately 15 million smartphone shipments.
- Motorola placed ninth after shipping approximately 14 million units worldwide.
- Realme completed the top 10 with approximately 10 million smartphone shipments.
- The combined shipments of Samsung and Apple reached 125.8 million units, highlighting their dominance in the global smartphone market.
App Store Revenue of iPhone vs Android
- Global in-app purchase (IAP) revenue across iOS and Google Play reached a record $167 billion in 2025, up 10.6% year over year.
- Consumers spent more on non-gaming apps than games for the first time in 2025, driven largely by AI-powered applications.
- Non-gaming app spending increased 21% year over year during 2025.
- Apple’s App Store ecosystem facilitated more than $1.4 trillion in developer billings and sales during 2025.
- More than 90% of App Store ecosystem billings and sales generated no commission for Apple because they involved physical goods, services, or other exempt transactions.
- Digital goods and services generated $149 billion in App Store ecosystem billings and sales during 2025.
- In-app advertising contributed $151 billion to the App Store ecosystem in 2025.
- AI-enabled apps among the Top 100 App Store apps experienced 4× faster billing growth than other leading apps during 2025.
- The App Store averaged more than 850 million weekly users across 175 countries and regions in 2025.
App Downloads on iPhone vs Android
- Mobile app downloads across iOS and Google Play reached nearly 150 billion in 2025, increasing 0.8% year over year.
- Android generated the majority of global app downloads because of its significantly larger installed base.
- India recorded more than 25.5 billion app downloads during 2025, making it the world’s largest mobile app download market.
- The United States recorded approximately 12.6 billion app downloads during 2025.
- AI app downloads increased 148% year over year in 2025.
- Short-drama app downloads surged 278% during 2025, making them one of the fastest-growing categories worldwide.
- Consumers spent 5.3 trillion hours using mobile apps in 2025, equivalent to roughly 3.6 hours per day per user.
- In India alone, users spent more than 1.2 trillion hours in mobile apps during 2025.
- Non-gaming apps represented 72% of total app downloads in India during Q1 2026, reflecting changing user preferences.
iPhone vs Android App Spending Trends
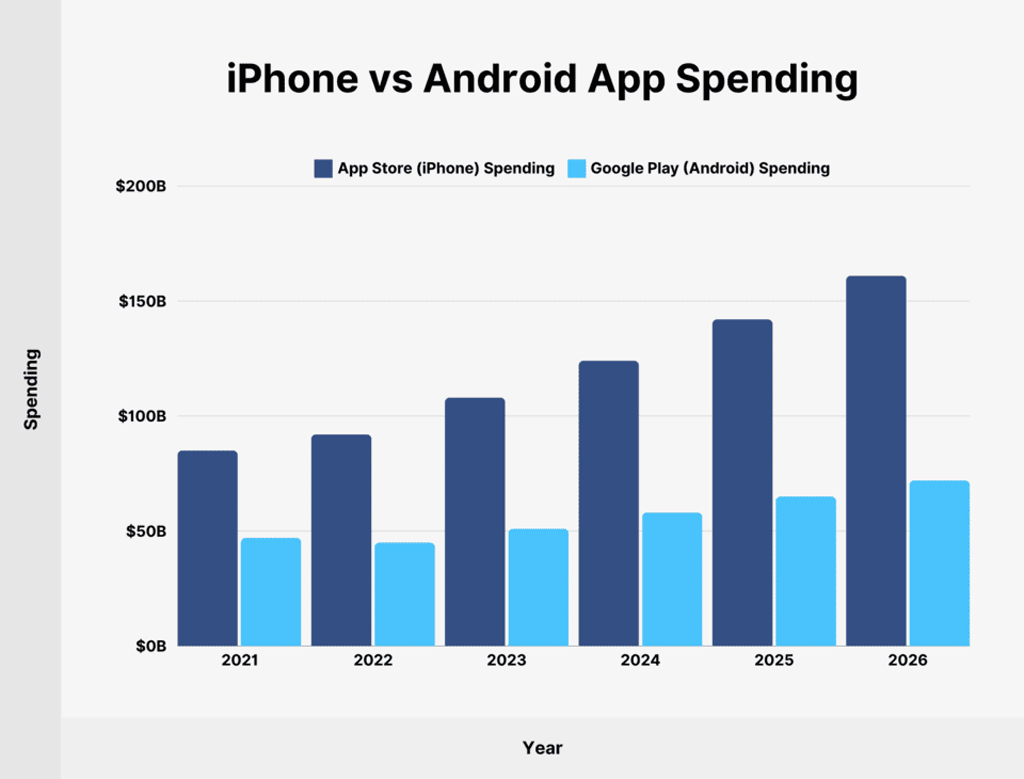
- App Store spending increased from $85 billion in 2021 to $161 billion in 2026, representing growth of nearly 89%.
- Google Play spending rose from $47 billion to $72 billion during the same period, an increase of approximately 53%.
- The App Store generated more consumer spending than Google Play in every year covered by the data.
- In 2026, iPhone users spent $89 billion more on apps than Android users.
- App Store spending crossed the $100 billion mark in 2023, reaching $108 billion.
- Google Play recorded its only annual decline in 2022, when spending fell from $47 billion to $45 billion.
- The spending gap widened from $38 billion in 2021 to $89 billion in 2026.
- Combined app spending reached $233 billion in 2026, up from $132 billion in 2021.
User Loyalty for iPhone vs Android
- iPhone brand loyalty reached an impressive 96.4% in 2026, significantly outpacing the overall Android loyalty rate of 86.4%.
- Apple’s active installed base surpassed 2.5 billion devices worldwide by the end of 2025, ensuring massive ecosystem retention.
- Android users are nearly four times more likely to switch platforms, with a 13.6% switching rate compared to just 3.6% for iPhone users.
- Long-term retention remains strong, as 83.8% of iPhone owners stick with the brand for over 5 years, compared to 33.8% of Android users.
- The App Store drives massive engagement, boasting over 850 million weekly active users across 175 countries.
- Ecosystem spending remains robust, with iPhone users spending an average of $140 annually on apps compared to just $69 for Android users.
- Software longevity supports this loyalty, as iPhones generally receive updates for 5 to 6 years, whereas most Androids get 2 to 3 years of support.
- Integration cements retention, with 80% of iPhone buyers owning at least one other Apple device, significantly raising switching costs.
- Among consumers who switch from Android to iPhone, 68% cite Apple’s better ecosystem as their primary motivation.
Switching Trends Between iPhone and Android
- iPhone brand loyalty reached a record 96.4% in 2026, while overall Android brand loyalty stood at 86.4%.
- Android users are nearly four times more likely to switch platforms than iPhone owners, at 13.6% versus 3.6%.
- Over 68% of users switching from Android to iPhone cited a better ecosystem as their primary motivation.
- Cost concerns and a desire for better value drove 45% of Android switchers away from the iPhone.
- Approximately 83.8% of iPhone owners remain for over five years, compared to just 33.8% of Android users.
- Apple captured 26.8% of all Android users who chose to switch to a different mobile operating system.
- The premium smartphone segment expanded by 11% YoY, capturing 22% of all device shipments in India.
- Apple is projected to achieve a 25% share of the global smartphone market in 2026 despite overall industry declines.
iPhone vs Android Usage by Age Group
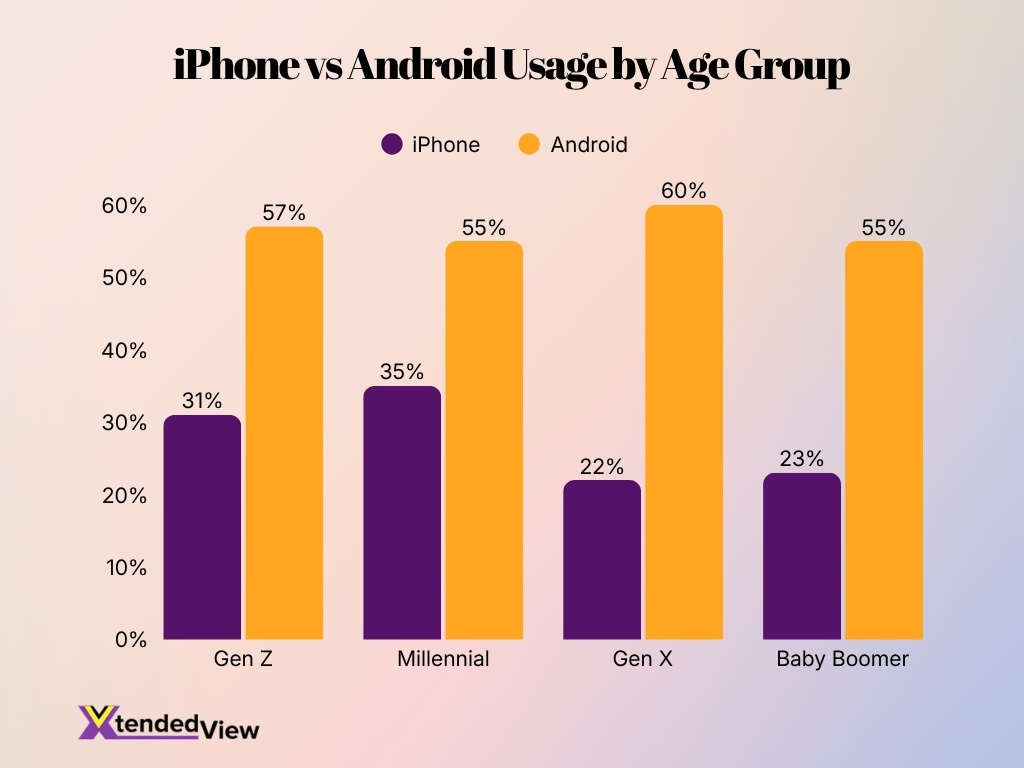
- Android leads across every age group, with usage ranging from 55% to 60%, while iPhone adoption remains between 22% and 35%.
- Gen X shows the strongest preference for Android, with 60% usage, compared with only 22% for iPhone, creating the largest gap in the dataset.
- Millennials have the highest iPhone usage at 35%, but Android still maintains a clear lead among this group at 55%.
- Among Gen Z consumers, Android accounts for 57% of usage, while iPhone represents 31%, a difference of 26 percentage points.
- Baby Boomers also favor Android, with 55% usage, more than double the 23% share recorded for iPhone.
- Overall, the data indicates that Android has broader adoption across generations, while iPhone performs best among Millennials and Gen Z.
Premium Device Share of iPhone vs Android
- Apple secured a record 20% global smartphone market share in 2025, achieving a 10% year-over-year growth.
- The premium smartphone segment ($600–$800) experienced a massive 37% year-over-year shipment growth.
- Apple absolutely dominated the premium device tier by capturing a 74% share in major expanding markets.
- Samsung successfully increased its super-premium device shipments by 1.8x, boosting its high-end share to 34%.
- The Apple App Store generated $80 billion in early 2026, easily outpacing Google Play’s $36 billion.
- iPhone owners spend an average of $140 annually on applications compared to just $69 for Android users.
- Exactly 68% of users who switched from Android to iPhone cited a better integrated ecosystem as their reason.
- Premium foldable smartphones across the Android ecosystem are projected to experience a 30% year-over-year growth.
- Apple retained a commanding 60% share in wearables, heavily reinforcing its premium ecosystem loyalty.
OS Version Usage of iPhone vs Android
- iOS 26.5 accounted for 54.61% of active iPhones worldwide in June 2026, making it the most widely used iOS version.
- iOS 18.7 represented 10.42% of active iPhones globally in June 2026.
- Android 16 became the leading Android release with 23.64% global market share among Android devices.
- Android 15 accounted for 17.03% of Android devices worldwide in June 2026.
- Android 13 remained active on 14.18% of Android smartphones globally.
- Android 14 held 12.74% of the Android installed base in June 2026.
- Older Android releases, including Android 12 and Android 11, still powered nearly 18% of Android devices combined, illustrating Android’s broader version fragmentation.
- Apple’s faster software rollout enables most active iPhones to adopt the latest iOS version much sooner than Android devices receive major OS upgrades.
- Android’s broader hardware ecosystem results in more simultaneous OS versions than iOS, reflecting diverse manufacturer update schedules.
iPhone vs Android App Retention Trends
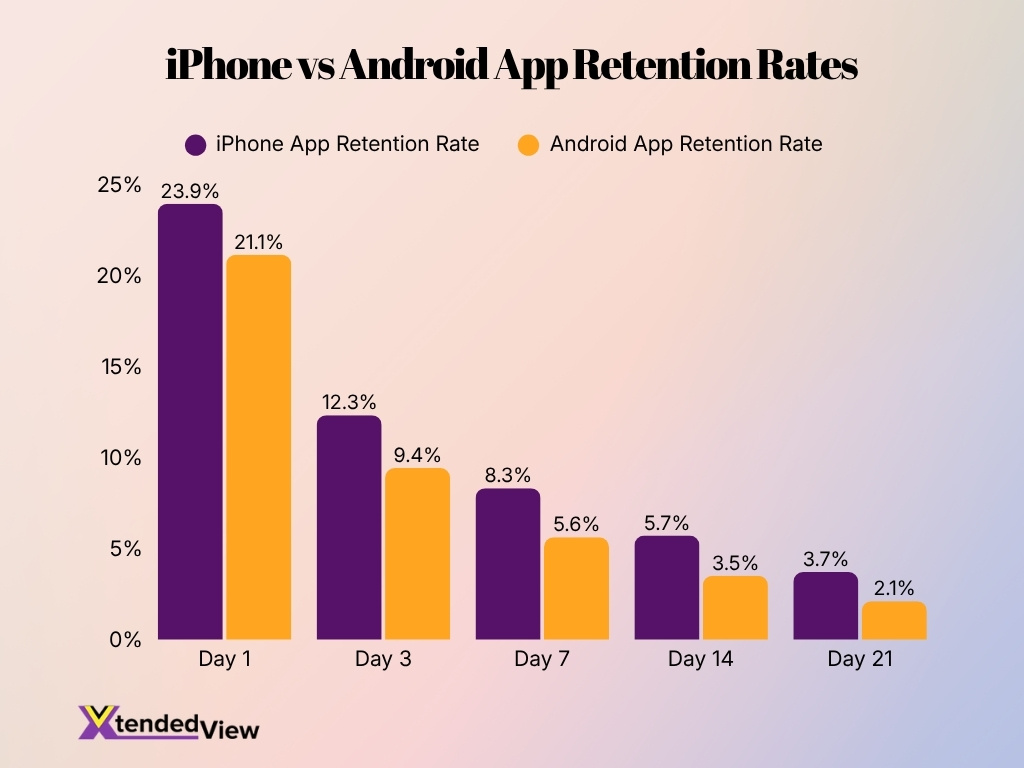
- iPhone apps recorded stronger retention than Android apps across every measured timeframe.
- On Day 1, iPhone retention reached 23.9%, compared with 21.1% for Android.
- By Day 3, retention fell to 12.3% on iPhone and 9.4% on Android.
- After seven days, iPhone apps retained 8.3% of users, while Android apps retained 5.6%.
- At Day 14, iPhone retention remained higher at 5.7%, versus 3.5% for Android.
- By Day 21, retention declined to 3.7% for iPhone and 2.1% for Android.
- The retention gap widened from 2.8 percentage points on Day 1 to 3.2 percentage points on Day 3.
- Overall, both platforms experienced a sharp decline, but iPhone maintained a clear retention advantage throughout the user lifecycle.
Device Satisfaction for iPhone vs Android
- Apple’s overall customer satisfaction score measured 80 in 2026.
- Samsung recorded an overall satisfaction score of 81 in 2026, narrowly leading Apple.
- Flagship iPhones earned a satisfaction score of 82, matching the category average.
- Samsung flagship devices led the category with a satisfaction score of 84.
- Apple reported 99% customer satisfaction for the iPhone 17 lineup in 2026.
- Industry-wide cell phone satisfaction improved from 78 in 2025 to 79 in 2026.
- Battery life satisfaction increased from 77 to 81 across the industry between 2025 and 2026.
- AI feature performance debuted in 2026 with a satisfaction score of 85.
- Screen quality satisfaction increased from 82 to 85 across the industry in 2026.
Performance and Usage Trends of iPhone vs Android
- Global consumers spent approximately 5.3 trillion hours using mobile apps during 2025, averaging about 3.6 hours per day.
- AI app downloads increased 148% during 2025, making artificial intelligence one of the fastest-growing mobile categories.
- AI apps generated more than $5 billion in consumer spending during 2025.
- Mobile app spending reached a record $167 billion in 2025 across iOS and Android.
- Non-gaming apps generated more consumer spending than mobile games for the first time.
- The App Store averaged more than 850 million weekly users during 2025 across 175 countries and regions.
- Apple’s services ecosystem recorded its strongest year ever in 2025, driven by App Store, Apple Pay, Apple Music, and Apple TV growth.
- Android continues to lead global smartphone usage because of its broader hardware ecosystem and extensive availability across price segments.
- Premium AI capabilities, improved processors, and longer software support cycles continue driving upgrade demand across both ecosystems.
Forecast and Future Trends for iPhone vs Android
- Worldwide smartphone shipments are forecast to decline 13.9% to 1.09 billion units during 2026 because of memory shortages and rising manufacturing costs.
- Apple is expected to achieve its highest-ever annual shipment share of 22% during 2026.
- Average smartphone selling prices are projected to reach a record $550 as consumers upgrade to AI-enabled flagship devices.
- Generative AI is expected to remain one of the largest drivers of premium upgrades, with AI phones exceeding 50% of smartphone shipments by 2027.
- Android manufacturers are expected to expand on-device AI capabilities to combat a projected 20% year-over-year shipment decline across flagship and upper mid-range devices.
- Apple continues expanding its installed base in high-growth markets, helping drive a 4.4% year-over-year increase in global sales for early 2026.
- Consumers in premium markets are expected to prioritize AI features and camera quality, pushing over 60% of premium shipments to be priced above $800 when choosing new smartphones.
- The global smartphone market value is projected to hit $642.64 billion in 2026 as AI subscriptions, productivity apps, and digital services expand across both ecosystems.
- Competition between iPhone and Android is likely to shift toward AI experiences and ecosystem value, driving a 7.30% compound annual growth rate through 2034 rather than hardware specifications alone.
Frequently Asked Questions (FAQs)
As of June 2026, Android holds 69.14% of the global mobile operating system market, while iOS accounts for 30.79%.
Apple shipped 61.8 million iPhones worldwide in Q1 2026, representing a 21.0% global smartphone shipment share.
Global smartphone shipments reached 293.8 million units in Q1 2026, a 2.9% year-over-year decline.
iOS accounted for 22% of global smartphone sales in Q1 2026, while Android held 73%.
Apple’s installed base exceeded 2.5 billion active devices worldwide as of its fiscal first quarter of 2026.
Conclusion
The iPhone and Android ecosystems remain the two dominant forces in the global smartphone industry, but they continue to compete in different ways. Android leads in worldwide market share, device variety, and global reach, while iPhone maintains an advantage in premium device sales, app monetization, customer loyalty, and ecosystem engagement. Artificial intelligence, premium smartphone adoption, and expanding digital services became the primary growth drivers for both platforms.
As manufacturers invest more heavily in on-device AI, longer software support, and integrated ecosystems, competition between iPhone and Android will increasingly focus on delivering better long-term user experiences rather than simply shipping more devices.
