



Digital signage has become a core communication channel for businesses that need to deliver timely, engaging content across physical locations. Retailers use it to promote products and personalize in-store experiences, while airports, hospitals, restaurants, and corporate offices rely on it for real-time information and wayfinding. As AI, cloud management, and data-driven advertising reshape the industry, digital signage continues to expand across the U.S. and global markets. Explore the latest statistics below to understand how the market is growing, where investment is accelerating, and what trends are defining.
Editor’s Choice
- The global digital signage market reached $31.1 billion in 2025 and is estimated to grow to $33.6 billion in 2026.
- The market is forecast to reach $58.4 billion by 2033, expanding at a CAGR of 8.2% between 2026 and 2033.
- North America accounted for 35.6% of global digital signage revenue in 2025, making it the largest regional market.
- The U.S. digital signage market generated $7.44 billion in 2025 and is projected to reach $12.97 billion by 2033.
- Video walls represented 25.5% of the global market in 2025, making them the largest product segment.
- The hardware segment contributed more than 59% of total market revenue in 2025.
- The retail sector accounted for over 19% of global digital signage demand in 2025, maintaining its position as the largest application segment.
Recent Developments
- During 2026, analysts estimated the global market value at $33.6 billion, reflecting continued enterprise investment in digital customer engagement.
- AI-powered content personalization has become a key growth driver as organizations seek to deliver audience-specific messaging across connected displays.
- Smart city initiatives continue to increase demand for digital signage across transportation hubs and public infrastructure projects.
- Businesses increasingly deploy cloud-managed signage networks to simplify remote monitoring, scheduling, and content updates.
- Demand for 4K commercial displays continues to rise as advertisers seek sharper visual experiences for premium campaigns.
- Energy-efficient LED-backlit displays remain a major investment area because they lower operating costs while improving display quality.
- The expansion of Digital Out-of-Home (DOOH) advertising continues to drive deployments across retail, hospitality, transportation, and urban environments.
- Organizations increasingly integrate IoT and AI capabilities with signage systems to automate content delivery and operational management.
Digital Signage Market Size
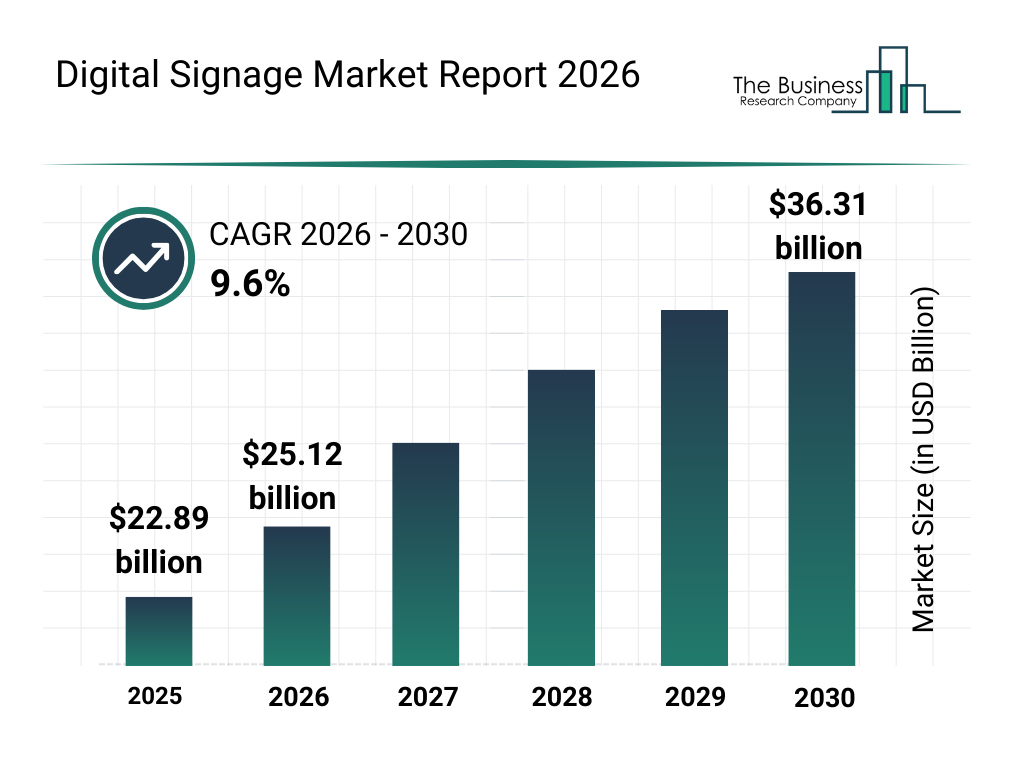
- The global digital signage market was valued at $22.89 billion in 2025, establishing a strong base for continued expansion as businesses increasingly adopt digital displays for advertising, communication, and customer engagement.
- In 2026, the market is projected to grow to $25.12 billion, representing an increase of approximately $2.23 billion compared with the previous year.
- By 2027, the digital signage market is estimated to reach around $27.53 billion, reflecting sustained demand for interactive displays, digital advertising screens, and smart signage solutions.
- The market is expected to surpass the $30 billion milestone in 2028, reaching approximately $30.18 billion as digital signage adoption expands across retail, hospitality, transportation, and corporate environments.
- By 2029, the global digital signage market could reach approximately $33.08 billion, continuing its steady upward trajectory as organizations replace traditional static signage with more flexible digital alternatives.
- The digital signage industry is forecast to reach $36.31 billion by 2030, representing an increase of approximately $13.42 billion compared with its 2025 market size of $22.89 billion.
- From 2026 to 2030, the market is forecast to expand at a strong 9.6% CAGR, highlighting significant growth opportunities for digital display manufacturers, software providers, advertisers, and signage technology companies.
Digital Signage Market Growth
- The worldwide market is expected to expand at a CAGR of 8.2% from 2026 through 2033.
- The U.S. market is projected to grow at a 7.2% CAGR during the same forecast period.
- AI-enabled personalization is accelerating adoption across retail, transportation, education, and healthcare environments.
- Increasing investment in smart city infrastructure continues to support market expansion worldwide.
- Growth in cloud-based content management allows enterprises to scale signage deployments across multiple locations more efficiently.
- Continued expansion of DOOH advertising creates new revenue opportunities for display operators and advertisers.
- Higher demand for immersive customer experiences encourages businesses to replace static signage with dynamic digital displays.
- Falling energy consumption through modern LED technologies supports long-term deployment across commercial facilities.
Digital Signage Market Forecast
- Global market revenue is projected to reach $58.4 billion by 2033.
- An alternative market forecast estimates the industry will reach $69.9 billion by 2034.
- Asia-Pacific is expected to record the fastest regional growth throughout the forecast period.
- The U.S. market is forecast to reach $12.97 billion by 2033.
- India’s digital signage market is projected to reach $2.97 billion by 2033, growing at a 10.7% CAGR from 2026 onward.
- Continued investments in AI, IoT, and cloud technologies are expected to strengthen long-term market demand.
- Retail, transportation, healthcare, hospitality, and education are expected to remain the leading growth sectors through the forecast period.
- Expansion of interactive displays, smart infrastructure, and data-driven advertising is expected to support sustained market growth beyond 2030.
Digital Signage Market Share by Region
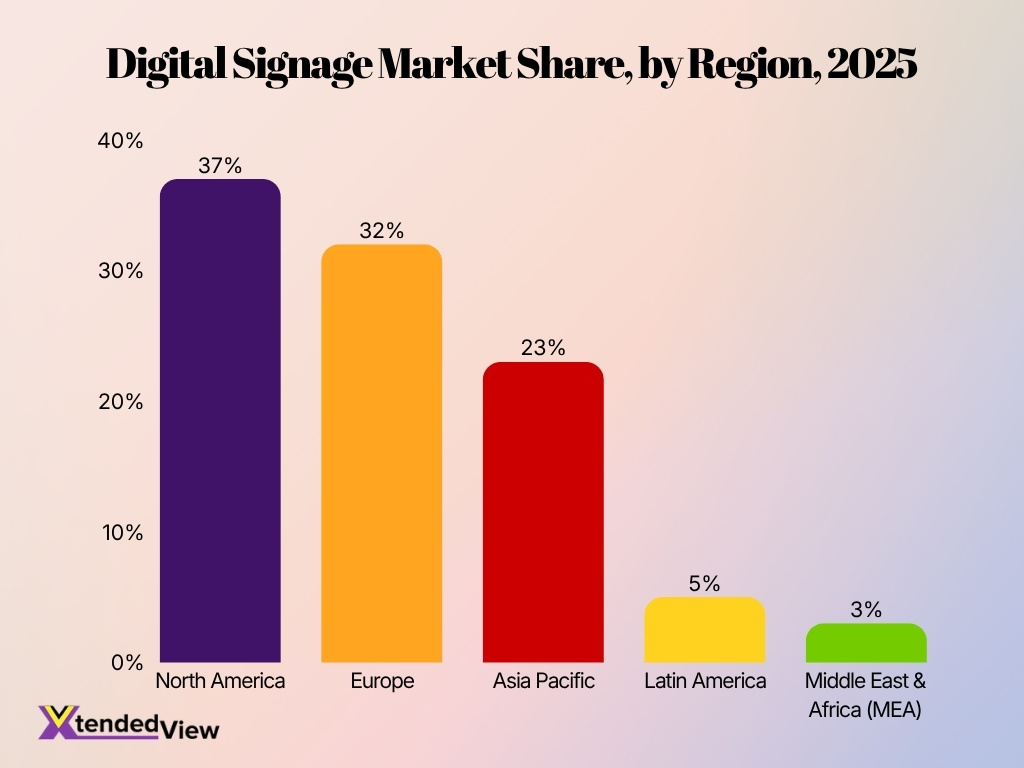
- North America leads the global digital signage market, accounting for 37% of total market share in 2025.
- Europe follows closely with a substantial 32% market share, just 5 percentage points behind North America.
- Asia Pacific represents 23% of the digital signage market, making it the third-largest regional market.
- Together, North America and Europe account for 69% of the global market, highlighting the strong concentration of digital signage adoption in these regions.
- The top three regions, North America, Europe, and Asia Pacific, collectively control 92% of the global digital signage market.
- Latin America holds 5% of the market, indicating a considerably smaller presence compared with the three leading regions.
- MEA (Middle East and Africa) accounts for the smallest regional share at just 3% of the global digital signage market.
- Combined, Latin America and MEA contribute only 8%, showing significant potential for future digital signage expansion in these emerging markets.
Digital Signage Adoption and Deployment Statistics
- The global digital signage market is projected to reach $69.90 billion by 2034 with a 9.26% CAGR.
- Approximately 70% of U.S. hospitals have adopted digital communication systems to enhance operations.
- Over 60% of enterprises currently without digital signage plan to invest in the technology within two years.
- Nearly 80% of brands utilizing digital displays report an increase in sales by up to 33%.
- Deploying digital signage in professional environments is linked to a 22% improvement in workplace engagement.
- Implementing digital signage technology has been shown to increase footfall by up to 24% in retail locations.
- Visual digital signage boasts an 83% recall rate, significantly outperforming traditional advertising methods.
- Approximately 53% of current digital signage end-users expect to increase their spending over the next two years.
- Businesses that leverage digital signage experience a 46% increase in overall customer satisfaction metrics.
Digital Signage Display Statistics
- Video walls captured 25.5% of the global market in 2025, making them the largest display type.
- Displays measuring 32 to 52 inches represented the leading screen-size category, holding a 41% revenue share during 2025.
- LCD technology maintained the largest market share among display technologies globally in 2025, driving a $31.1 billion industry.
- Commercial adoption of 4K displays continues to increase, driving a 9.26% CAGR as organizations seek higher-quality visual experiences.
- Energy-efficient LED displays captured a 47% market share in 2025 because they reduce operating costs while improving brightness.
- Transparent OLED displays continue expanding into premium retail environments, accelerating at a 47.74% CAGR to enhance customer engagement.
- MicroLED technology is becoming increasingly available for premium commercial installations, supporting a forecasted $58.4 billion market by 2033.
- Large-format commercial displays continue becoming more affordable, encouraging adoption across the retail sector, which generated 21% of revenue in 2025.
Small Business Digital Signage Screen Usage
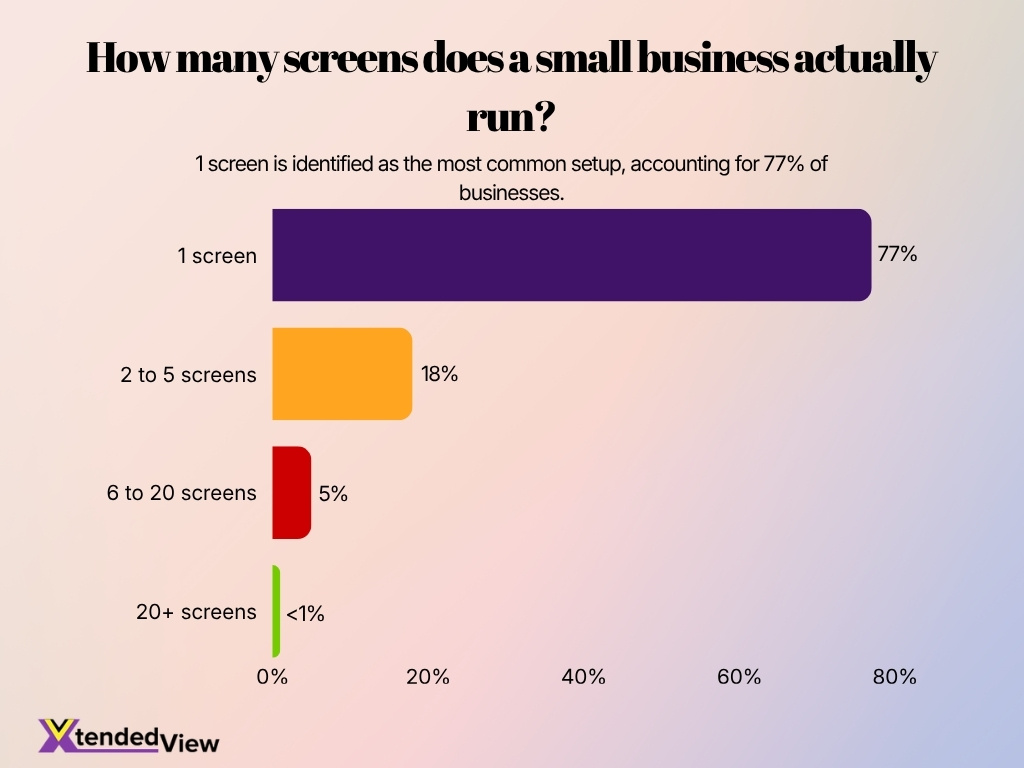
- Single-screen setups dominate, with 77% of businesses managing just one screen, making it by far the most common digital signage configuration.
- Businesses operating 2 to 5 screens account for 18%, indicating that multi-screen deployments remain relatively limited among smaller operators.
- Only 5% of businesses manage between 6 and 20 screens, showing a significant decline in adoption as the number of screens increases.
- Large deployments are extremely uncommon, with less than 1% of businesses operating 20 or more screens through the platform.
- Overall, the data suggests that 95% of businesses manage five screens or fewer, highlighting the strong concentration of digital signage usage among smaller deployments.
- The findings are based on anonymized platform usage from 5,000+ active businesses as of June 2026, providing a broad snapshot of real-world screen management patterns.
Cloud-Based Digital Signage Statistics
- The cloud-hosted managed platforms segment is expanding at a 7.52% CAGR as organizations update displays remotely.
- Cloud deployment reduces reliance on on-site support, which currently accounts for 44.10% of the digital signage services market.
- Managed cloud network services are growing at a 7.95% CAGR as enterprises demand real-time analytics and centralized governance.
- The global digital signage market will reach $69.90 billion by 2034 as cloud infrastructure improves network scalability.
- Approximately 58.5% of market revenue comes from hardware that increasingly relies on AI-powered cloud platforms for content automation.
- Faster cloud connectivity enables immediate emergency notifications across networks that are driving an overall 9.26% market growth rate.
- The retail sector leads cloud-based management adoption, accounting for 34.20% of total industry revenue to maintain consistent branding.
- North America holds a dominant 42.06% market share as enterprises rapidly transition to secure hybrid cloud architectures.
Digital Signage Hardware and Software Statistics
- Hardware accounted for 59% of total digital signage revenue in 2025, maintaining its position as the largest component.
- The video walls segment represented 25.5% of the overall market share in 2025 due to ongoing commercial demand.
- Cloud-based CMS software adoption has climbed to 78% as enterprises increasingly seek centralized remote administration.
- AI integration within signage software reached 41% in 2026, successfully automating audience targeting and scheduling.
- Integrated software analytics prove that dynamic displays capture 400% more views compared to traditional static alternatives.
- The interactive touch display market reached $7.61 billion, driving demand for higher-performance commercial media players.
- Menu board software ecosystems integrated with POS systems consistently lift sales by 5% to 37% across retail locations.
- The combined hardware and software market will grow from $31.1 billion in 2025 to $58.4 billion by 2033 at an 8.2% CAGR.
Digital Signage Player and Hardware Statistics
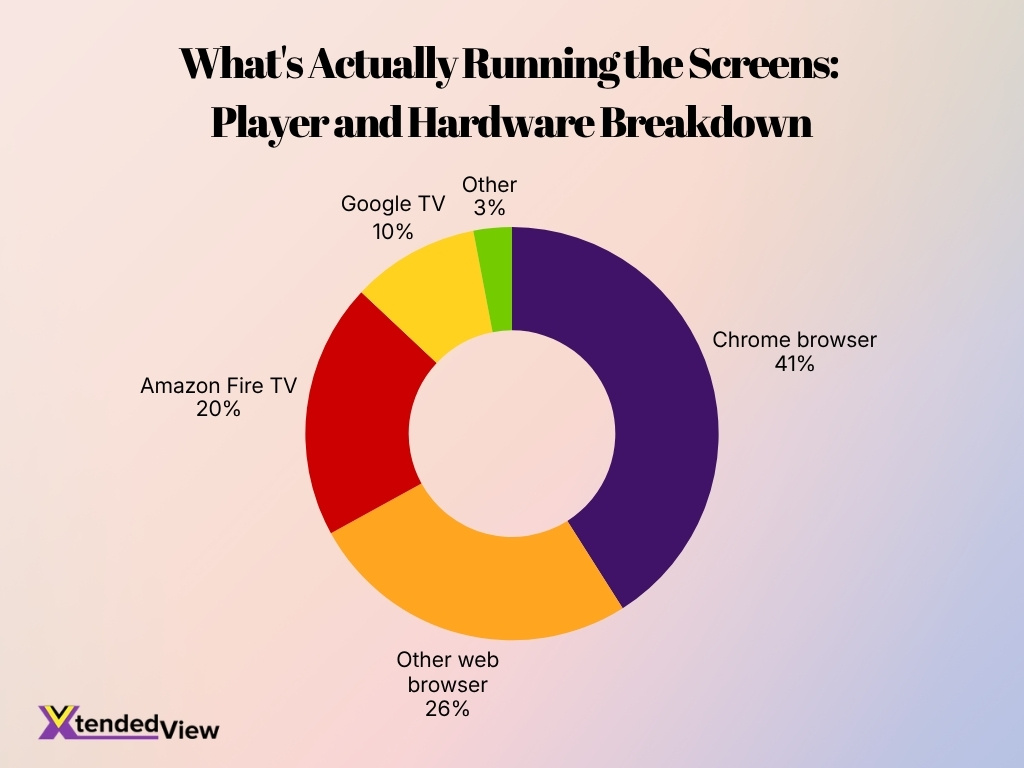
- Chrome browser leads digital signage deployments at 41%, making it the single most widely used platform for running screens.
- Other web browsers account for 26% of screens, showing that browser-based signage extends well beyond Chrome.
- Overall, 69% of screens run in a browser without dedicated hardware, highlighting the strong shift toward software-driven digital signage deployments.
- Amazon Fire TV powers 20% of screens, equivalent to 1 in every 5 screens across the measured platform.
- With its 20% share, Amazon Fire TV ranks as the most popular dedicated digital signage player in the dataset.
- Google TV represents 10% of screen deployments, giving it half the share recorded by Amazon Fire TV.
- Other player and hardware options collectively make up just 3%, indicating that deployments are concentrated among a few major platforms.
- The platform recorded 284 confirmed Amazon Signage Sticks, demonstrating measurable adoption of purpose-built signage hardware.
- These figures are based on anonymized usage data covering 5,000+ active businesses as of June 2026, providing a broad view of digital signage deployment trends.
Retail Digital Signage Statistics
- The global retail digital signage market generated $5.92 billion in revenue during 2025.
- Retail digital signage revenue is projected to reach $9.73 billion by 2033.
- The retail segment is expected to grow at a 6.4% CAGR through 2033.
- North America represented the largest regional retail signage market with a 35.6% revenue share in 2025.
- India is projected to record the fastest retail digital signage growth rate during the forecast period.
- The retail sector registered a maximum overall application market share of 21% in 2025.
- The broader global digital signage market was valued at $31.1 billion in 2025.
- Video walls held the largest market share of 25.5% as retailers increasingly deploy digital displays for customer engagement.
Digital Out-of-Home Advertising Statistics
- U.S. out-of-home (OOH) advertising revenue reached a record $9.46 billion in 2025, representing 3.6% year-over-year growth and marking the industry’s 19th consecutive quarter of growth.
- Digital Out-of-Home (DOOH) accounted for 36.3% of total U.S. OOH revenue in 2025, while DOOH revenue increased 10.5% year over year.
- The global DOOH advertising market is estimated at $26.5 billion in 2026 and is forecast to reach $39.1 billion by 2030, growing at a 10.7% CAGR.
- North America held 36.0% of global DOOH revenue in 2024, remaining the largest regional market entering 2026.
- Industry forecasts indicate that DOOH will account for nearly 42% of worldwide OOH advertising revenue in 2025, reflecting the continued shift from static to digital displays.
- Global DOOH advertising revenue is projected to approach $30 billion by 2029, supported by increasing programmatic buying and smart-city deployments.
- Programmatic DOOH generated approximately $1.4 billion in worldwide advertising spend during 2025, representing 7% of total DOOH expenditure.
- Transit advertising remained the fastest-growing OOH format in the U.S. for the second consecutive year, increasing 9.2% in 2025.
Digital Signage by Industry
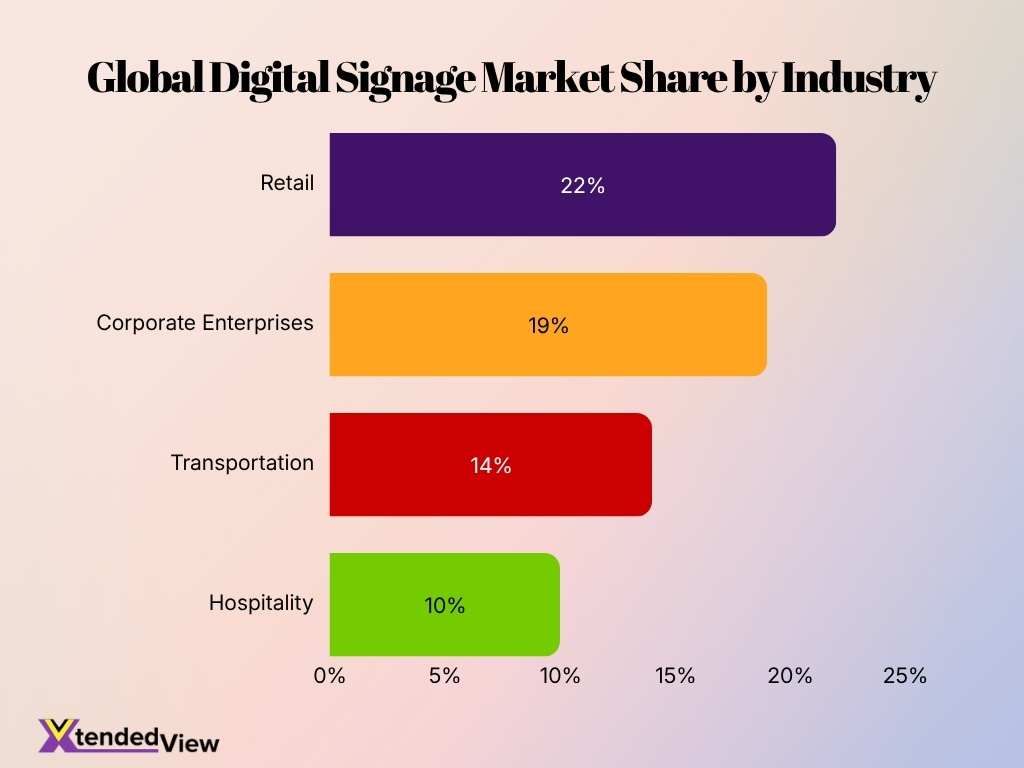
- Retail remains the largest end-use industry, capturing 22% of the global digital signage market share for dynamic promotions.
- Healthcare represents the fastest-growing vertical, expanding at an 8.35% CAGR to improve patient communication and operational efficiency.
- Transportation providers account for a 14% market share, deploying an average of 85 screens per network for arrival updates, safety messaging, and advertising.
- Hospitality businesses contribute a 10% market share, experiencing an 8% year-over-year growth in displays used for guest services, promotions, and navigation.
- Over 87% of educational institutions have deployed digital signage systems to streamline campus-wide announcements, emergency alerts, and digital learning support.
- Nine out of ten manufacturing companies use digital displays to reinforce workplace safety, display production dashboards, and track operational KPIs.
- Corporate enterprises capture a 19% market share, increasingly installing digital displays to improve employee communication and workplace collaboration.
- Over 82% of financial institutions utilize digital signage to modernize branches with interactive displays for customer education and queue management.
Digital Signage Consumer Behavior and Engagement Statistics
- Digital displays capture 400% more views than traditional static displays.
- Dynamic content on digital signs yields an impressive 83% recall rate among viewers.
- Nearly 76% of consumers enter a store because digital signage caught their interest.
- The average dwell time for digital signage is 2.6 times longer than for static signage.
- Implementing digital signage reduces perceived wait times at service points by up to 35%.
- Approximately 68% of consumers state that digital signage influences their decision to buy.
- Videos shown on digital signage generate a 47% higher engagement rate than static images.
- Over 74% of mobile users take action after viewing out-of-home digital signage campaigns.
- Businesses report an average uplift in sales of 31.8% after implementing digital displays.
Digital Signage Sales Impact and Return on Investment Statistics
- 80% of brands utilizing digital signage report an increase in sales of up to 33%.
- Businesses typically experience a 31.8% upswing in overall sales volumes after implementing digital displays.
- Retail operators regularly see 15–30% sales lifts for featured items actively promoted on screens.
- Transitioning to digital signage networks effectively reduces recurring print costs by 30–50%.
- Strategic in-store digital displays generate a 19.8% increase in impulse and unplanned purchases.
- The average payback period for a complete digital signage investment ranges between 6 and 18 months.
- Approximately 70% of customers confirm that digital signage actively influenced their purchasing decisions.
- Engaging digital signage content directly drives a 32.8% growth in repeat buyers for retail establishments.
- Shoppers spend 30% more time browsing in retail environments equipped with dynamic digital displays.
- Digital signage improves the customer experience by reducing perceived wait times by up to 35%.
Digital Signage Market Share by Company
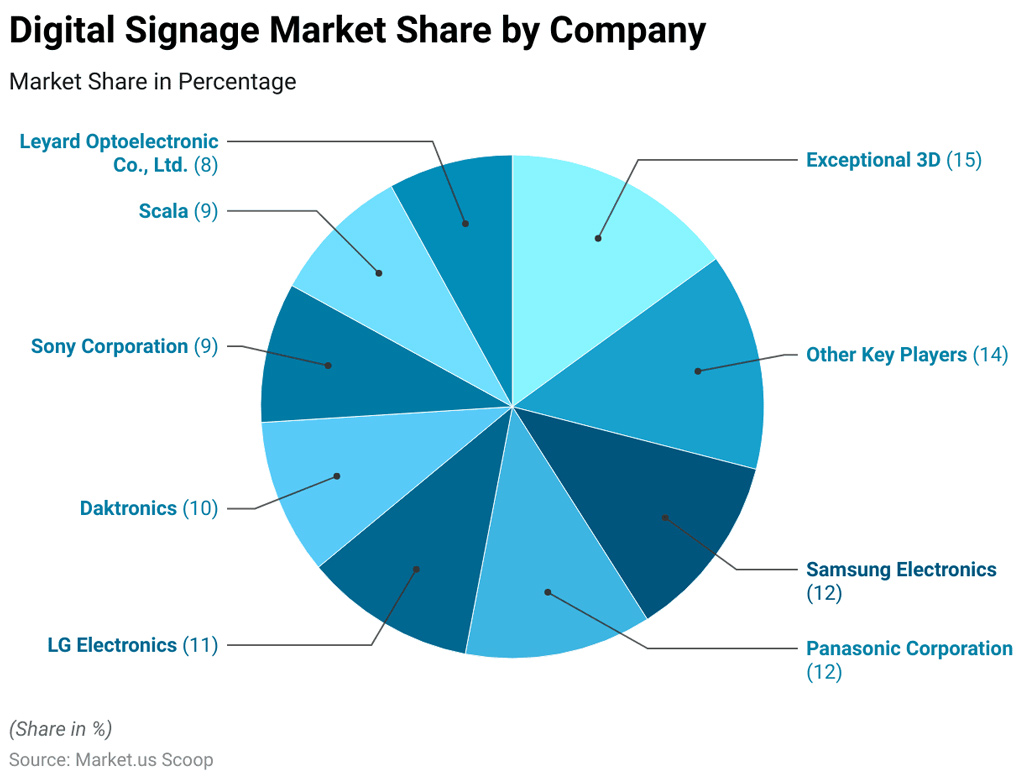
- Exceptional 3D leads the digital signage market with a 15% share, making it the largest individual company represented in the data.
- Other key players collectively account for 14% of the market, highlighting the presence of several smaller competitors beyond the leading companies.
- Samsung Electronics holds a substantial 12% market share, positioning it among the strongest major technology brands in the digital signage sector.
- Panasonic Corporation also captures 12% of the market, placing it level with Samsung Electronics in overall market share.
- LG Electronics controls 11% of the digital signage market, just one percentage point behind Samsung and Panasonic.
- Daktronics accounts for 10% of the market, giving the company a notable double-digit share within the competitive landscape.
- Sony Corporation and Scala each hold 9%, meaning the two companies collectively represent 18% of the market.
- Leyard Optoelectronic Co., Ltd. represents 8% of the market, the smallest individual company share shown in the dataset.
- The three leading named companies, Exceptional 3D, Samsung Electronics, and Panasonic Corporation, collectively account for 39% of the digital signage market.
- Overall, the market appears highly distributed, with no individual company exceeding a 15% share, indicating strong competition among multiple digital signage providers.
Interactive and AI-Powered Digital Signage Statistics
- The global digital signage market is projected to reach $58.4 billion by 2033, growing at an 8.2% CAGR.
- Interactive touch screens and displays are expected to experience rapid expansion at an 8.85% CAGR through 2031.
- Digital signage implementations generate an 83% message recall rate and capture 400% more views than traditional static signs.
- North America dominated the global digital signage industry by capturing a 42.06% market share in 2025.
- The specialized software market powering these digital displays is forecast to hit $39.8 billion by 2035 at a 13% CAGR.
- Interactive self-service kiosks captured a significant 18% market share of all digital signage configurations worldwide in 2025.
- Retail environments currently represent the largest deployment sector, making up 40% of the total digital signage market.
- Advanced video walls dominated the market by configuration type, accounting for a 25.5% revenue share in 2025.
- Despite AI being a major growth driver, 72.8% of users cite the lack of a real need as the top barrier to AI adoption in signage content.
Digital Signage Technology Trends
- Cloud-native digital signage platforms are projected to expand at a 7.52% CAGR as brands prioritize centralized management.
- Implementing AI-powered personalization in commercial signage networks can boost enterprise marketing revenue by 10% to 30%.
- The premium OLED display segment is accelerating at an 11.5% CAGR as commercial adoption expands for high-end customer experiences.
- Organizations deploying 4K and 8K displays helped drive the global signage hardware market to $18.3 billion in 2025.
- Integration of voice recognition and interactive sensors in displays is fueling a smart technology market expected to hit $26.8 billion.
- The programmatic advertising sector for digital out-of-home displays is forecast to surge from $2.03 billion in 2026 to $6.14 billion by 2030.
- Leveraging advanced predictive analytics in digital display campaigns can dramatically improve business sales forecasts by 30% to 40%.
- Energy-efficient LED displays dominated the industry at $14.4 billion in 2025 as sustainability remains a primary purchasing factor.
Frequently Asked Questions (FAQs)
The global digital signage market is estimated to reach USD 33.6 billion in 2026, up from USD 31.1 billion in 2025.
The global digital signage market is expected to grow at a CAGR of 8.2% between 2026 and 2033.
North America held the largest regional market share with 35.6% of global revenue in 2025.
The hardware segment accounted for more than 59% of total market revenue in 2025, making it the largest component category.
The retail sector was the largest application segment, accounting for over 19% of the global digital signage market in 2025.
Conclusion
Digital signage continues to evolve from a display technology into a data-driven communication platform that supports retail, healthcare, transportation, education, hospitality, and enterprise operations. Growth reflects increasing investment in cloud management, AI-powered personalization, interactive experiences, and Digital Out-of-Home advertising. As organizations continue modernizing customer engagement and workplace communication, digital signage is expected to remain a key driver of connected, real-time communication and business growth throughout the coming years.
