


Samsung remains one of the world’s largest technology companies, shaping industries that range from smartphones and semiconductors to consumer electronics and digital displays. Its innovations power everyday consumer devices while also supporting data centers, AI infrastructure, automotive electronics, and enterprise computing. As AI adoption and demand for advanced memory accelerate, Samsung’s business performance continues to influence the broader technology market. Explore the latest Samsung statistics to understand how the company performed and the trends shaping.
Editor’s Choice
- Samsung generated KRW 333.6 trillion in revenue during fiscal 2025, up from KRW 300.9 trillion in 2024.
- The company reported KRW 43.6 trillion in operating profit in 2025, compared with KRW 32.7 trillion in 2024.
- Samsung’s net income reached KRW 45.2 trillion in 2025, increasing from KRW 34.5 trillion the previous year.
- The Device eXperience (DX) division generated KRW 188.0 trillion in sales during 2025, making it Samsung’s largest business segment.
- Samsung achieved its highest-ever quarterly revenue of KRW 93.8 trillion during Q4 2025.
- AI-driven demand for high-bandwidth memory (HBM) significantly strengthened Samsung’s semiconductor business throughout 2025.
- Samsung continues to expand Galaxy AI capabilities across its smartphone ecosystem, making on-device AI one of its primary product strategies entering 2026.
Recent Developments
- Samsung completed fiscal 2025 with record annual revenue of KRW 333.6 trillion, driven by AI-related semiconductor demand and premium mobile devices.
- During Q4 2025, quarterly revenue climbed to an all-time high of KRW 93.8 trillion.
- Q4 2025 operating profit reached a record KRW 20.1 trillion, reflecting stronger profitability across memory and display businesses.
- Samsung expanded shipments of HBM3E memory while preparing next-generation HBM4 products for AI infrastructure customers.
- The company highlighted Galaxy AI as a core ecosystem feature by extending AI experiences across smartphones, tablets, wearables, and PCs.
- Samsung continued investing in premium foldable smartphones while integrating more AI-powered productivity features across Galaxy devices.
- Memory chip pricing recovered throughout 2025 as AI server deployments increased worldwide, benefiting Samsung’s semiconductor earnings.
- Samsung emphasized privacy, long-term software support, and connected-device experiences as competitive advantages for Galaxy AI during 2026.
Samsung Key Facts and Figures
- Samsung Electronics was founded in 1969 and has grown into one of the world’s largest electronics manufacturers.
- The company reported KRW 333.6 trillion in total sales during fiscal 2025.
- Operating profit increased to KRW 43.6 trillion in 2025 after reaching KRW 32.7 trillion in 2024.
- Samsung earned KRW 45.2 trillion in net income during 2025.
- The DX Division generated KRW 188.0 trillion in revenue during 2025.
- The Device Solutions (DS) division contributed approximately KRW 130.1 trillion in sales in 2025.
- Samsung Display recorded nearly KRW 29.8 trillion in annual revenue during 2025.
- Smartphone and related mobile products generated approximately KRW 126.5 trillion in revenue during 2025.
- Memory products contributed more than KRW 104 trillion in revenue during fiscal 2025.
Samsung Annual Revenue Statistics
- Samsung reported a record-high annual revenue of KRW 333.6 trillion for fiscal 2025.
- The company’s operating profit in 2025 surged to KRW 43.6 trillion, marking a 560% recovery from 2023.
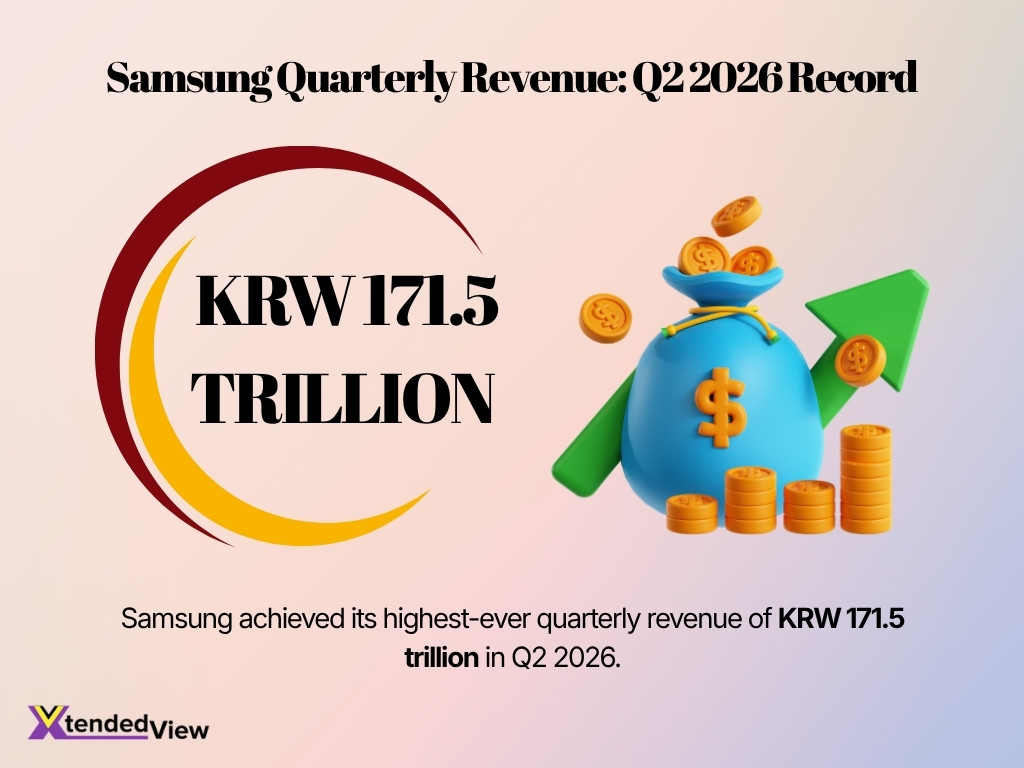
- Samsung achieved its highest-ever quarterly revenue of KRW 171.5 trillion in Q2 2026.
- The Q2 2026 operating profit broke records by hitting KRW 89.5 trillion, rising over 1,800% year-over-year.
- Driven by AI memory demand, the Q1 2026 operating profit soared 756% year-over-year to KRW 57.2 trillion.
- The semiconductor division alone generated KRW 127.5 trillion in revenue during Q2 2026.
- Samsung ranked #2 globally in semiconductor revenue at USD 72.544 billion with a 9.1% market share in 2025.
- Smartphone shipments reached 241.2 million units in 2025, securing a 19.1% global market share.
- Total R&D investments set a full-year record of KRW 37.7 trillion throughout 2025.
Samsung Operating Profit and Net Income
- Q1 2026 consolidated revenue reached an all-time high of KRW 133.9 trillion.
- Operating profit for Q1 2026 surged to a record KRW 57.2 trillion.
- First quarter net profit hit $31.7 billion, showing massive year-over-year growth.
- Q2 2026 revenue broke previous records by climbing to KRW 171.5 trillion.
- Operating profit in Q2 2026 jumped massively to KRW 89.5 trillion.
- Net profit for the second quarter increased significantly to KRW 71.6 trillion.
- The semiconductor division generated KRW 89.2 trillion in Q2 operating profit.
- Exceptional AI memory demand remained the primary driver of 2026 profitability.
- Q2 2026 operating profit alone exceeded the company’s total 2025 earnings.
Samsung Revenue by Business Segment
- Samsung’s DX (Device eXperience) division generated KRW 188.0 trillion in revenue during 2025, accounting for approximately 52% of total company sales.
- The DS (Device Solutions) division reported KRW 130.1 trillion in revenue in 2025, representing about 36% of Samsung’s annual revenue.
- Samsung Display (SDC) contributed KRW 29.8 trillion in sales during 2025, slightly higher than KRW 29.2 trillion in 2024.
- Harman generated KRW 15.8 trillion in revenue in 2025, up from KRW 14.3 trillion in 2024.
- The DX division remained Samsung’s largest revenue contributor, driven by smartphones, TVs, digital appliances, and network products.
- Semiconductor demand recovered strongly throughout 2025, allowing the DS division to increase revenue by roughly 17% year over year.
- Samsung Display maintained steady demand from OLED panels supplied to flagship smartphones and premium devices.
- Harman continued benefiting from growth in connected-car electronics, infotainment systems, and automotive software.
Samsung Revenue by Region
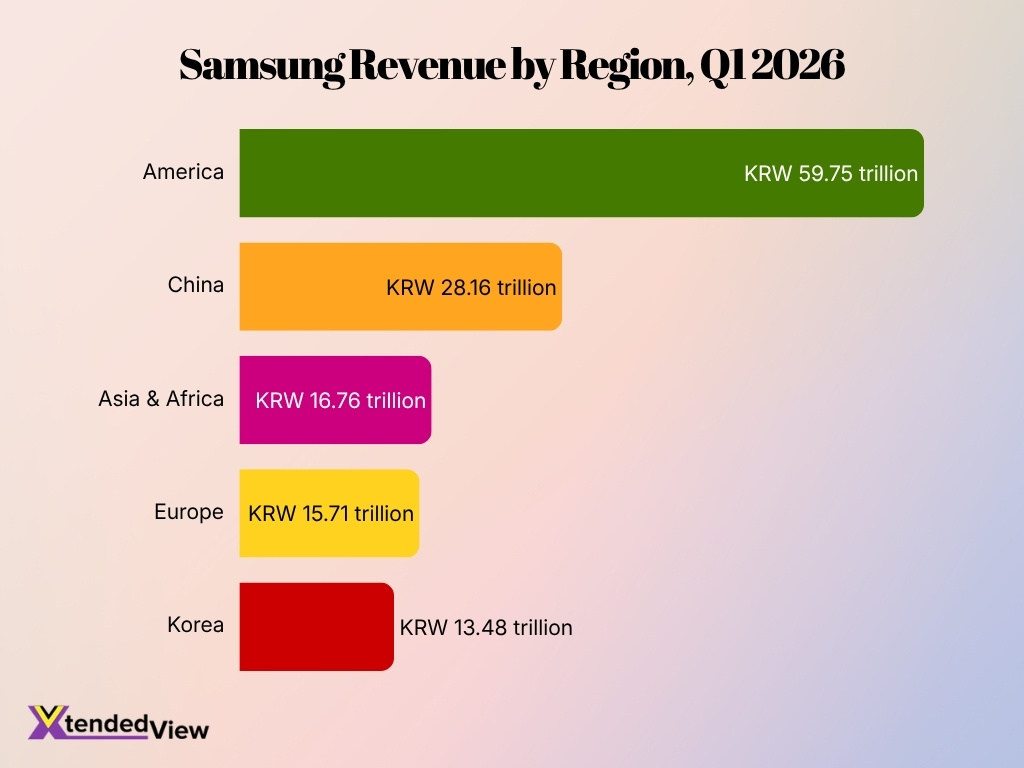
- America was Samsung’s largest revenue-generating region in Q1 2026, contributing KRW 59.75 trillion.
- China ranked second, generating KRW 28.16 trillion in revenue during the quarter.
- Samsung recorded KRW 16.76 trillion in revenue from the Asia & Africa region.
- Europe contributed KRW 15.71 trillion, placing it fourth among Samsung’s regional markets.
- Samsung’s home market, Korea, generated KRW 13.48 trillion, the lowest revenue among the listed regions.
- Revenue from America was more than double China’s, highlighting the importance of the American market to Samsung’s business.
- Combined revenue from America and China reached KRW 87.91 trillion, accounting for the majority of Samsung’s regional revenue.
- Across all listed regions, Samsung generated a total of KRW 133.87 trillion in Q1 2026.
Samsung Smartphone Sales and Shipments
- Samsung remained among the top 2 global smartphone vendors throughout 2025.
- Global smartphone shipments increased by approximately 2% in 2025 after recovering from previous declines.
- Samsung shipped an estimated 235 million smartphones worldwide during 2025.
- Premium Galaxy S-series devices boosted Samsung’s shipment performance by 17% in the first half of 2025.
- Galaxy A-series smartphones accounted for over 58% of Samsung’s highest-volume shipments across emerging markets.
- Samsung increased early 2025 shipments by 7% as manufacturers adjusted inventory ahead of potential tariff changes.
- AI-enabled Galaxy smartphones drove a 22% stronger replacement demand across various premium markets.
- Smartphone replacement cycles lengthening to 42 months remained a challenge despite improving premium-device demand.
Samsung Smartphone Market Share by Region
- Samsung maintained its lead across Europe with a 32.43% market share in 2025.
- North America delivered an 8% regional shipment increase for Samsung in Q1 2025.
- Japan saw a massive 29% smartphone market growth during Q1 2025.
- Samsung’s shipments in Japan increased by exactly 60% year-over-year in Q2 2025.
- Samsung successfully captured 10% of Japan’s smartphone shipments during Q2 2025.
- Asia-Pacific accounted for over 50% of global smartphone shipments in Q1 2025.
- Samsung secured a commanding 32.43% market share across South America in 2025.
- The company shipped 58 million smartphones globally during the second quarter of 2025.
- Samsung led the global smartphone market with a 20% overall share in Q1 2025.
Worldwide Smartphone Market Share by Vendor
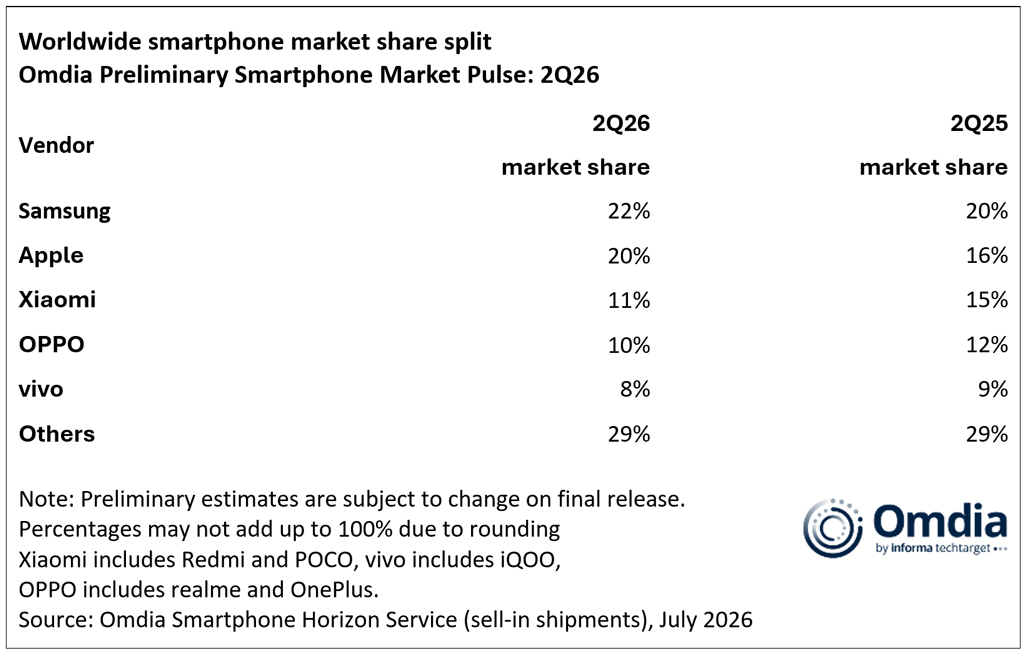
- Samsung led the global smartphone market in Q2 2026 with a 22% share, up from 20% in Q2 2025, representing a gain of 2 percentage points.
- Apple ranked second with a 20% market share, rising sharply from 16% a year earlier and recording the largest annual gain among the leading vendors.
- Apple narrowed its market-share gap with Samsung to just 2 percentage points in Q2 2026, compared with a 4-point gap in Q2 2025.
- Xiaomi’s global market share declined to 11%, down from 15% in Q2 2025, a significant drop of 4 percentage points year over year.
- OPPO accounted for 10% of worldwide smartphone shipments in Q2 2026, compared with 12% during the same quarter of 2025.
- vivo held an 8% global market share, slipping slightly from 9% in Q2 2025 and remaining the fifth-largest vendor in the ranking.
- Samsung and Apple together controlled 42% of the global smartphone market in Q2 2026, up from a combined 36% one year earlier.
- The top five smartphone vendors collectively represented 71% of the market, while other manufacturers accounted for the remaining 29% in Q2 2026.
- The Others category remained unchanged at 29%, suggesting that the biggest market-share shifts occurred primarily among the five leading smartphone vendors.
Samsung Galaxy Series Performance
- Samsung captured a 20% global smartphone market share during Q1 2025.
- The company successfully shipped 60.5 million smartphones globally in the first quarter of 2025.
- The Galaxy S25 series achieved a 5% year-over-year sales growth compared to its predecessor.
- The premium Galaxy S25 Ultra experienced a 7% sales increase over the older S24 Ultra model.
- Early sales data revealed the Galaxy S25 Ultra accounted for 5.08 million of the first 9.16 million total units sold.
- The Galaxy S25 lineup set a new domestic pre-order record with 1.3 million units in South Korea.
- Samsung’s mobile division generated KRW 37 trillion (around $26 billion) in sales during Q1 2025.
- The mobile division’s operating profits exceeded KRW 4.3 trillion (around $3.02 billion) for the quarter.
- Overall corporate net profit rose by 21.7% in Q1 2025, largely driven by the strong Galaxy S25 series performance.
Samsung Foldable Smartphone Statistics
- Samsung retains an estimated 50.0% global market share in the foldable smartphone segment entering 2026.
- Global foldable smartphone shipments are projected to experience a robust 21% year-over-year growth throughout 2026.
- Initial Galaxy Z8 pre-orders surged by more than 30% when directly compared to the previous generation’s launch.
- The latest Galaxy Z8 series successfully secured approximately 1.44 million pre-orders during its initial promotional window.
- Almost 50% of all total Galaxy Z8 pre-orders were specifically placed for the premium Galaxy Z Fold model.
- The book-style foldable units captured an impressive 62.31% of the total foldable market share during 2025.
- Compact flip-style foldable smartphones currently account for nearly 43% of the broader global foldable market share.
- The flagship Galaxy Z Fold 8 Ultra integrates advanced features while achieving a thin 4.1mm profile and weighing just 215 grams.
Global DRAM Market Share
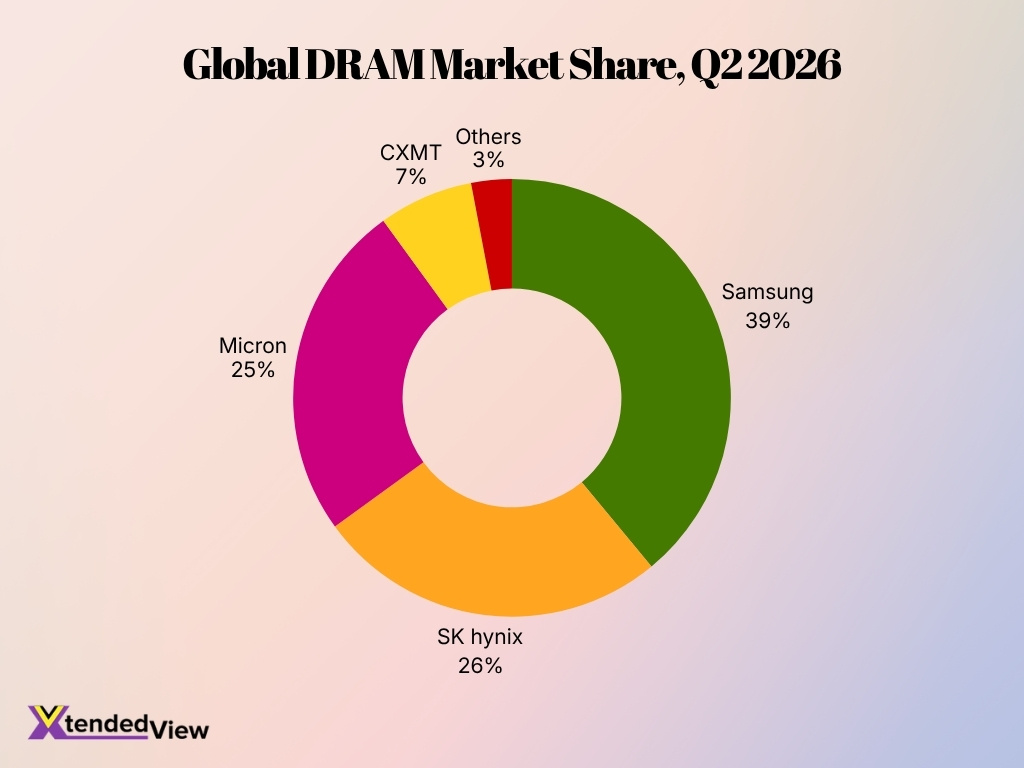
- Samsung dominated the global DRAM market in Q2 2026 with a 39% market share, maintaining a substantial lead over its competitors.
- SK hynix ranked second with a 26% share, trailing Samsung by 13 percentage points.
- Micron captured 25% of the DRAM market, placing it just 1 percentage point behind SK hynix.
- Together, Samsung, SK hynix, and Micron controlled 90% of the global DRAM market, highlighting the industry’s high concentration.
- CXMT accounted for 7% of the market, making it the largest player outside the three leading DRAM manufacturers.
- Other DRAM manufacturers collectively represented just 3% of the market, indicating limited share for smaller competitors.
- Samsung’s 39% share was 13 percentage points larger than SK hynix’s and 14 percentage points higher than Micron’s in Q2 2026.
Samsung Semiconductor and Memory Chip Statistics
- Samsung generated approximately KRW 130.1 trillion in revenue from its Device Solutions business during 2025.
- The company captured a 38% market share in the global DRAM market during the first quarter of 2026.
- Samsung maintained its top position in the NAND flash market with a 29% market share in early 2026.
- The company’s overall semiconductor revenue reached $72.5 billion, representing a 9.1% global market share in 2025.
- Samsung anticipates that 60% to 70% of future memory sales will stem from long-term AI infrastructure agreements.
- The operating profit for the Device Solutions division surged to KRW 24.9 trillion throughout 2025.
- Samsung introduced V10 Bonding V-NAND, which features over 400 layers and delivers 58% higher storage density.
- The Memory Business alone achieved KRW 104.1 trillion in sales, marking a 23% year-over-year increase in 2025.
- The company secured a 21% market share in the highly competitive High Bandwidth Memory (HBM) sector in Q1 2026.
- Research and development spending hit a record KRW 37.7 trillion in 2025, accounting for 11.3% of overall corporate sales.
Samsung Galaxy AI Statistics
- Samsung plans to expand Galaxy AI to 800 million mobile devices by the end of 2026.
- The company successfully integrated AI into 400 million devices globally during 2025.
- Around 70% of Galaxy S25 owners actively use various Galaxy AI features.
- Brand awareness for Samsung’s AI capabilities rapidly surged from 30% to 80%.
- An estimated 84% of owners engaged with AI tools within the past month.
- Samsung experienced a 42% increase in iOS users switching over due to Galaxy AI.
- More than 54% of new users frequently utilize the Circle to Search function.
- Usage of Google Gemini on the newest Galaxy smartphone lineups has tripled.
- Roughly 60% of modern consumers consider AI features a crucial factor in smartphone selection.
- Nearly 47% of individuals claim their daily routines rely heavily on mobile AI assistance.
Samsung Television and Premium TV Market Share Statistics
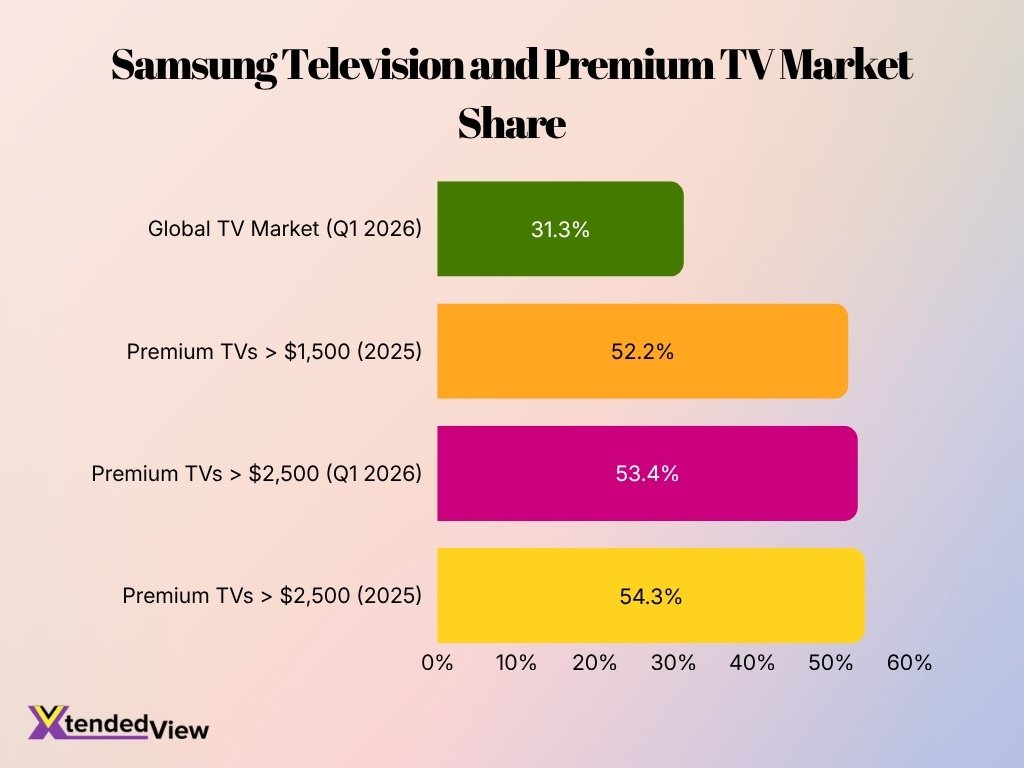
- Samsung held 31.3% of the global TV market in Q1 2026, giving the company nearly one-third of worldwide market share.
- In the premium TV category priced above $1,500, Samsung captured a substantial 52.2% market share in 2025.
- Samsung’s dominance was even stronger in the ultra-premium segment, with TVs priced above $2,500 accounting for a 53.4% market share in Q1 2026.
- During 2025, Samsung controlled 54.3% of the premium TV market above $2,500, meaning more than half of this high-end segment belonged to the brand.
- Samsung’s share of the >$2,500 TV segment declined slightly from 54.3% in 2025 to 53.4% in Q1 2026, a decrease of 0.9 percentage points.
- The figures show that Samsung’s competitive position is particularly strong in premium and high-priced televisions, where its market share exceeds 50%.
Samsung OLED and Display Panel Statistics
- Samsung Display generated approximately KRW 29.8 trillion in revenue during 2025.
- Smartphone OLED panel shipments increased from 780 million units in 2024 to 820 million units in 2025.
- OLED panels accounted for 51.0% of all smartphone displays shipped globally during 2025.
- Samsung Display’s smartphone panel revenue share reached 43.3% during 2025.
- The company’s estimated smartphone display revenue share increased to 47.3% in Q1 2026.
- Samsung continues investing heavily in QD-OLED technology for premium televisions and gaming monitors.
- The global large-display panel market is forecast to grow from 910 million units in 2025 to 940 million units in 2026.
- Samsung expects OLED adoption to continue expanding across flagship smartphones and premium display products during 2026.
Samsung Research and Development Spending
- Samsung invested a record KRW 37.7 trillion in research and development during 2025.
- R&D spending increased 7.8% year over year from approximately KRW 35 trillion in 2024.
- The company invested an additional KRW 52.7 trillion in facility expansion during 2025.
- The Device Solutions division received KRW 47.5 trillion to transition to advanced semiconductor processes.
- Samsung Display received an allocation of KRW 2.8 trillion to upgrade existing manufacturing lines.
- Samsung plans to invest KRW 20 trillion by 2030 into the new NRD-K semiconductor research complex.
- The new Giheung campus research facility covers an expansive area of 109,000 square meters.
- Third-quarter R&D spending alone hit a record-breaking high of KRW 8.87 trillion.
Frequently Asked Questions (FAQs)
Samsung reported KRW 333.6 trillion (approximately $240 billion) in annual revenue for fiscal 2025.
Samsung recorded KRW 43.6 trillion in operating profit during fiscal 2025.
Samsung captured 29.1% of the global TV market by revenue in 2025, maintaining its No. 1 position for the 20th consecutive year.
Samsung plans to expand Galaxy AI to 800 million AI-enabled mobile devices during 2026, up from about 400 million devices in 2025.
Samsung posted KRW 45.2 trillion in net income for fiscal 2025.
Conclusion
Samsung entered the year from a position of strength with record revenue, improving semiconductor profitability, expanding AI capabilities, and continued leadership in smartphones, televisions, and premium display technologies. Ongoing investments in Galaxy AI, advanced memory chips, OLED displays, and research and development reinforce the company’s long-term growth strategy. As demand for AI infrastructure and premium consumer devices continues to rise, Samsung remains well positioned to shape the future of the global technology industry.
