
Sales reflect a major shift in how businesses find, engage, and convert customers. Digital commerce continues to expand, AI is becoming embedded in prospecting and sales planning, and buyers are conducting more independent research before speaking with a representative. At the same time, sales teams face longer buying cycles, growing pressure to improve productivity, and stronger expectations for relevant, personalized interactions.
These changes affect both B2B and B2C organizations. Retailers are combining stores, mobile commerce and digital channels, while B2B companies increasingly rely on self-service purchasing, CRM systems, automation and AI-assisted selling. The following sales statistics highlight the most important developments in revenue growth, conversion performance, buyer behavior, sales technology and sales productivity.
Editor’s Choice
- $340.2 billion: Seasonally adjusted U.S. e-commerce sales reached this level in Q2 2026, rising 12.2% year over year.
- $6.88 trillion: Global retail e-commerce sales are projected to reach approximately this amount in 2026, compared with $6.42 trillion in 2025.
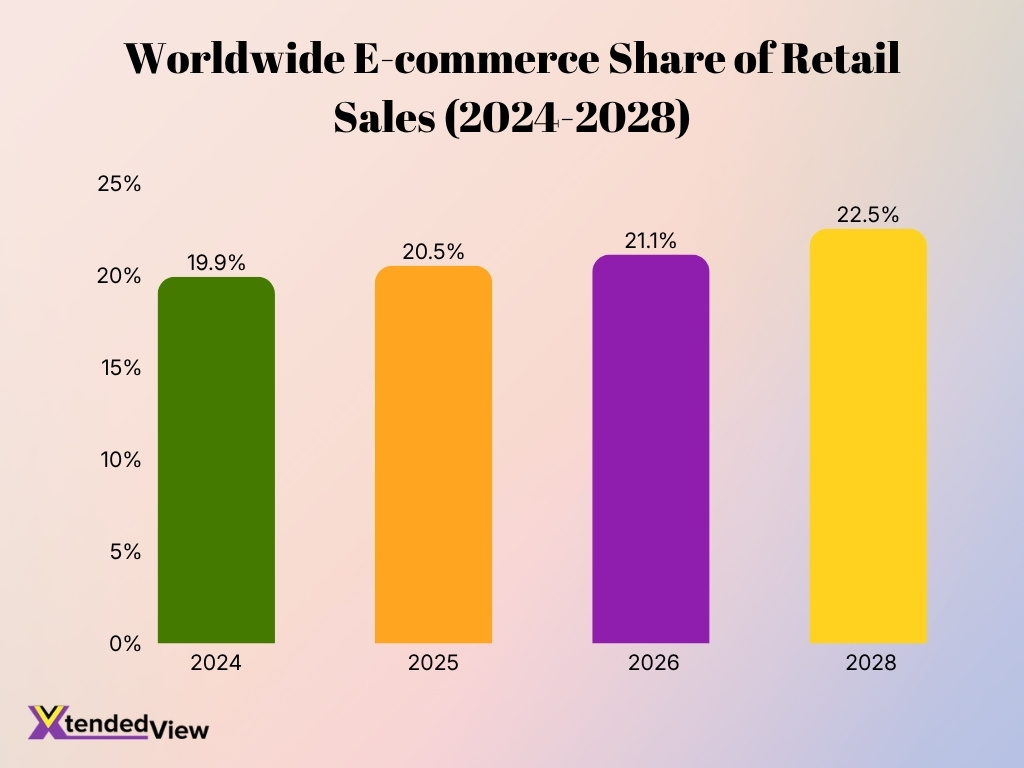
- 21.1%: E-commerce is projected to account for roughly this share of worldwide retail sales in 2026.
- $5.6 trillion: A 2026 industry forecast places U.S. retail sales at this level, representing 4.4% annual growth under that forecast’s retail definition.
- 94%: Sales leaders whose teams use AI agents say agents are essential to meeting business demands.
- 67%: B2B buyers surveyed for 2026 research said they would prefer a rep-free purchasing experience.
- 45%: B2B buyers surveyed in 2025 reported using generative AI during a recent purchase, showing that AI now influences the buyer side of the sales process as well.
Recent Developments
- 94% of sales leaders using AI agents say the technology has become essential for meeting business demands.
- 88% of sales representatives using AI agents say the tools improve their chances of achieving sales targets.
- High-performing teams are 1.7 times more likely than underperforming teams to use AI prospecting agents.
- Sales organizations expect AI agents to reduce research time by approximately 34% and content-creation time by 36%.
- 57% of sales professionals say sales cycles are getting longer, creating more pressure to keep opportunities moving through the pipeline.
- Sales representatives report spending about 60% of their working time on non-selling tasks, including administrative work, internal approvals, and data entry.
- 94% of surveyed sales teams reported using partner selling in 2026 research, up from 86% in the previous study period.
- Partner-selling teams have also become more technology-dependent: 90% of sales professionals working with partners use dedicated tools to support those relationships.
Global Sales Statistics
- Worldwide retail sales were previously forecast to rise from approximately $32.4 trillion in 2025 to $33.7 trillion in 2026, an increase of about 3.8%.
- Global retail e-commerce sales were forecast to total $6.419 trillion in 2025, growing 6.8% year over year.
- The corresponding global e-commerce forecast rises to approximately $6.88 trillion in 2026, representing roughly 7.2% annual growth.
- E-commerce accounted for an estimated 20.5% of worldwide retail sales in 2025, compared with 19.9% in 2024.
- The worldwide e-commerce share is projected to reach about 21.1% in 2026 and 22.5% by 2028.
- China, the U.S. and Western Europe together generated more than $5.17 trillion in online retail sales in 2025, accounting for most global e-commerce spending.
- Seven national markets were projected to exceed $100 billion in annual e-commerce sales in 2025, demonstrating that large digital retail markets now extend beyond the two biggest economies.
- Updated 2025 projections placed retail sales growth at approximately 1.5% in the U.S., 3% in Western Europe, and 3.8% in China, illustrating increasingly similar growth rates across these large markets.
E-commerce Sales Statistics
- U.S. retail e-commerce generated $340.2 billion in Q2 2026 after seasonal adjustment, a 3.8% increase from Q1.
- Compared with Q2 2025, U.S. online retail sales grew 12.2% in Q2 2026, nearly twice the 6.7% growth rate for total retail sales.
- On an unadjusted basis, Q2 2026 U.S. e-commerce sales totaled $329.5 billion, 12.4% higher than a year earlier.
- In 2025, U.S. online retail sales totaled about $1.234 trillion, compared with approximately $1.170 trillion in 2024.
- That represented 5.4% U.S. e-commerce growth in 2025, making it the fourth consecutive year in which annual online growth remained in the single digits.
- Fourth-quarter 2025 U.S. e-commerce sales reached approximately $365.17 billion, exceeding $350 billion in a quarter for the first time.
- U.S. consumers spent $257.8 billion online during November and December 2025, up 6.8% from $241.4 billion during the same 2024 holiday period.
- Mobile devices generated 56.4% of U.S. online holiday transactions in 2025, emphasizing the importance of mobile checkout and product discovery.
- The five-day Thanksgiving-through-Cyber-Monday period generated $44.2 billion in U.S. e-commerce sales in 2025, including $14.25 billion on Cyber Monday alone.
Retail Sales Statistics
- A major 2026 retail forecast projects U.S. annual retail sales of $5.6 trillion, representing 4.4% growth over 2025 under its defined retail categories.
- That projected 4.4% growth rate exceeds the roughly 3.6% average annual growth recorded over the previous decade when the unusual 2020-2022 pandemic period is excluded.
- U.S. retail and food-services sales reached $763.6 billion in July 2026, adjusted for seasonal and calendar effects.
- July 2026 sales were 5% higher than July 2025, even though they declined 0.6% from June 2026.
- Combined U.S. retail and food-services sales for May through July 2026 rose 6.3% year over year.
- Total U.S. retail sales for Q2 2026 reached $1.9865 trillion, 2.9% above Q1 on a seasonally adjusted basis.
- Q2 2026 total retail sales increased 6.7% from Q2 2025, compared with 12.2% growth for e-commerce during the same period.
- U.S. retail sales totaled approximately $7.52 trillion in 2025 under a broader annual measure, representing roughly 3.5% growth from 2024.
- The 2025 U.S. holiday season exceeded $1 trillion in retail sales, providing retailers with one of the largest concentrated sales periods of the year.
B2B Buyer Behavior & Expectations Statistics
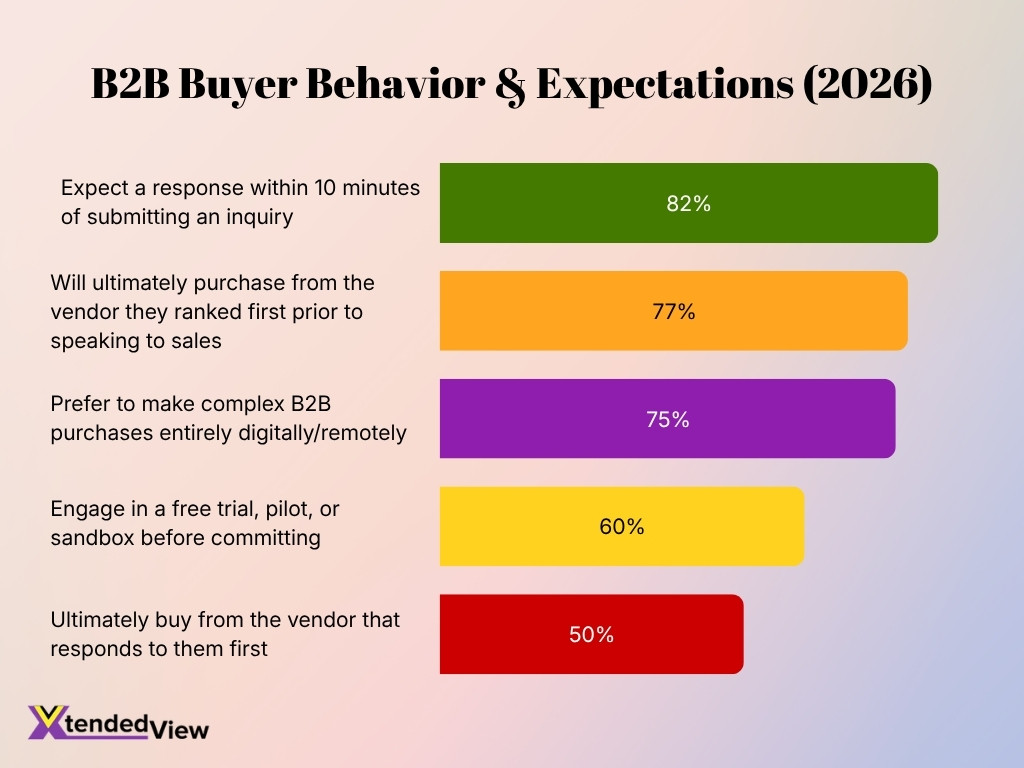
- 82% of B2B buyers expect a response within 10 minutes of submitting an inquiry, highlighting the importance of rapid sales follow-up.
- 77% of buyers ultimately purchase from the vendor they ranked first before speaking with sales, showing how strongly early brand preference influences purchasing decisions.
- 75% of B2B buyers prefer to complete even complex purchases digitally or remotely, reflecting the growing demand for self-service buying experiences.
- 60% of buyers engage with a free trial, pilot, or sandbox before committing, making hands-on product evaluation an important part of the B2B buying journey.
- 50% of buyers ultimately purchase from the vendor that responds first, demonstrating the competitive advantage of faster lead response times.
B2B and B2C Sales Statistics
- U.S. manufacturing and wholesale distribution sales reached approximately $15.12 trillion in 2025, up 0.4% from 2024.
- U.S. B2B sales growth slowed sharply after the post-pandemic rebound: sales increased 14.3% in 2021 and 14.5% in 2022, compared with just 0.4% in 2025.
- From 2022 through 2025, U.S. manufacturing and distribution sales increased only 1.8% cumulatively, even as digital B2B transactions continued expanding.
- In 2025 research, 61% of B2B buyers preferred an overall rep-free buying experience, indicating a strong shift toward independent digital research.
- That preference increased to 67% in 2026 research, while 70% of surveyed buyers said they preferred a completely digital self-service experience.
- 45% of B2B buyers said they used generative AI during a recent purchase, primarily to research vendors and products.
- B2B buyers consulted an average of seven information sources during their recent purchase process, showing how fragmented modern product and vendor research has become.
- Despite growing self-service adoption, 69% of B2B buyers preferred to have sales representatives validate information generated by AI.
- Trust remains split between automated and human information: 51% of buyers said they were more likely to encounter misleading information from generative AI, while 49% said the same about sales representatives.
- High-value B2B digital buying is also becoming more common: 39% of business buyers in prior research said they were comfortable placing self-service orders above $500,000, up from 28% two years earlier.
Sales Revenue and Growth Statistics
- 76% of sales leaders say usage-based pricing matters more to customers than it did a year earlier, indicating stronger demand for pricing tied to measurable consumption.
- Usage-based pricing ranked as the No. 1 revenue model contributing to growth among sales professionals using the model in 2026.
- However, 40% of sales professionals using usage pricing identify revenue forecasting as a major challenge because customer consumption can fluctuate.
- Partner selling expanded to 94% of sales teams in 2026, up from 86% in the previous study, making indirect selling an increasingly common growth strategy.
- Among sales professionals working with partners, 90% use dedicated technology to manage or support their partner ecosystem.
- Only 40% of partners have full access to a company’s AI tools, leaving a sizable gap between internal and external sellers’ access to sales intelligence.
- Sales planning ranked as the No. 2 growth tactic across industries in 2026, behind investment in AI.
- 91% of sales professionals say AI benefits sales planning, including scenario modeling and evaluation of different revenue strategies.
- As a current technology-sector example, one major enterprise software provider reported 11% quarterly revenue growth to $11.35 billion in its latest 2026 quarter, reflecting continuing demand for cloud and AI-focused business software.
B2B Sales Conversion Rates by Industry
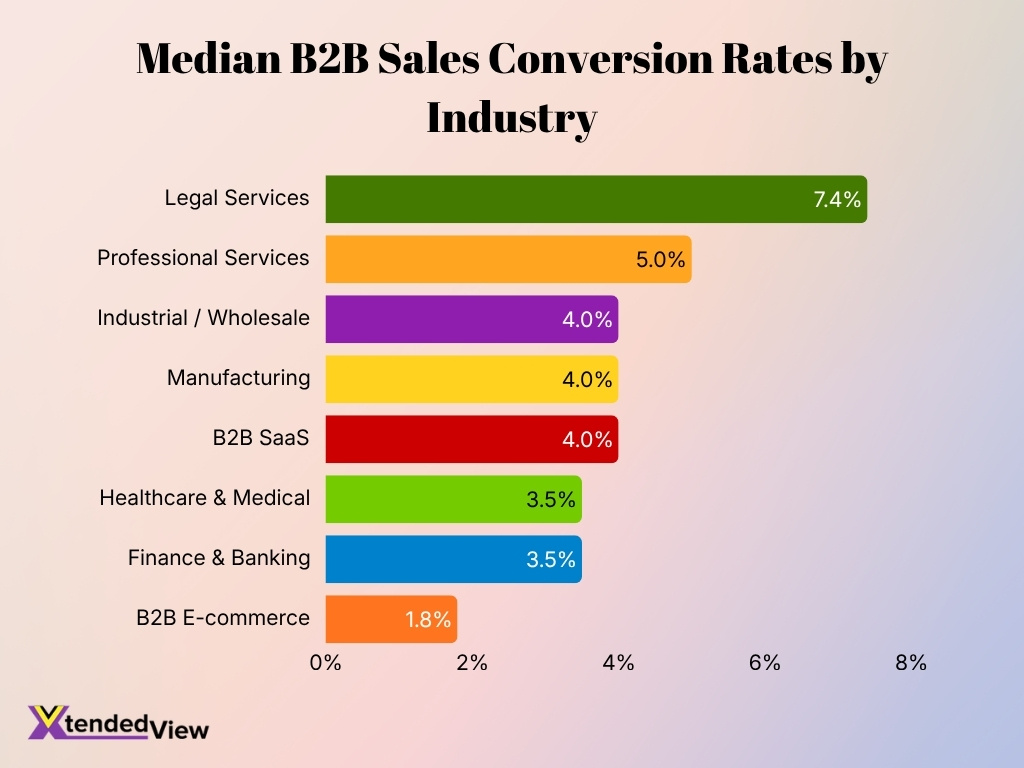
- Legal services lead B2B conversion rates at 7.4%, making them the strongest-performing industry in the dataset.
- Professional services record a 5.0% conversion rate, ranking second and trailing legal services by 2.4 percentage points.
- Industrial/wholesale, manufacturing, and B2B SaaS each convert at 4.0%, indicating similar sales performance across these sectors.
- Healthcare and medical businesses average a 3.5% conversion rate, slightly below the 4.0% benchmark seen across several B2B industries.
- Finance and banking also post a 3.5% conversion rate, matching healthcare and medical businesses.
- B2B e-commerce has the lowest conversion rate at 1.8%, less than half the 4.0% rate recorded by B2B SaaS and manufacturing.
- The gap between the highest and lowest industries is 5.6 percentage points, with legal services converting at more than 4 times the rate of B2B e-commerce.
- Overall, the data shows that B2B conversion rates vary substantially by industry, ranging from just 1.8% to 7.4%.
Sales Performance and Conversion Rate Statistics
- Analysis of 41,000 landing pages, 464 million page views, and 57 million conversions found a median landing-page conversion rate of 6.6% across industries.
- SaaS landing pages recorded a 3.8% median conversion rate, illustrating how conversion performance can fall below the cross-industry median for complex software purchases.
- A 2025 B2B benchmark compilation placed average lead-to-MQL conversion at approximately 31%.
- Typical B2B MQL-to-SQL conversion ranged from 13% to 21%, while organizations with aligned lead definitions and shared CRM dashboards exceeded 30% in the cited benchmarks.
- Approximately 30% to 59% of sales-qualified leads converted into opportunities, although performance varied significantly by lead source.
- The average B2B opportunity win rate fell to approximately 19% in 2025, compared with 29% in 2024 in one benchmark series.
- Top-performing B2B organizations can achieve 30% or higher win rates, showing the performance gap between average and leading sales organizations.
- B2B lead-to-customer conversion commonly falls within a 2% to 5% range, while enterprise software may operate closer to 1% to 3% because of longer and more complex buying cycles.
- Qualified-lead-to-opportunity conversion commonly ranges from 15% to 25%, while proposal-to-closed-deal conversion can reach 25% to 40%, depending on industry and market position.
Sales Team and Sales Rep Performance Statistics
- Sales representatives spend 60% of their working time on non-selling activities, including CRM updates, internal approvals, and searching for sales materials.
- 72% of sellers say they feel overwhelmed by the number of skills their roles require.
- Sellers who work with AI sales tools are 3.7 times more likely to meet quota than sellers who do not, according to research cited in the 2026 sales study.
- 85% of sales representatives using AI agents say the technology frees them to concentrate on higher-value work.
- 82% of representatives say AI creates opportunities for career growth rather than simply automating parts of their jobs.
- Coaching remains strongly associated with target attainment: 75% of sellers say they are more likely to hit targets when they have a coach or mentor.
- 36% of sales teams using AI agents already use agents for coaching, including role-playing and real-time feedback.
- High-performing sellers are 3.2 times more likely than underperformers to participate in an external sales community.
- 81% of sales representatives say participating in a sales community improves their job performance.
B2B Sales Cycle Length by Deal Size
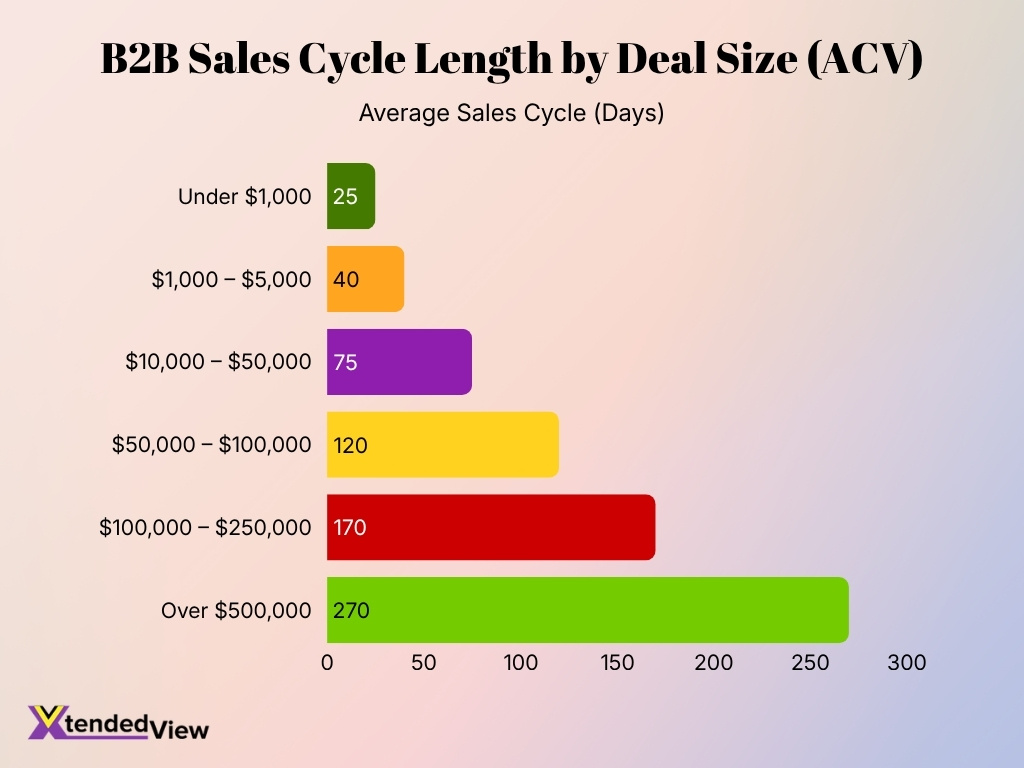
- B2B sales cycles become significantly longer as deal value rises, increasing from just 25 days for deals under $1,000 to 270 days for deals worth over $500,000.
- Deals valued between $1,000 and $5,000 take an average of 40 days to close, showing that smaller contracts typically move through the pipeline relatively quickly.
- Mid-sized deals between $10,000 and $50,000 require around 75 days, or roughly 2.5 months, to complete the sales cycle.
- For deals worth $50,000 to $100,000, the average sales cycle increases to 120 days, equivalent to approximately four months.
- Larger contracts between $100,000 and $250,000 take about 170 days, or nearly six months, to move from initial engagement to closing.
- Enterprise-scale deals exceeding $500,000 have the longest sales cycle at 270 days, or approximately nine months.
- Overall, the data shows a strong relationship between higher ACV and longer sales cycles, with deals above $500,000 taking more than 10 times longer to close than deals below $1,000.
Sales Pipeline and Sales Cycle Statistics
- 57% of sales professionals say their sales cycle is getting longer, making pipeline velocity a central performance concern in 2026.
- 73% of B2B buyers actively avoid sellers who send irrelevant outreach, increasing the cost of poorly targeted prospecting.
- Sales representatives spend nearly one full workday per week prospecting, showing how much capacity pipeline creation requires.
- Despite that investment, 48% of sales representatives say they lack enough bandwidth to conduct adequate cold outreach.
- 55% of sales professionals use AI for prospecting, making prospect identification and outreach one of the clearest current AI applications in sales.
- High-performing teams are 1.7 times more likely than underperforming teams to use AI prospecting agents.
- In one deployment example, an AI-assisted prospecting program generated 3,200 opportunities in four months by working lower-scored leads that previously received limited attention.
- A 2025 B2B benchmark placed average opportunity-to-close performance at approximately 20% to 21%, meaning most qualified pipeline still does not become booked revenue.
- As win rates have tightened, B2B organizations increasingly target 3.1 to four times quota in pipeline coverage, while some enterprise teams target five times quota or more.
Sales Forecast and Quota Statistics
- 88% of representatives using AI agents say the technology improves their chances of reaching sales targets.
- Sales professionals working with AI tools are 3.7 times more likely to meet quota, reinforcing the growing relationship between AI adoption and seller performance.
- 91% of sales professionals say AI improves sales planning, including revenue modeling and scenario analysis.
- Forecasting becomes more difficult under consumption-based business models: 40% of sales professionals using usage pricing identify revenue forecasting as a top challenge.
- 76% of representatives want greater transparency into how their sales compensation gets calculated, connecting quota management with trust in incentive systems.
- Meanwhile, 32% of sales leaders say their current technology stacks lack compensation-management capabilities.
- Sellers overwhelmed by excessive technology are 45% less likely to attain quota, showing that adding software does not automatically improve forecasted performance.
- In a CRM-verified 2026 benchmark, median account executive quota attainment stood at 67%, with SMB representatives recording 72%, midmarket representatives 65%, and enterprise representatives 58%.
- In the same dataset, top-quartile SMB sellers reached 105% median quota attainment, compared with 98% for midmarket sellers and 92% for enterprise sellers.
Sales Technology, CRM, and Automation Statistics
- Sellers use an average of eight tools to close deals, illustrating how fragmented the modern sales workflow has become.
- 42% of sales representatives say they feel overwhelmed by the number of tools they must use.
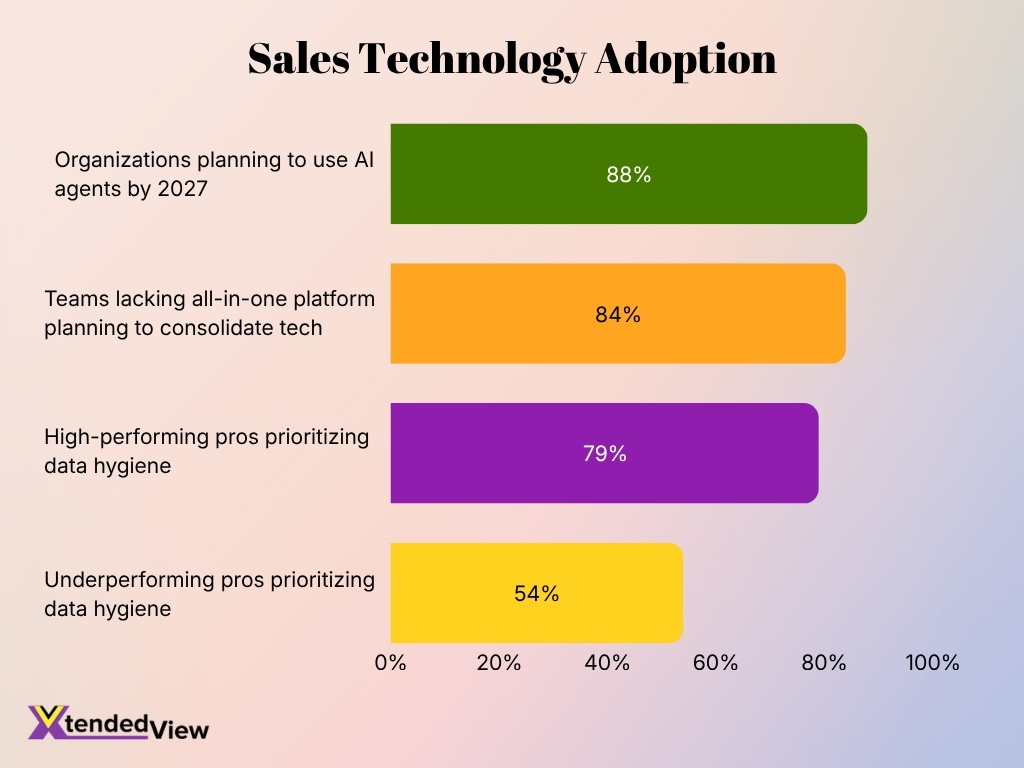
- Among sales teams without an all-in-one platform, 84% plan to consolidate technology, signaling a shift toward simpler sales stacks.
- 74% of sales teams using AI prioritize data hygiene because inaccurate or incomplete records can reduce the quality of automated recommendations.
- High-performing sales professionals show an even stronger focus on clean data: 79% prioritize data hygiene, compared with 54% of underperformers.
- Sales leaders estimate that 19% of company data remains inaccessible, restricting customer visibility and personalization.
- 51% of sales professionals say data-security concerns can stop AI initiatives from moving forward.
- Another 51% of sales leaders using AI say technology silos delay or limit their AI initiatives.
- 88% of sales organizations plan to use AI agents by 2027, indicating that agent-based automation is moving rapidly toward mainstream sales adoption.
- Looking further ahead, AI agents could outnumber human sellers 10-to-1 by 2028, yet fewer than 40% of sellers are expected to say agents improved their productivity unless companies address data, workflow, and user-experience problems.
AI in Sales Statistics
- 87% of sales organizations reported using AI in 2026, showing that adoption has moved well beyond early-stage experimentation.
- 54% of sales organizations had already used AI agents by February 2026, while 88% expected to use them by 2027.
- AI tools save sellers an average of 4.8 hours per week, creating nearly five additional hours of potential selling capacity.
- However, 72% of sales organizations report low reinvestment of AI-generated time savings into higher-value sales activities, limiting the commercial effect of automation.
- Sales organizations that provide AI-enabled next-best-action recommendations are 2.6 times more likely to achieve commercial growth.
- Organizations that prioritize seller AI upskilling are 2.4 times more likely to achieve strong revenue growth than organizations that do not.
- AI-referred visitors to U.S. retail websites converted 31% more often than visitors from other traffic sources during the 2025 holiday season.
- Revenue per visit from AI-driven retail traffic increased 254% during the 2025 holiday period, indicating that AI referrals can carry stronger purchase intent.
- Retailers using AI agents were growing online sales at approximately four times the rate of retailers not using agents in August 2026 data.
- Looking ahead, AI agents are projected to outnumber human sellers 10-to-1 by 2028, although fewer than 40% of sellers are expected to report productivity improvements unless organizations redesign their underlying systems.
Sales Productivity and Enablement Statistics
- AI currently saves sellers an average of 4.8 working hours each week, equivalent to roughly 12% of a standard 40-hour workweek.
- Despite those savings, nearly three-quarters of sales organizations fail to redirect the recovered capacity toward activities such as customer engagement or strategic account development.
- Once AI agents are fully implemented, sellers expect prospect research time to decline by 34%.
- Sellers also expect AI agents to reduce email and content-drafting time by 36%, potentially shifting more working hours toward direct customer interaction.
- Top-performing sales teams are 1.7 times more likely to use AI prospecting agents than struggling teams.
- Organizations offering AI-enabled next-best actions are 160% more likely to achieve commercial growth than those without comparable guidance.
- AI-focused seller upskilling is associated with a 2.4-times greater likelihood of strong revenue growth.
- 60% of chief sales officers say their revenue number is largely influenced by factors outside their control, illustrating why productivity gains do not automatically translate into equivalent sales growth.
- By 2028, organizations that overhaul their data, automation and user experience are projected to be five times more likely to generate AI ROI than organizations relying primarily on quick technology fixes.
Sales Channels and Omnichannel Sales Statistics
- The average B2B buyer now uses 10 interaction channels during the purchasing journey, compared with approximately five channels in 2016.
- 42% of B2B decision-makers report using more than 11 separate touchpoints while buying from suppliers.
- 71% of B2B companies offer some form of e-commerce, demonstrating how online purchasing has become part of mainstream business selling.
- Among B2B companies offering e-commerce, approximately one-third of revenue now comes through digital commerce channels.
- Across consumer commerce, 8 in 10 online purchase journeys involve multiple touchpoints rather than a single interaction.
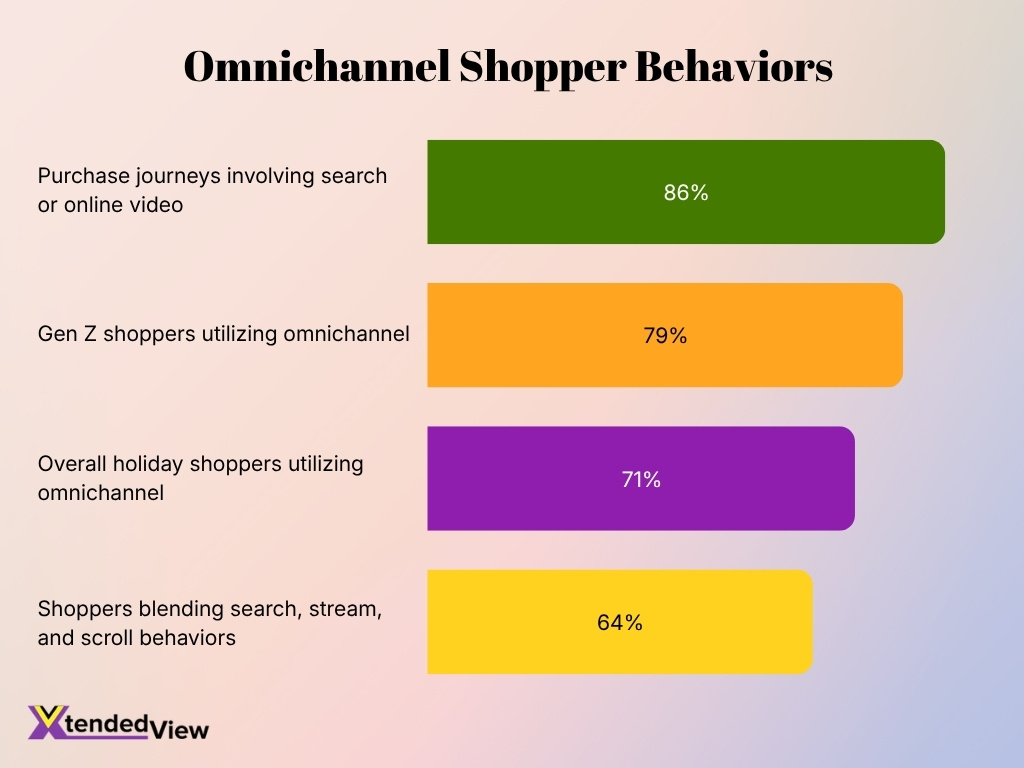
- During the 2025 U.S. holiday season, 71% of shoppers were omnichannel, rising to 79% among Gen Z shoppers.
- Most shoppers encounter at least five online touchpoints before purchasing, illustrating the difficulty of attributing a sale to one interaction alone.
- Search or online video appears in 86% of those multi-touch shopping journeys, making discovery and research channels influential well before checkout.
- In 2025 research, 64% of U.S. holiday shoppers said searching, streaming, scrolling, and shopping behaviors blended together during their purchase journeys.
- Mobile devices generated a record 56.4% of online U.S. holiday revenue in 2025, confirming that omnichannel strategies increasingly need a mobile-first transaction experience.
Social Selling and Sales Outreach Statistics
- 82% of B2B buyers say creator content influences their purchase decisions, indicating that expert voices can affect commercial consideration.
- Nearly 80% of B2B buyers engage with creator-generated business content at least monthly.
- 59% of buyers say creator content helps them discover new brands, extending social influence into the earliest stage of the sales funnel.
- Another 67% of buyers say creator content helps them evaluate potential solutions during the consideration process.
- After consuming creator content, 47% of buyers reported visiting a vendor’s website, creating a measurable bridge between social engagement and commercial research.
- 38% of buyers said creator content prompted them to engage directly with a sales team.
- Strong thought leadership makes 95% of hidden B2B decision-makers more open to sales and marketing outreach.
- During an RFP process, 79% of hidden decision-makers say they are more likely to advocate for a company that consistently produces high-quality thought leadership.
- By contrast, 73% of B2B buyers actively avoid suppliers that send them irrelevant sales outreach, illustrating the downside of high-volume, poorly personalized prospecting.
- Millennials and Gen Z now represent 71% of B2B buyers, increasing the importance of digital and social touchpoints within business purchasing.
Buyer Behavior and Sales Decision-Making Statistics
- A global 2025 study of nearly 4,000 B2B buyers found the average buying cycle declined from 11.3 months in 2024 to 10.1 months in 2025.
- Buyers made first contact with sellers around 61% of the way through the purchase journey in 2025, compared with 69% previously, bringing conversations forward by roughly six to seven weeks.
- 95% of winning vendors were already included on the buyer’s initial shortlist at the start of the purchasing process.
- Buyers evaluated an average of 5.1 vendors, but they already had previous experience with approximately 3.8 of them.
- 94% of buying groups ranked their shortlist by preference before speaking with sellers, showing how much vendor preference forms before direct sales interaction.
- The vendor ranked first before direct engagement ultimately won 77% of purchases, making early brand preference a powerful predictor of the final decision.
- 94% of surveyed B2B buyers used large language models somewhere in their buying process in 2025, commonly to compare and synthesize vendor information.
- Despite widespread AI use, buyers still averaged 16 interactions per person with the winning vendor, virtually unchanged from 2023 and only one fewer than 2024.
- 67% of B2B buyers preferred a rep-free buying experience in 2026 research, while 70% preferred a completely digital self-service experience.
- Yet 69% of buyers wanted sales representatives to validate AI-generated information, showing that digital autonomy and human guidance now coexist rather than compete outright.
Frequently Asked Questions (FAQs)
U.S. retail e-commerce sales reached $340.2 billion in Q2 2026, increasing 12.2% year over year and accounting for 17.1% of total retail sales.
U.S. retail and food-service sales totaled $763.6 billion in July 2026, up 5% from July 2025 but down 0.6% from June 2026.
67% of B2B buyers prefer a rep-free experience, while 45% reported using AI during a recent purchase.
AI saves sellers approximately 4.8 hours per week, although 72% of sales organizations report low reinvestment of those time savings into higher-value activities.
The average B2B buying cycle declined from 11.3 months in 2024 to 10.1 months in 2025, a reduction of 1.2 months, while first seller contact moved from 69% to 61% of the buying journey.
Conclusion
Sales statistics show a market shaped by digital self-service, AI-assisted selling, omnichannel buying and increasingly informed customers. Buyers now use more research sources and digital touchpoints before making decisions, while sales organizations are investing in automation, better data and AI tools to improve prospecting, forecasting and productivity.
However, technology alone does not guarantee stronger sales performance. The most effective organizations combine accurate customer data, relevant outreach, clear sales processes and human expertise with automation. As buying journeys continue to become more digital and interconnected, companies that balance efficiency with credible, personalized customer engagement will be better positioned to improve conversion rates, strengthen revenue growth and compete across both B2B and consumer markets.