Facebook remains one of the world’s largest advertising platforms, helping brands reach billions of users through personalized ads, video campaigns, and social commerce experiences. Retailers use Facebook ads to drive online sales, while local businesses rely on them to generate leads and build community engagement. As Meta continues to invest heavily in AI-driven advertising tools, Facebook advertising has become more automated and performance-focused than ever before. Explore the latest numbers to understand how marketers, agencies, and brands are using Facebook advertising.
Editor’s Choice
- Meta is projected to generate $243.46 billion in global advertising revenue in 2026, overtaking Google for the first time and capturing 26.8% of worldwide ad spending.
- Meta generated $200.97 billion in total revenue in 2025, up 22.2% year over year, with advertising accounting for the overwhelming majority of revenue.
- Facebook has approximately 3.07 billion monthly active users globally, maintaining its position as the world’s largest social network.
- Facebook’s advertising reach reached an estimated 2.41 billion users in 2026, adding more than 130 million reachable users from the previous year.
- Facebook records roughly 2.11 billion daily active users, meaning nearly seven out of every 10 monthly users access the platform daily.
- Meta’s fourth-quarter 2025 advertising revenue climbed to $58.14 billion, a 24.3% increase from the previous year.
- Advertisers currently generate an average return of $4.13 for every $1 spent on Meta ads, representing a 25% improvement compared with 2022 performance levels.
Recent Developments
- Meta unveiled a new end-to-end AI advertising suite in 2026, enabling automated campaign creation, testing, and optimization.
- Meta’s AI-powered advertising tools now provide an average advertiser return of 4.13x ROAS, up 25% from 2022.
- Click-to-message ad revenue in the United States grew by more than 50% year over year during Q4 2025.
- Paid messaging on WhatsApp surpassed a $2 billion annual revenue run rate in late 2025, creating a new monetization stream for Meta’s advertising ecosystem.
- Meta plans to spend between $115 billion and $135 billion in capital expenditures during 2026, much of it aimed at AI infrastructure supporting advertising products.
- Meta expanded its creator marketplace to include Facebook creators, making influencer partnerships easier for advertisers and agencies.
- The company introduced enhanced AI translation and text-generation features to improve multilingual advertising campaigns.
- Meta’s advertising business remains its growth engine, with executives calling ads the company’s most important revenue driver for the next several years.
- Meta experienced a temporary decline of 20 million daily users in early 2026, highlighting the importance of innovation and user retention.
Overview of Facebook Advertising
- Facebook remains the world’s largest social media platform with more than 3 billion monthly active users.
- More than 2.11 billion people use Facebook daily, providing advertisers with enormous recurring exposure opportunities.
- Facebook’s ad platform can now reach approximately 2.41 billion users worldwide.
- Advertising contributed roughly 97% of Meta’s fourth-quarter 2025 revenue, underlining Facebook’s dependence on ad income.
- Facebook and WhatsApp each have more than 2 billion daily active users, creating cross-platform advertising opportunities.
- Around 68.7% of Facebook’s monthly users visit daily, one of the highest engagement ratios among major social networks.
- Facebook users receive a median of 70 advertisements per week, according to academic research into platform advertising exposure.
- Ads account for roughly 10% to 15% of all content displayed in users’ news feeds.
- A mere 1% increase in ad density could generate an estimated additional $8.17 million in weekly revenue for Facebook.
Facebook Ad Revenue Growth
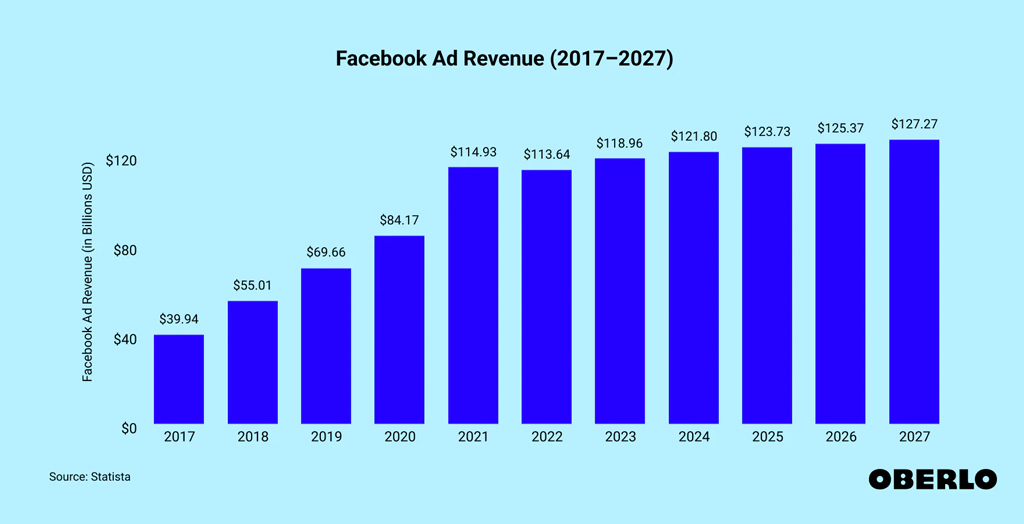
- Facebook ad revenue increased from $39.94 billion in 2017 to $127.27 billion in 2027, more than tripling over the period.
- Revenue climbed from $39.94 billion in 2017 to $55.01 billion in 2018, reflecting strong year-over-year growth.
- 2019 recorded $69.66 billion in ad revenue, crossing the $60 billion milestone.
- In 2020, Facebook generated $84.17 billion, despite global economic uncertainty.
- Revenue surged to $114.93 billion in 2021, marking the largest annual increase in the chart.
- 2022 experienced a slight decline to $113.64 billion, the only year with negative growth shown.
- Ad revenue recovered to $118.96 billion in 2023, returning to an upward trend.
- 2024 revenue reached $121.80 billion, surpassing the $120 billion mark for the first time.
- Facebook ad revenue is projected to grow to $123.73 billion in 2025.
- Forecasts indicate revenue will reach $125.37 billion in 2026 and $127.27 billion in 2027, reflecting steady long-term growth.
Usage and Reach Statistics of Facebook Ads
- Facebook ads can reach approximately 2.41 billion people globally in 2026, equal to nearly one-third of the world’s population.
- Facebook has 3.07 billion monthly active users, giving advertisers one of the largest addressable audiences online.
- The platform attracts 2.11 billion daily active users, creating high-frequency advertising opportunities.
- Facebook’s audience penetration rate reached 71.43% in 2025, up from 70% in 2020.
- Facebook’s audience penetration is expected to rise to 75.79% by 2027.
- India remains Facebook’s largest market with 581.6 million users, while the United States has about 253.6 million users.
- More than 80% of Meta’s monthly users engage with one of its apps every day, highlighting exceptional user stickiness.
- Approximately 70.44% of all internet users worldwide access a Meta-owned platform every month.
- Nearly 49% of the global population uses one of Meta’s platforms every month, providing advertisers with unprecedented reach.
ROI Statistics of Facebook Advertising
- Businesses earn an average of $4.13 in revenue for every $1 spent on Meta ads, up 25% compared with 2022.
- Around 89% of marketers report that Facebook ads deliver a positive return on investment when campaigns use audience segmentation and conversion tracking.
- The median return on ad spend (ROAS) for Facebook campaigns ranges between 2x and 4x, depending on industry and campaign objectives.
- Retail advertisers frequently achieve ROAS above 4.5x during major shopping periods such as Black Friday and Cyber Monday.
- Facebook retargeting campaigns can improve conversion rates by up to 70% compared with campaigns targeting cold audiences.
- Businesses using Meta’s Advantage+ shopping campaigns have reported an average 22% reduction in cost per acquisition (CPA).
- More than 60% of marketers identify Facebook and Instagram ads as their highest-performing paid social channels for revenue generation.
- Companies that combine Facebook ads with email marketing campaigns generate 24% higher conversion rates than those relying on a single channel.
- Lead generation campaigns on Facebook produce an average cost per lead that is 13% lower than campaigns on other major social networks.
Facebook Ads Performance Benchmark Insights
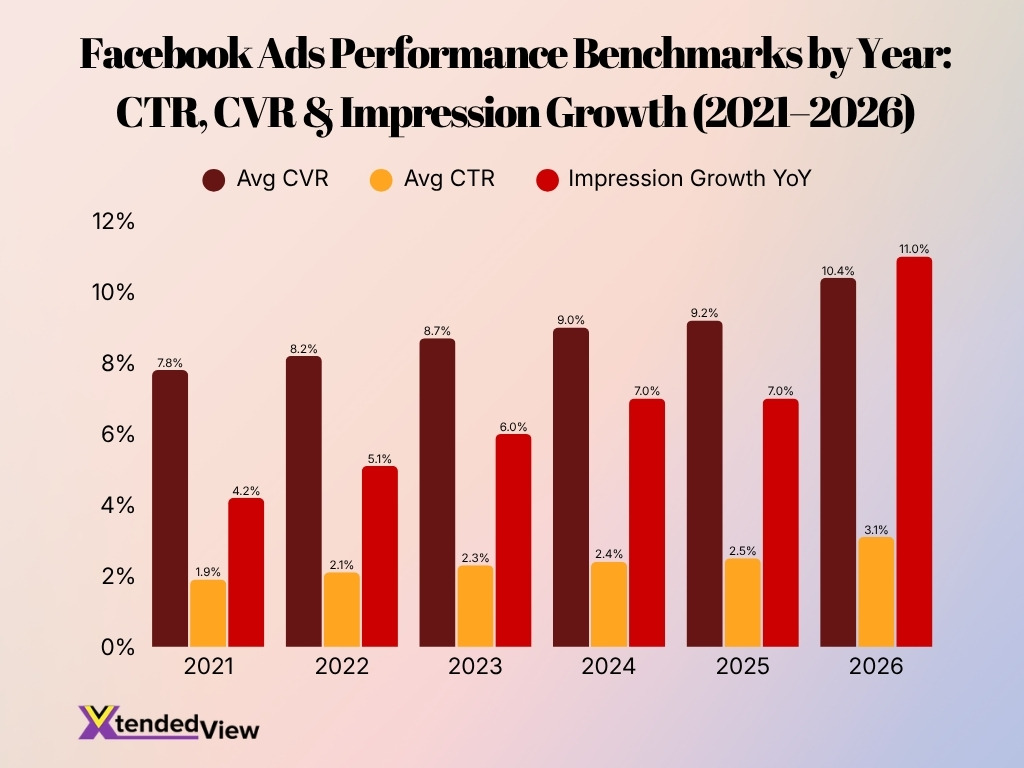
- Average CVR increased from 7.8% in 2021 to 10.4% in 2026, reflecting a 2.6 percentage point improvement.
- Average CTR climbed from 1.9% to 3.1% between 2021 and 2026, marking its highest level in the period.
- Impression Growth YoY rose from 4.2% in 2021 to 11.0% in 2026, indicating accelerating ad visibility.
- 2026 recorded the strongest performance across all three metrics, with 10.4% CVR, 3.1% CTR, and 11.0% impression growth.
- CVR improved every year, increasing from 8.2% in 2022 to 9.2% in 2025 before reaching 10.4% in 2026.
- CTR showed consistent annual growth, rising from 2.1% in 2022 to 2.5% in 2025, then jumping to 3.1% in 2026.
- Impression growth reached 7.0% in both 2024 and 2025, before surging to 11.0% in 2026.
- The largest year-over-year gain in CTR occurred between 2025 and 2026, increasing from 2.5% to 3.1%.
- CVR crossed the 9% mark for the first time in 2024, reaching 9.0% and continuing to rise afterward.
- The data highlights a steady upward trend in Facebook ad engagement, conversion efficiency, and impression growth from 2021 to 2026.
Audience and Demographics Statistics of Facebook Users
- Men account for approximately 56.8% of Facebook’s global audience, while women represent 43.2%.
- The largest age group on Facebook is users aged 25 to 34 years, representing around 31% of the platform’s audience.
- Users aged 18 to 24 years account for nearly 23% of Facebook’s advertising audience.
- Approximately 77% of U.S. adults aged 30 to 49 use Facebook regularly.
- Around 69% of Americans aged 50 to 64 actively use Facebook, making it one of the strongest platforms for reaching older consumers.
- Nearly 58% of U.S. adults aged 65 and older are active Facebook users.
- The United States has roughly 253.6 million Facebook users, making it the second-largest Facebook market globally.
- More than 200 million businesses use Meta’s apps every month to connect with customers.
- Around 19% of Facebook users in the United States earn more than $100,000 annually, making the platform attractive for premium brands.
User Behavior and Engagement Statistics on Facebook
- Facebook users spend an average of 30.9 minutes per day on the platform.
- More than 68% of monthly active users visit Facebook every day, demonstrating exceptionally high engagement.
- Users collectively share over 100 billion messages daily across Meta’s platforms.
- Approximately 500 million people watch videos on Facebook every day.
- Facebook users click on nearly 12 ads per month on average, creating substantial opportunities for advertisers.
- More than 1 billion Stories are shared every day across Meta’s platforms, including Facebook.
- Around 78% of U.S. consumers discover products through Facebook and Instagram content.
- Facebook Groups engage more than 1.8 billion users every month, creating valuable communities for brands and marketers.
- Approximately 74% of consumers use Facebook when researching local businesses and services.
Monthly Facebook Ad Spending Trends Among Businesses
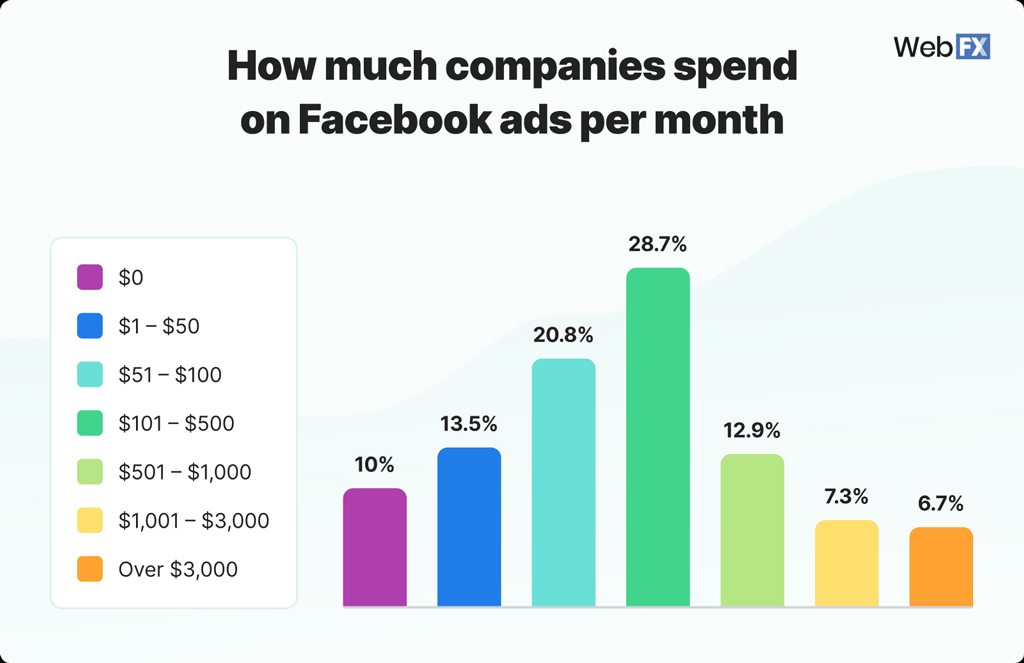
- 28.7% of companies spend $101–$500 per month, making it the most common Facebook advertising budget.
- 20.8% of businesses allocate $51–$100 monthly to Facebook ads.
- Around 13.5% of companies spend $1–$50 per month, reflecting a low-budget advertising strategy.
- 12.9% of businesses invest $501–$1,000 each month in Facebook advertising.
- 10% of companies report spending $0, indicating they do not invest in Facebook ads.
- Only 7.3% of businesses spend $1,001–$3,000 per month on Facebook campaigns.
- The smallest segment, 6.7%, spends over $3,000 monthly on Facebook advertising.
- Overall, 63% of companies spend between $51 and $500 per month, highlighting this as the typical Facebook ad budget range.
- Nearly 76% of businesses keep their monthly Facebook ad spend at $500 or less.
- The data suggests that small to mid-sized advertising budgets dominate Facebook marketing among businesses.
Mobile Advertising Statistics on Facebook
- More than 98% of Facebook users access the platform via mobile devices.
- Around 81.8% of users access Facebook exclusively through mobile phones, without using desktop devices.
- Mobile devices generate approximately 94% of Facebook’s advertising revenue.
- Mobile-first campaigns on Facebook achieve click-through rates that are roughly 27% higher than desktop-focused campaigns.
- Facebook mobile users spend an average of 19.7 hours per month using the platform’s mobile app.
- Mobile video ads deliver engagement rates that are 1.5 times higher than desktop video ads.
- More than 70% of Facebook shopping interactions now originate on smartphones.
- Mobile users are approximately 1.8 times more likely to engage with click-to-message ads than desktop users.
- Vertical ad formats optimized for mobile devices can improve conversion rates by up to 20%.
Facebook Advertising Reach by Region Statistics
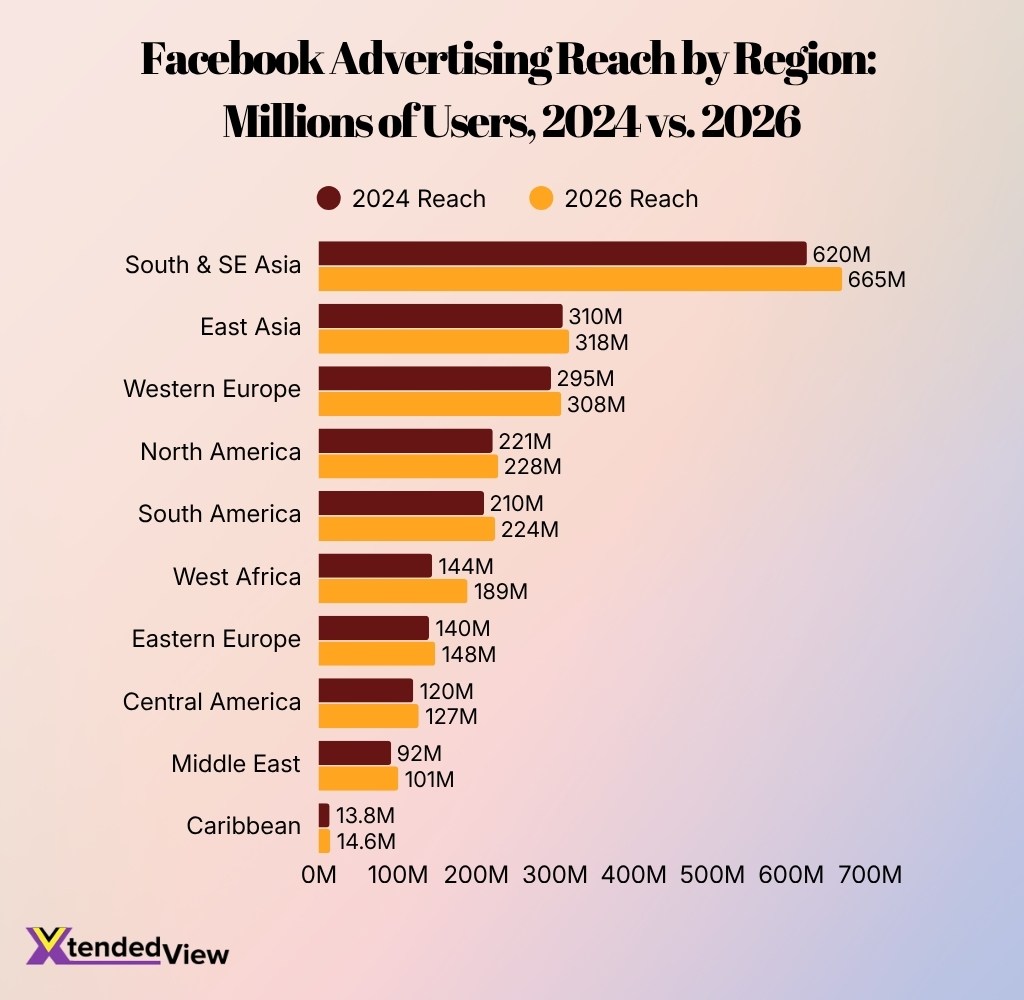
- South & SE Asia remained the largest Facebook advertising audience, growing from 620 million to 665 million users (+7.3%).
- East Asia reached 318 million users in 2026, up from 310 million in 2024 (+2.6%).
- Western Europe increased its Facebook advertising reach from 295 million to 308 million users (+4.4%).
- North America recorded 228 million users in 2026, compared to 221 million in 2024 (+3.2%).
- South America grew to 224 million users, rising from 210 million (+6.7%).
- West Africa experienced the fastest regional growth at +31.2%, expanding from 144 million to 189 million users.
- West Africa surpassed Central America in Facebook advertising reach for the first time in 2026.
- Eastern Europe reached 148 million users, increasing from 140 million (+5.7%).
- Central America grew from 120 million to 127 million users, representing +5.8% growth.
- The Middle East posted 101 million users in 2026, up from 92 million, with a strong +9.8% increase.
- The Caribbean recorded the smallest advertising audience, growing from 13.8 million to 14.6 million users (+5.8%).
- Overall, every region in the chart showed positive growth in Facebook advertising reach between 2024 and 2026.
Video and Reels Advertising Statistics on Facebook
- Facebook Reels now generate more than 200 billion daily plays across Meta’s platforms.
- Reels contribute over 3.5 billion reshares every day, increasing organic reach opportunities for advertisers.
- Short-form video campaigns receive engagement rates that are up to 40% higher than image-based campaigns.
- More than 60% of the time users spend on Facebook and Instagram is now devoted to video content.
- Advertisers using Reels placements report an average 16% lower cost per result compared with traditional feed ads.
- Facebook video ads receive an average engagement rate of approximately 6%, outperforming many static ad formats.
- More than 500 million users watch videos on Facebook every day.
- Campaigns that include video creatives can increase purchase intent by up to 97% compared with campaigns without video.
- Nearly 85% of Facebook videos are watched without sound, making captions and text overlays essential for advertisers.
Stories and Messenger Advertising Statistics on Facebook
- More than 1 billion Stories are shared daily across Meta’s family of apps.
- Click-to-message ad revenue in the United States grew by over 50% year over year during late 2025.
- Paid messaging on WhatsApp surpassed a $2 billion annual revenue run rate in 2025.
- More than 1 billion people communicate with businesses every week through Messenger, WhatsApp, and Instagram Direct.
- Approximately 40 million businesses actively use Messenger to engage with customers.
- Messenger ads can increase conversion rates by up to 20% when combined with automated responses and chat features.
- Story ads occupy the entire mobile screen and generate completion rates that exceed 70% in many verticals.
- Around 58% of consumers say they are more likely to engage with a brand after viewing Stories content.
- Businesses using click-to-message campaigns have reported up to 30% lower customer acquisition costs than standard conversion campaigns.
Facebook Advertising Leads in Consumer Visibility
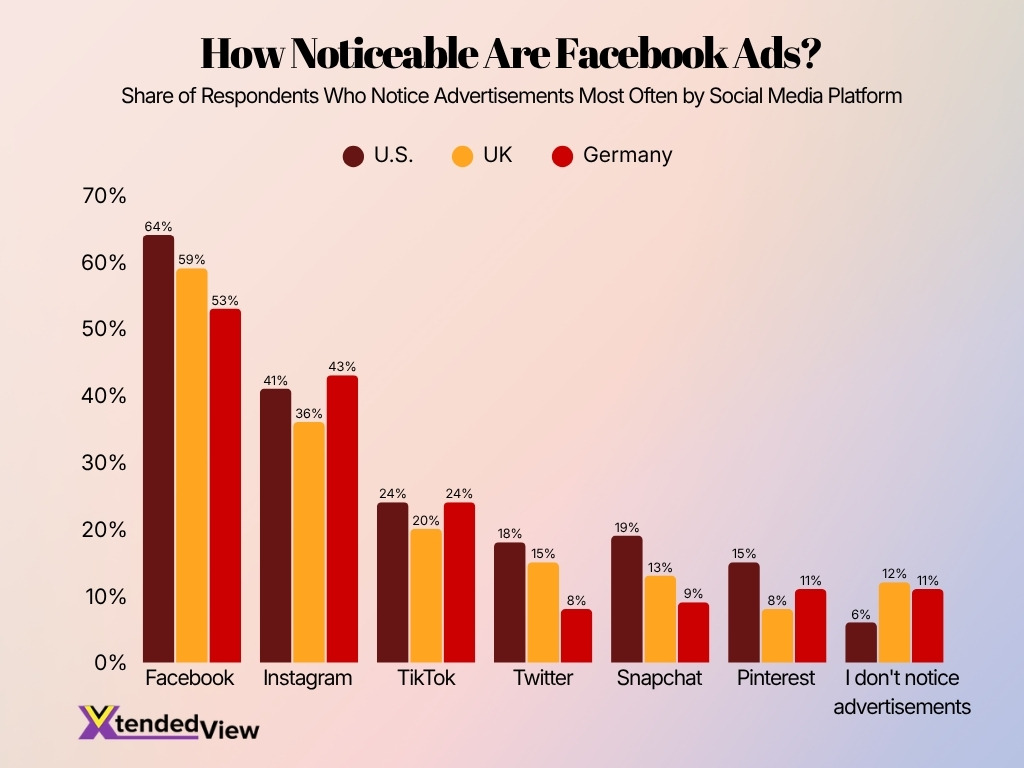
- Facebook has the highest ad visibility, with 64% of respondents in the U.S., 59% in the UK, and 53% in Germany noticing ads frequently.
- Instagram ranks second, reaching 43% of respondents in Germany, 41% in the U.S., and 36% in the UK.
- TikTok records 24% ad visibility in both the U.S. and Germany, compared to 20% in the UK.
- Twitter advertisements are noticed by 18% of respondents in the U.S., 15% in the UK, and only 8% in Germany.
- Snapchat achieves 19% ad visibility in the U.S., while the UK and Germany report 13% and 9%, respectively.
- Pinterest ads are noticed by 15% of users in the U.S., compared with 11% in Germany and 8% in the UK.
- Only 6% of U.S. respondents say they do not notice advertisements, the lowest share among the three countries.
- The UK has the highest proportion of people who do not notice advertisements at 12%, followed by Germany at 11%.
- Facebook outperforms every other platform by a wide margin in all three countries, making it the most noticeable advertising platform.
- Germany is the only country where Instagram (43%) comes closer to Facebook (53%) than in the U.S. or UK.
Targeting and Audience Segmentation Statistics in Facebook Advertising
- More than 200 million businesses use Meta’s platforms every month, largely due to their advanced targeting capabilities.
- Facebook advertisers can target audiences using thousands of demographic, behavioral, and interest signals.
- Retargeted users are approximately 70% more likely to convert than first-time website visitors.
- Lookalike audiences often reduce acquisition costs by up to 30% compared with broad targeting campaigns.
- Personalized audience segmentation can improve click-through rates by as much as 50%.
- Campaigns using custom audiences generate up to 25% higher ROAS than campaigns using broad targeting alone.
- More than 60% of advertisers say audience targeting remains Facebook’s most valuable advertising feature.
- Businesses using first-party customer data in Facebook campaigns report up to 35% better conversion performance than those relying solely on interest targeting.
- Dynamic remarketing campaigns deliver conversion rates that are approximately three times higher than standard display campaigns.
Automation and AI Statistics in Facebook Advertising
- Meta’s AI-powered advertising tools now generate an average return of $4.13 for every $1 spent, a 25% improvement from 2022.
- Advertisers using Advantage+ Shopping Campaigns report an average 22% reduction in cost per acquisition.
- Meta introduced an end-to-end AI advertising platform in 2026 that automates campaign creation, audience targeting, and optimization.
- AI-generated creative testing has reduced campaign setup times by up to 50% for many advertisers.
- Businesses using AI-powered ad optimization tools report up to 32% higher campaign efficiency compared with manual optimization.
- Meta plans to spend between $115 billion and $135 billion in capital expenditures during 2026, largely to support AI infrastructure.
- AI-powered recommendation systems now influence more than 30% of content consumption across Meta’s platforms.
- Automated bidding strategies can improve conversion outcomes by up to 20% compared with manual bidding methods.
- Generative AI tools for ad copy and image creation are expected to be used by more than 70% of digital marketers by 2027.
Facebook Advertising CTR Statistics by Industry
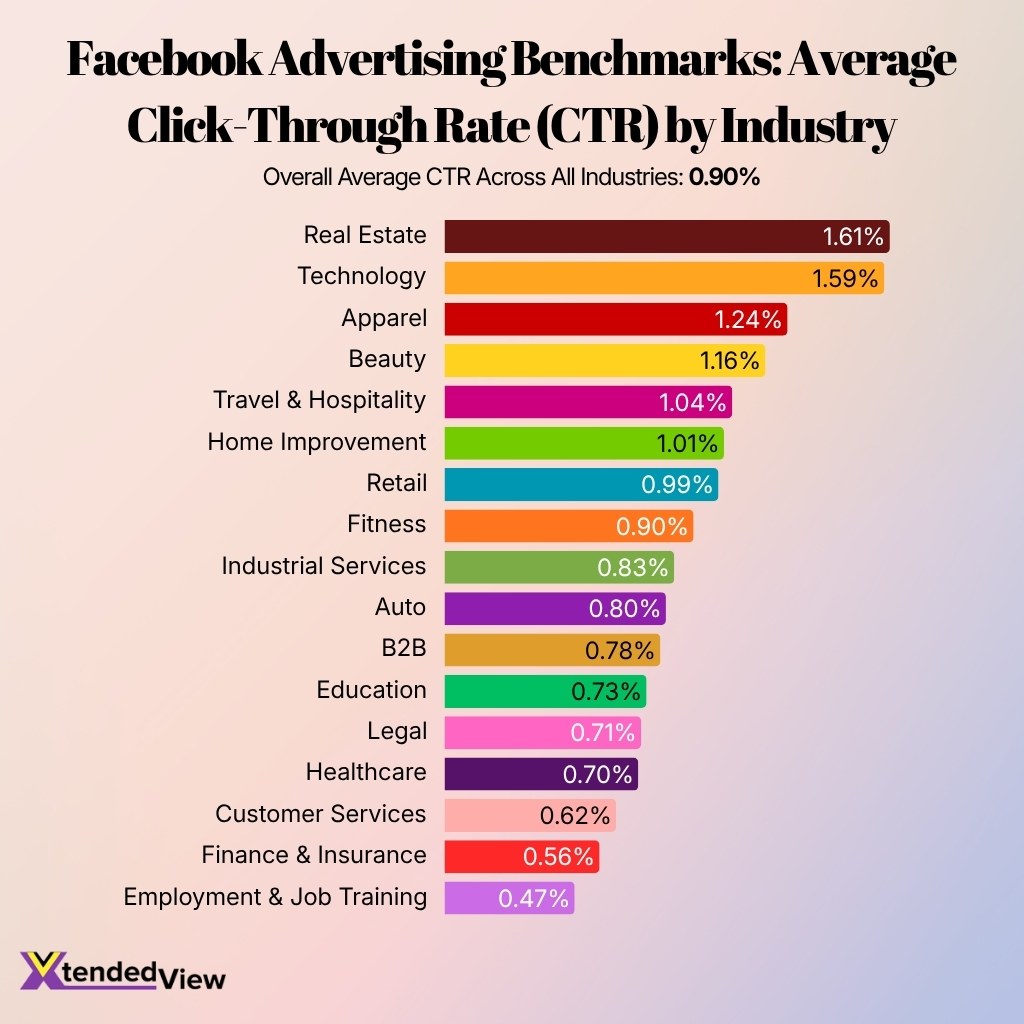
- The average Facebook ad click-through rate (CTR) across all industries is 0.90%.
- Real Estate records the highest CTR at 1.61%, outperforming every other industry.
- Technology follows closely with a 1.59% CTR, indicating strong audience engagement.
- Apparel achieves a 1.24% CTR, well above the overall industry average.
- Beauty ads generate a 1.16% CTR, making it one of the top-performing sectors.
- Travel & Hospitality posts a 1.04% CTR, exceeding the average benchmark.
- Home Improvement reaches a 1.01% CTR, slightly above the cross-industry average.
- Retail maintains a 0.99% CTR, remaining just under the 0.90% benchmark.
- Fitness matches the overall average CTR of 0.90% across industries.
- Industrial Services records a 0.83% CTR, below the industry average.
- Auto advertising delivers a 0.80% CTR, indicating moderate engagement.
- B2B campaigns achieve a 0.78% CTR, trailing consumer-focused industries.
- Education ads generate a 0.73% CTR, below the overall benchmark.
- Legal campaigns record a 0.71% CTR, showing relatively lower click engagement.
- Healthcare achieves a 0.70% CTR, slightly below the industry average.
- Customer Services posts a 0.62% CTR, reflecting lower ad interaction rates.
- Finance & Insurance records a 0.56% CTR, among the weakest performing sectors.
- Employment & Job Training has the lowest CTR at 0.47%, less than one-third of the top-performing industry.
Trends and Future Outlook of Facebook Advertising
- Meta is projected to generate $243.46 billion in advertising revenue in 2026, surpassing Google for the first time.
- Global digital advertising spending is expected to exceed $1 trillion by 2026, with Meta capturing a substantial share of that growth.
- Meta is forecast to account for 26.8% of global ad revenue in 2026.
- AI-driven advertising tools are expected to automate the majority of campaign optimization tasks over the next several years.
- Short-form video is projected to represent more than 80% of social media engagement by 2027.
- Social commerce sales are expected to surpass $2 trillion globally by 2026, creating additional opportunities for Facebook advertisers.
- First-party data strategies will become increasingly important as privacy regulations continue to limit third-party tracking.
- Conversational commerce through Messenger and WhatsApp is expected to become one of Meta’s fastest-growing advertising segments over the next decade.
- AI-generated ad creative and automated campaign management are expected to significantly reduce campaign production costs for businesses of all sizes.
Frequently Asked Questions (FAQs)
Meta is projected to generate $243.46 billion in global advertising revenue in 2026, surpassing Google’s projected $239.54 billion for the first time.
Facebook’s advertising platform can reach approximately 2.41 billion users globally, representing nearly one-third of the world’s population.
Advertisers currently earn an average of $4.13 in revenue for every $1 spent on Meta ads, a 25% improvement compared with 2022.
The median Facebook ad click-through rate across industries reached 2.19% in early 2026, while some benchmark studies report average CTRs around 2.0%.
The average Facebook ad cost per click is approximately $1.72 across all industries in 2026, although traffic campaigns can still achieve CPCs near $0.70.
Conclusion
Facebook remains one of the most influential advertising platforms in the world, combining massive audience reach with increasingly sophisticated AI-driven tools. The platform’s more than 3 billion monthly users, growing video ecosystem, and expanding messaging commerce capabilities continue to attract advertisers across industries.
The latest statistics also show a clear shift toward automation, personalized targeting, and short-form video advertising. At the same time, Meta’s substantial investments in artificial intelligence indicate that campaign optimization and creative development will become even more efficient in the coming years.
For businesses targeting U.S. consumers and global audiences alike, Facebook advertising continues to offer strong returns, advanced audience insights, and scalable growth opportunities. Brands that adapt to AI-powered advertising, mobile-first experiences, and evolving consumer behaviors will likely gain the greatest advantage in the next phase of digital marketing.