


Meta continues to shape how billions of people communicate, shop, watch videos, and discover content across Facebook, Instagram, WhatsApp, Messenger, and Threads. Its platforms also power digital advertising, AI experiences, and business messaging for companies of every size. From helping retailers reach customers through targeted ads to enabling businesses to provide customer support on WhatsApp, Meta plays a central role in the digital economy. Explore the statistics below to understand how Meta’s ecosystem has evolved and what those numbers mean for users, marketers, and investors.
Editor’s Choice
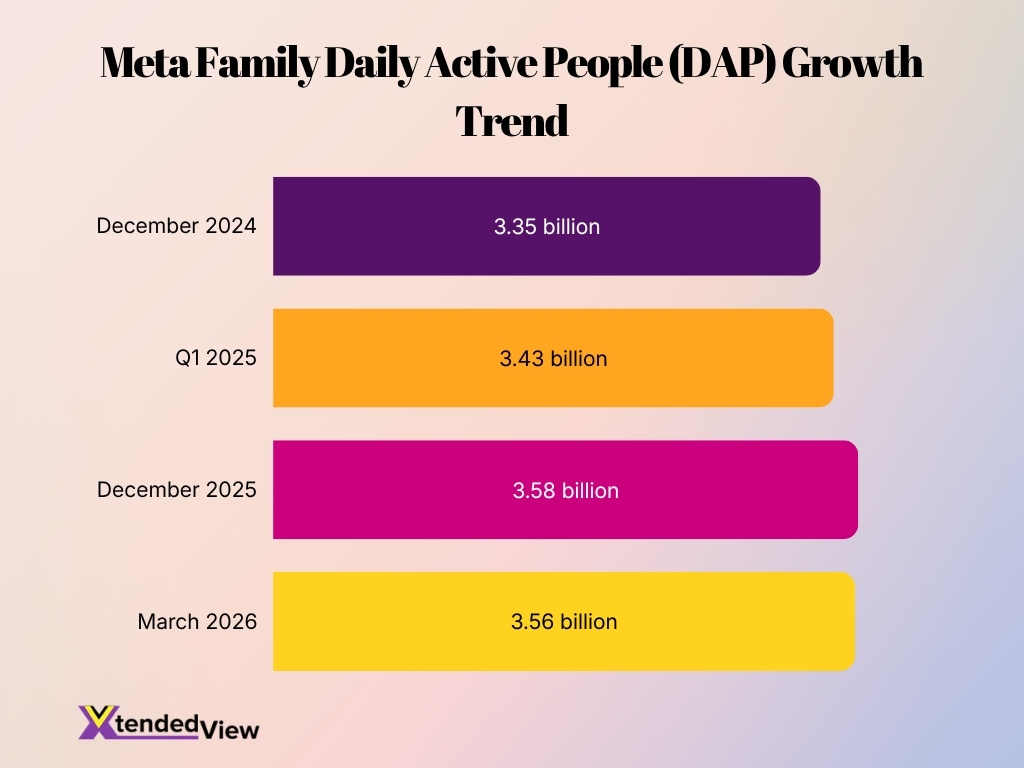
- Meta’s Family Daily Active People (DAP) reached 3.56 billion in March 2026, up 4% year over year, making it one of the world’s largest digital ecosystems.
- The company generated $56.31 billion in Q1 2026 revenue, representing 33% annual growth compared with Q1 2025.
- Meta reported $200.97 billion in total revenue for full-year 2025, surpassing the $200 billion milestone for the first time.
- Net income reached $26.77 billion during Q1 2026, increasing 61% year over year.
- Ad impressions increased 19% year over year in Q1 2026, while the average price per ad rose 12%, reflecting continued advertiser demand.
- Meta AI approached 1 billion monthly active users by Q1 2025, making it one of the fastest-growing consumer AI assistants globally.
- The company planned $64 billion to $72 billion in capital expenditures during 2025, with most spending directed toward AI infrastructure and data centers.
Recent Developments
- Meta introduced Meta Superintelligence Labs in 2026 and released its first model from the new organization, reinforcing AI as the company’s primary long-term investment.
- During Q1 2026, Meta’s Family Daily Active People reached 3.56 billion, despite temporary internet disruptions and regional platform restrictions.
- Meta reported that AI-powered recommendation systems continued to improve engagement across its family of apps throughout 2025.
- Facebook’s ranking improvements produced a 7% increase in organic feed and video views during Q4 2025.
- Video time spent on Facebook grew double digits year over year in the United States during late 2025.
- Meta reported that 75% of Instagram recommendations in the U.S. came from original posts after recommendation improvements in Q4 2025.
- Paid WhatsApp messaging surpassed a $2 billion annual revenue run rate by Q4 2025, highlighting growing business adoption.
- Business AI deployments generated more than one million weekly conversations across Mexico and the Philippines before broader global expansion.
Meta Overview and Key Numbers
- Meta owns and operates Facebook, Instagram, WhatsApp, Messenger, Threads, and Reality Labs, serving billions of users worldwide.
- Family Daily Active People averaged 3.35 billion in December 2024 before increasing throughout 2025 and 2026.
- Meta generated $164.5 billion in revenue during 2024, up substantially from the previous year.
- The company posted a 42% operating margin for full-year 2024.
- Meta reported $42.31 billion in Q1 2025 revenue, representing 16% year-over-year growth.
- Cash, cash equivalents, and marketable securities totaled $70.23 billion as of March 31, 2025.
- Meta employed 76,834 people at the end of Q1 2025, an 11% increase from a year earlier.
- The company returned $13.4 billion to shareholders through share repurchases during Q1 2025.
Meta User Base Across All Apps
- Meta’s Family Daily Active People climbed to 3.58 billion in December 2025.
- The figure remained exceptionally strong at 3.56 billion in March 2026.
- Family Daily Active People increased 7% year over year in Q4 2025.
- During Q1 2025, Meta reported 3.43 billion Family Daily Active People.
- Meta’s Family of Apps includes Facebook, Instagram, Messenger, and WhatsApp, with metrics measuring unique people instead of individual accounts.
- The company relies on machine learning models to estimate unique users across multiple apps and accounts.
- Most Meta users access at least one Family app primarily through mobile devices, making mobile the company’s dominant platform.
- Continued AI improvements have increased user engagement across multiple Meta applications simultaneously.
Facebook User Statistics
- Facebook recorded 3.07 billion monthly active users worldwide during early 2025.
- The social network sees 2.11 billion daily active users logging in every single day.
- India possesses the highest user base with 383.5 million active accounts.
- Users globally spend an average of 32 minutes daily consuming content on the platform.
- An overwhelming 98.5% of users access the application through mobile devices.
- Millennials aged 25 to 34 years form the largest demographic at 31.1% of the audience.
- The current gender breakdown of global users shows 56.7% male and 43.3% female accounts.
- The average organic engagement rate for a standard Facebook post sits at 0.15%.
Instagram User Statistics
- Instagram officially crossed 3 billion monthly active users globally in 2025.
- The platform maintains an audience of approximately 2.2 billion daily active users.
- India currently represents the largest market with over 472.6 million active users.
- The United States follows as the second-largest market with roughly 179.9 million users.
- The majority of the global audience, around 62.3%, falls between the ages of 18 and 34.
- The platform’s global gender demographic is roughly 52.7% male and 47.3% female.
- Advertising reach on the platform extends to nearly 1.99 billion targetable users worldwide.
- A highly engaged 65.4% of the active audience opens the application every single day.
- The average user currently spends 1 hour and 13 minutes engaging with the app daily.
- Projections indicate that 47% of U.S. social buyers will make purchases on the platform in 2026.
WhatsApp User Statistics
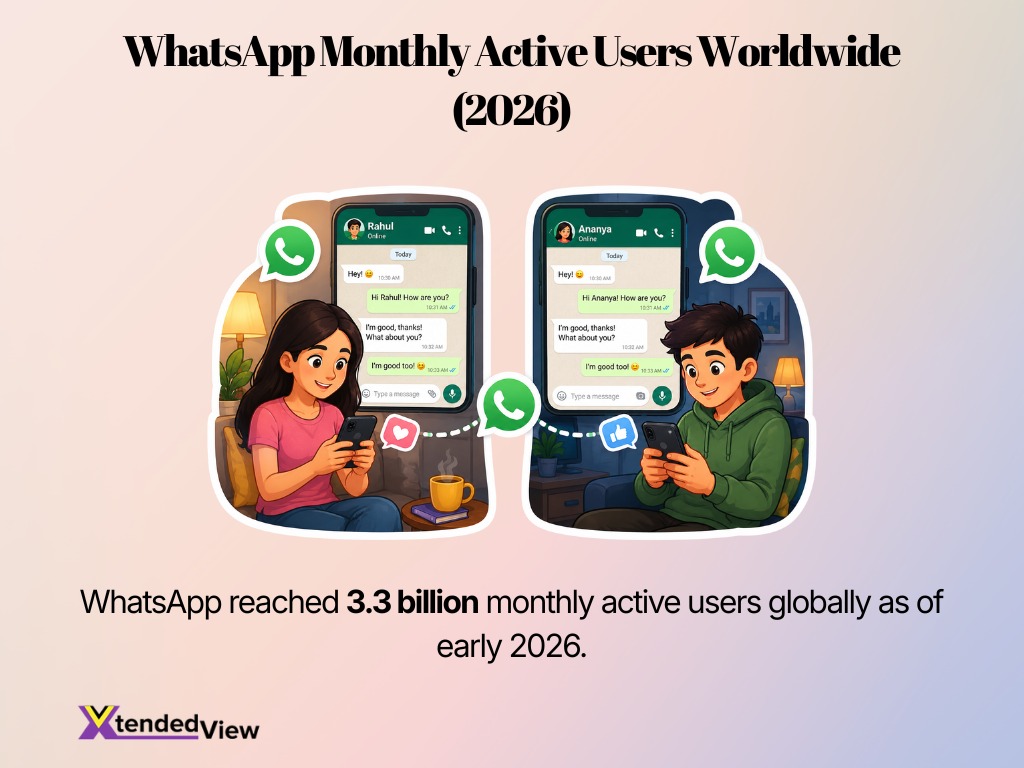
- WhatsApp reached 3.3 billion monthly active users globally as of early 2026.
- India holds the largest user base with over 853.8 million active users.
- Over 150 billion messages are exchanged daily on the platform.
- Users send approximately 7 billion voice messages every single day.
- The average user spends about 34 to 38 minutes daily on the application.
- The messaging app is accessible in over 180 countries and supports 60 languages.
- Around 70% of monthly active users open the application on any given day.
- The 26 to 35 age group represents the largest demographic at 27% of global users.
- More than 200 million users message business accounts on WhatsApp daily.
Messenger User Statistics
- Over 1 billion people use Messenger globally every single month.
- Over 20 billion messages are exchanged between people and businesses on Messenger monthly.
- Facebook Messenger ranks as the fourth most-used social platform in the world.
- The average user spends 19 minutes a day actively using the Messenger app.
- Globally, male users account for 55.5% of the Messenger advertising audience.
- There are over 40 million active businesses currently using the Messenger platform.
- Users share more than 1.3 billion photos and videos on Messenger every single day.
- The Messenger application has been downloaded over 5 billion times on the Google Play Store.
- Over 5 billion emojis are sent through Messenger daily.
Threads User and Engagement Statistics
- Threads achieved 500 million monthly active users globally by June 2026.
- The platform recorded over 150 million daily active users in early 2026.
- Threads surpassed X by reaching 141.5 million mobile daily active users.
- The social network is projected to generate $11.3 billion in revenue by 2026.
- The platform maintains a strong 6.25% median engagement rate.
- The United States accounts for 33.9 million monthly active users.
- India leads global adoption with 54.2 million users, representing 32% of downloads.
- Users aged 25 to 34 years represent the platform’s largest demographic at 36.39%.
- The application has officially surpassed 500 million downloads on the Google Play Store.
Meta AI User Growth
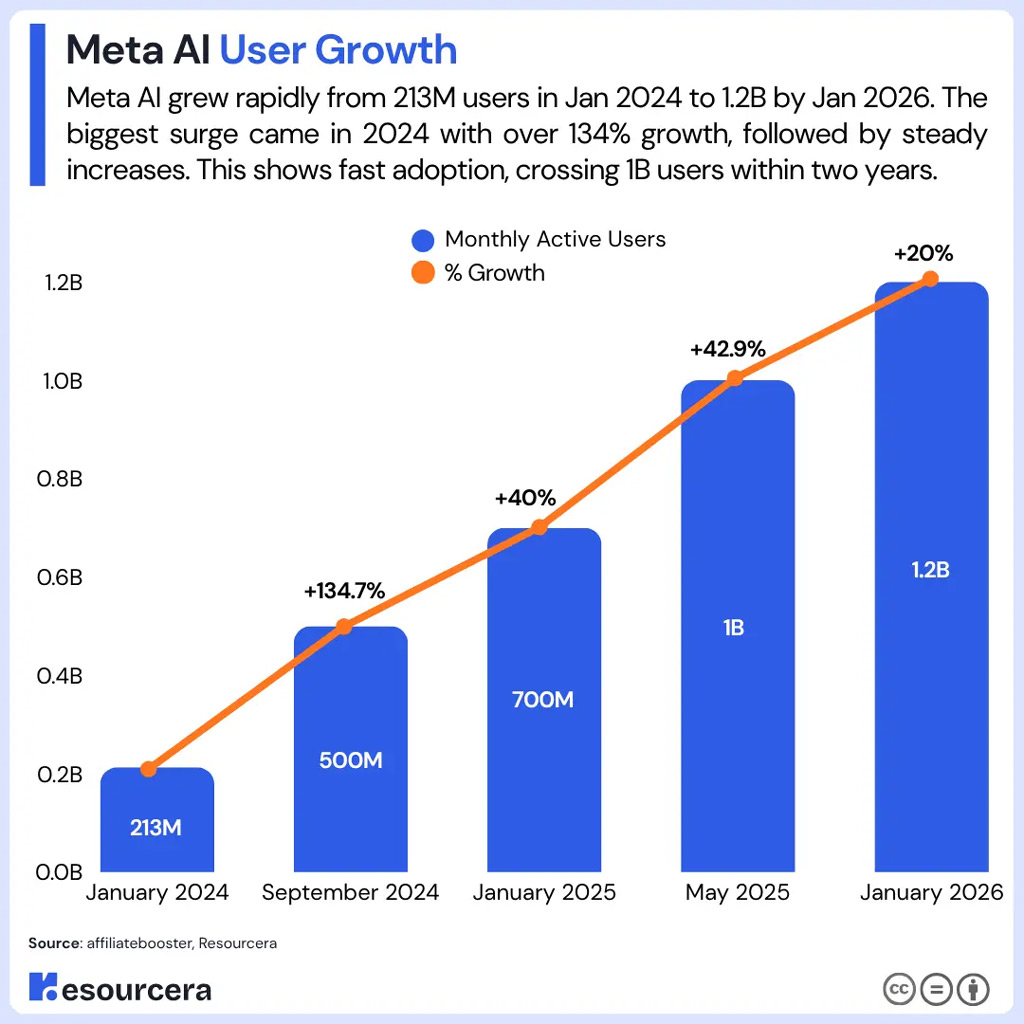
- Meta AI’s monthly active users surged from 213 million in January 2024 to 1.2 billion in January 2026.
- The platform recorded its strongest growth of 134.7% between January and September 2024, reaching 500 million users.
- Meta AI added another 200 million users by January 2025, bringing its total audience to 700 million.
- User growth accelerated by 42.9% between January and May 2025, pushing Meta AI past the 1 billion-user milestone.
- By January 2026, Meta AI had gained an additional 200 million users, representing 20% growth from May 2025.
- Overall, Meta AI expanded by approximately 987 million users in two years, an increase of more than 463%.
Metaverse and Virtual Reality Initiatives Statistics
- Reality Labs generated $402 million in revenue during Q1 2026.
- The division recorded a massive $4.03 billion operating loss during the first quarter.
- Reality Labs experienced a 2% year-over-year revenue decline due to lower headset sales.
- The virtual reality unit has accumulated over $83 billion in total operating losses since 2020.
- Meta increased its 2026 capital expenditure guidance to a range of $125 billion to $145 billion.
- Daily active users of Ray-Ban AI smart glasses successfully tripled year-over-year.
- Meta implemented price increases, adding $50 to $100 across various Quest hardware models.
- The company reduced its workforce by 1,000 Reality Labs employees in January 2026.
Meta Revenue and Growth Statistics
- Meta generated $56.31 billion in revenue during Q1 2026, representing 33% year-over-year growth.
- Net income reached $26.77 billion in Q1 2026, increasing 61% from the prior year.
- Operating income totaled $22.87 billion, while the operating margin remained 41%.
- Advertising revenue reached $55.02 billion during Q1 2026.
- Family of Apps generated $55.91 billion in quarterly revenue, accounting for nearly all company revenue.
- Cash, cash equivalents, and marketable securities increased to $81.18 billion as of March 31, 2026.
- Free cash flow reached $12.39 billion during Q1 2026 despite record AI infrastructure spending.
- Meta expects Q2 2026 revenue between $58 billion and $61 billion, reflecting continued business momentum.
Meta Q1 2026 Financial Performance Highlights
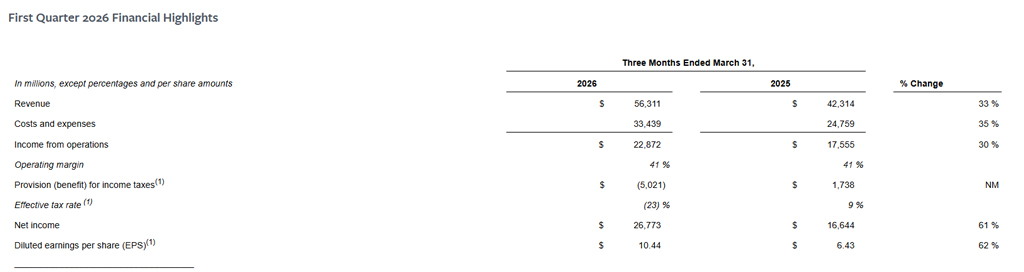
- Meta’s Q1 2026 revenue reached $56.31 billion, rising 33% from $42.31 billion in Q1 2025.
- Costs and expenses increased 35% to $33.44 billion, slightly outpacing revenue growth.
- Income from operations climbed 30% year over year to $22.87 billion.
- Meta maintained a strong 41% operating margin, unchanged from the previous year.
- The company recorded an income tax benefit of $5.02 billion, compared with a $1.74 billion tax provision in Q1 2025.
- Meta’s effective tax rate shifted to negative 23%, versus 9% in the prior-year quarter.
- Net income surged 61% to $26.77 billion, up from $16.64 billion.
- Diluted EPS increased 62% to $10.44, compared with $6.43 in Q1 2025.
Average Revenue Per User (ARPU) Statistics
- Meta’s worldwide Average Revenue Per Person (ARPP) reached $15.66 in Q1 2026, jumping 27% from $12.36 in Q1 2025.
- The US and Canada region generated $24.1 billion in total revenue, maintaining the highest regional monetization.
- Europe contributed $13.5 billion in revenue, reflecting strong advertiser demand with a 19% increase in average price per ad.
- The Asia-Pacific region delivered $10.9 billion in revenue and led global volume with a 23% growth in ad impressions.
- The Rest of World segment generated $7.8 billion, improving monetization through an 18% increase in ad pricing and a 17% rise in impressions.
- Global ad impressions delivered across the Family of Apps increased by 19% year-over-year due to AI-powered ad optimization.
- The worldwide average price per ad increased by 12%, significantly contributing to the overall ARPP improvement.
- Total Family of Apps revenue climbed to $55.9 billion, representing a 33% year-over-year increase driven by premium ad products.
Regional User Distribution and Growth Statistics
- Meta’s Family Daily Active People hit 3.56 billion, marking a 4% year-over-year growth globally.
- Asia-Pacific recorded a 29% year-over-year revenue increase, generating $10.9 billion in Q1 2026.
- US and Canada led all global markets by generating the highest regional revenue of $24.1 billion.
- Europe maintained its position as the second-largest revenue contributor, adding $13.5 billion.
- Rest of World emerging markets drove strong user growth and contributed $7.8 billion in total revenue.
- Geopolitical restrictions in Iran and Russia caused a temporary drop of 20 million daily active users.
- Asia-Pacific led the global volume growth with a 23% year-over-year surge in delivered ad impressions.
- Regional digital maturity drove average ad prices up by 19% in Europe and 14% in North America.
Meta User Demographics
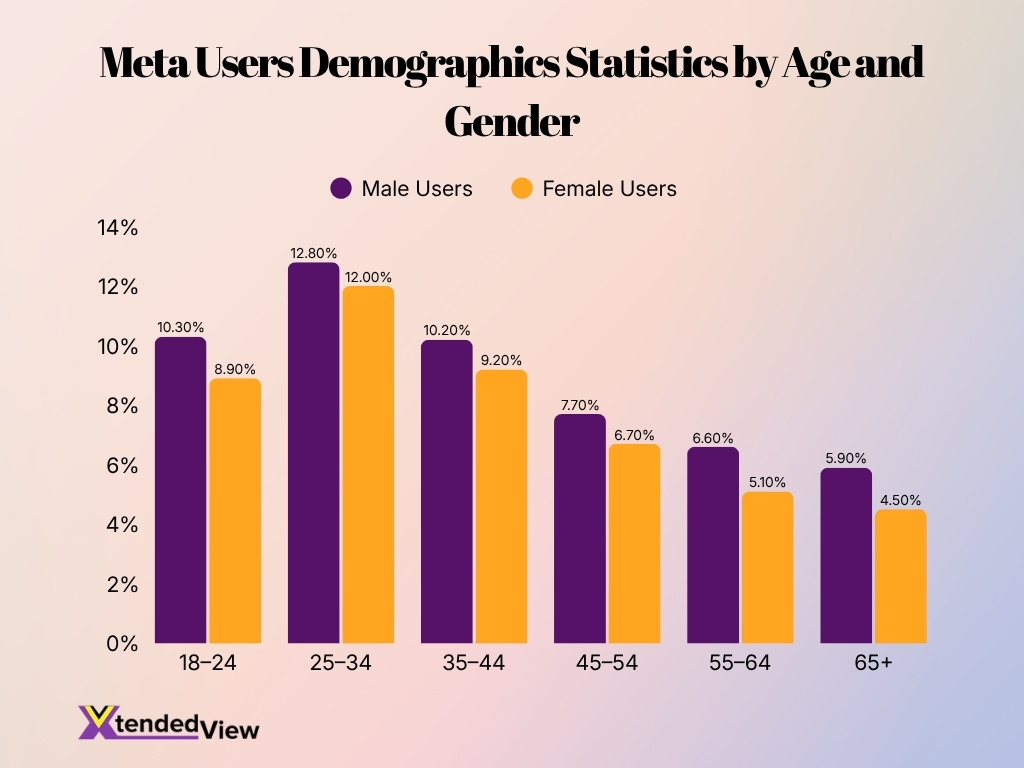
- The 25–34 age group represents Meta’s largest audience, accounting for 12.8% of male users and 12.0% of female users.
- Among users aged 18–24, men make up 10.3%, compared with 8.9% for women.
- The 35–44 demographic remains a major user segment, with 10.2% male users and 9.2% female users.
- Meta usage declines among older audiences, falling to 7.7% for men and 6.7% for women aged 45–54.
- In the 55–64 age group, male users account for 6.6%, while female users represent 5.1%.
- Users aged 65 and above form the smallest demographic, at 5.9% for men and 4.5% for women.
- Male users have a higher share than female users across every age group shown in the data.
- The figures indicate that Meta’s core audience is concentrated among users aged 18–44, especially those between 25 and 34.
Engagement and Usage Behavior Statistics
- AI ranking improvements increased organic Facebook feed and video views by 7% during Q4 2025.
- Video watch time on Facebook increased double digits year over year in the United States.
- Facebook now recommends more than 25% additional same-day Reels compared with Q3 2025.
- Instagram recommendations now consist of 75% original posts, improving creator visibility and user engagement.
- AI improvements increased Facebook ad clicks by 3.5% during Q4 2025.
- Meta’s new recommendation architecture increased Instagram conversion rates by 3% during Q4 2025.
- AI enhancements improved overall Facebook advertising quality by 12%, increasing ad relevance for users.
- Personalized recommendations continue increasing user retention across Facebook, Instagram, Threads, and other Meta services.
Competitive Position in Social Media and Digital Advertising
- Meta generated $55.02 billion in advertising revenue during Q1 2026.
- Ad impressions increased by 19% year-over-year across Meta’s Family of Apps.
- The average price per ad rose by 12%, indicating strong advertiser demand.
- Meta’s Family of Apps generated $55.91 billion in total quarterly revenue.
- Total revenue reached $56.31 billion, representing a 33% year-over-year growth rate.
- Family daily active people (DAP) averaged 3.56 billion in March 2026, a 4% annual increase.
- Net income surged to $26.77 billion, marking a massive 61% year-over-year increase.
- Meta’s business AI tools now drive over 10 million weekly conversations.
Meta Ad Statistics and Revenue Trends
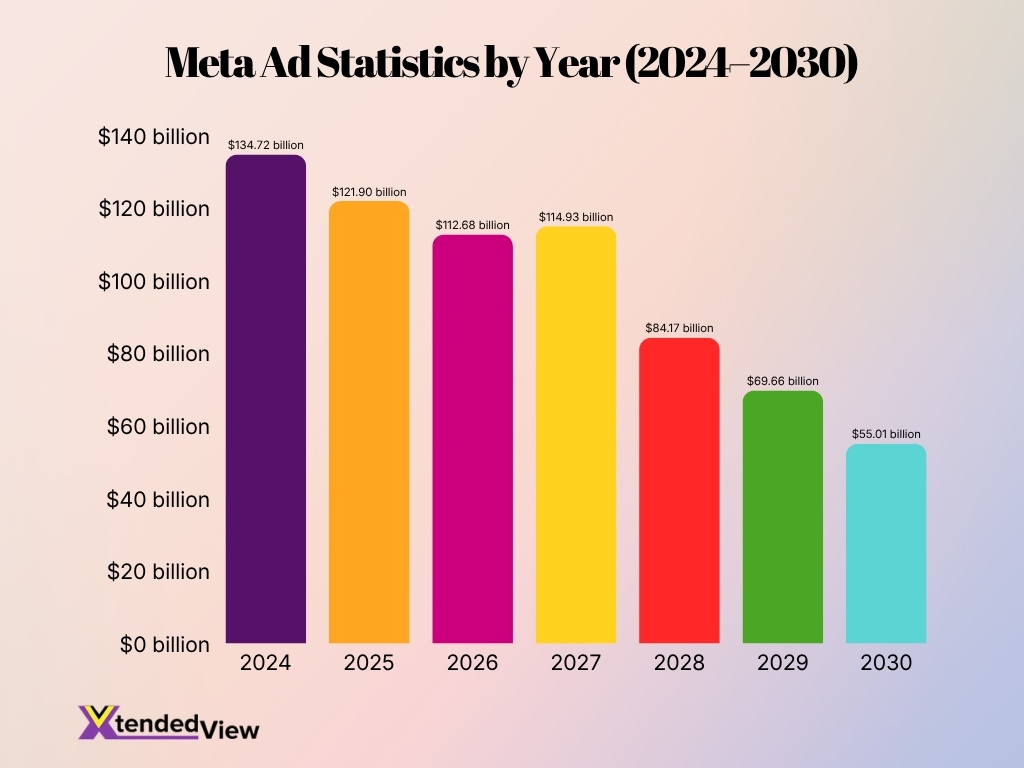
- Meta’s ad statistics reached their highest level in 2024, totaling $134.72 billion.
- The figure declined by 9.5% in 2025, falling to $121.90 billion.
- Meta recorded another decrease in 2026, with ad statistics dropping to $112.68 billion.
- A modest recovery occurred in 2027, when the total increased to $114.93 billion.
- The sharpest annual decline came in 2028, as the figure fell by 26.8% to $84.17 billion.
- Meta’s ad statistics continued to decrease in 2029, reaching $69.66 billion.
- By 2030, the total is projected to fall further to $55.01 billion, the lowest value shown.
- Overall, the figure declines by approximately 59.2% between 2024 and 2030.
Frequently Asked Questions (FAQs)
Meta generated $56.31 billion in revenue during the first quarter of 2026, a 33% year-over-year increase.
Meta reported 3.56 billion Family Daily Active People (DAP) on average in March 2026, up 4% from the previous year.
Ad impressions across Meta’s Family of Apps increased 19% year over year in Q1 2026.
Meta’s worldwide Average Revenue Per Person (ARPP) reached $15.66 in Q1 2026, compared with $12.36 a year earlier.
Meta generated $200.97 billion in total revenue during 2025, representing 22% annual growth over 2024.
Conclusion
Meta entered the year with strong momentum across user growth, advertising, AI, and business messaging. The company expanded revenue by double digits, surpassed 3.5 billion daily active people, and continued improving engagement through AI-powered recommendations across Facebook, Instagram, WhatsApp, Messenger, and Threads.
At the same time, Meta significantly increased investments in AI infrastructure and immersive technologies, signaling that long-term innovation remains central to its strategy. For marketers, investors, creators, and businesses, Meta’s latest statistics demonstrate that its platforms continue to play a dominant role in digital communication, advertising, and the evolving AI landscape.
