



Social media advertising remains one of the largest components of digital marketing as brands use paid social campaigns to reach consumers, generate leads, and drive online sales. Retailers use shoppable and video ads to move customers from product discovery to checkout, while B2B companies use professional and interest-based targeting to reach decision-makers. By April 2026, global social media user identities had reached 5.79 billion, while worldwide social media advertising spending is projected to reach $338.75 billion in 2026. The statistics below show how audience growth, advertising investment and platform performance are shaping social media advertising.
Editor’s Choice
- Global social media user identities reached 5.79 billion by April 2026, equal to 69.9% of the world’s population. The total increased 5.4% year over year, adding 294 million identities.
- Worldwide social media advertising spending is projected to reach $338.75 billion in 2026, with the market forecast to grow at an 11.86% compound annual rate through 2030.
- The U.S. social network advertising market is expected to surpass $121 billion in 2026 and capture close to 32% of U.S. digital advertising spending.
- U.S. social media advertising revenue reached $117.7 billion in 2025, increasing 32.6%, or $29 billion, from the previous year.
- More than 30% of adult internet users worldwide say social media ads help them discover new brands, products, and services. Social ads rank as the third-largest brand-awareness source after search engines and TV ads.
- One major social advertising ecosystem recorded a 14% year-over-year increase in ad impressions during Q2 2026, while its average price per ad increased 12%. Its family of apps averaged 3.60 billion daily active people in June.
- YouTube advertising revenue reached $40.37 billion in 2025, up from $36.15 billion in 2024. Direct-response advertising led the increase, followed by brand advertising.
Recent Developments
- Social media advertising entered 2026 after an unusually strong U.S. growth year. Revenue reached $117.7 billion in 2025, up 32.6% from 2024, when the comparable total was about $88.7 billion.
- AI-supported delivery continued to increase advertising inventory and monetization in 2026. During Q2, ad impressions across one of the world’s largest social app families rose 14%, while average price per ad rose 12% year over year.
- The same business generated $60.80 billion in total Q2 2026 revenue, representing 28% year-over-year growth. Daily active people across its app family reached 3.60 billion.
- Pinterest ended 2025 with 619 million monthly active users, 12% more than a year earlier. Revenue climbed 16% to $4.22 billion, expanding the addressable audience for visual discovery and shopping campaigns.
- Pinterest users conducted more than 80 billion searches per month by the end of 2025. The scale matters for advertisers because product discovery and visual search can connect commercial intent directly with paid placements.
- Reddit generated $2.06 billion in advertising revenue in 2025, up about 74% from $1.19 billion in 2024. The increase shows how community-focused platforms are becoming larger paid-media channels.
- Reddit’s Q4 2025 advertising revenue alone reached $690 million, increasing 75% year over year. Daily active uniques averaged 121.4 million during the quarter, up 19%.
- Snapchat delivered approximately 17% more advertising impressions in 2025 than in 2024 as Sponsored Snaps and Spotlight expanded inventory. However, cost per advertising impression fell about 10%, highlighting the pricing pressure that can accompany rapid inventory growth.
- In Q2 2026, Snapchat reached 495 million daily active users, up about 5% year over year. However, its daily audience fell 7% in North America and 2% in Europe, showing why advertisers need to assess regional reach rather than rely only on global totals.
Social Media Advertising Spend and Market Size
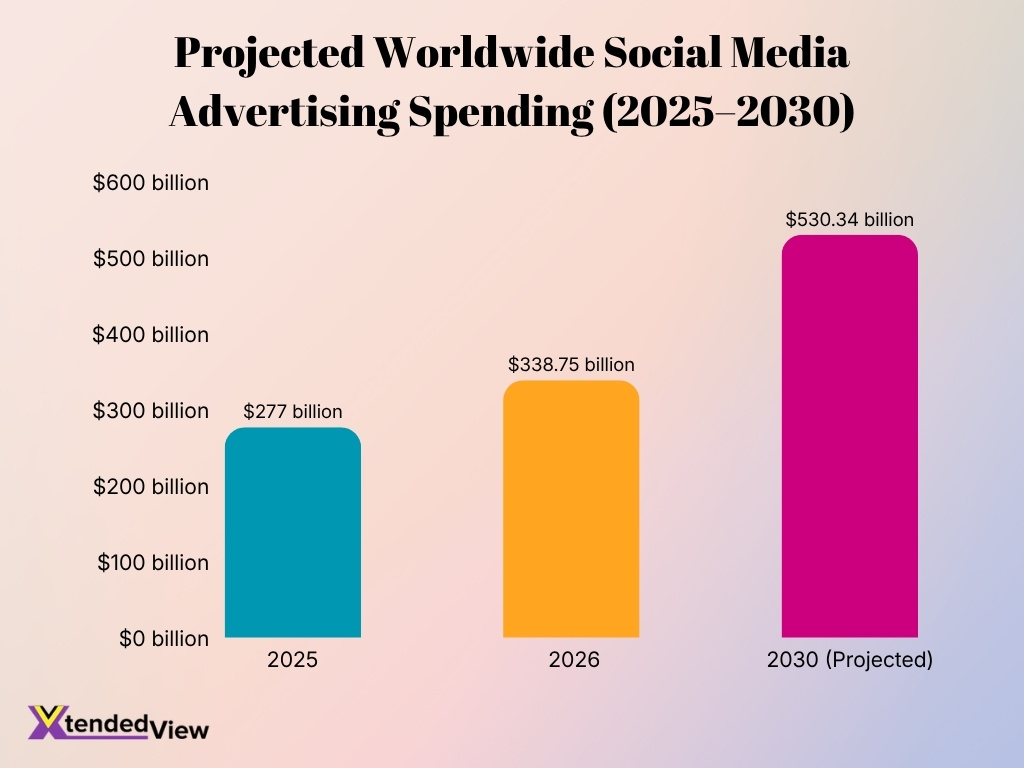
- Worldwide social media advertising spending is projected to reach $338.75 billion in 2026. The forecast represents an 18.4% annual increase in market spending.
- The U.S. alone is projected to generate approximately $126 billion in social media advertising spending during 2026, making it the largest national market.
- Another U.S.-focused forecast places 2026 social network ad spending at more than $121 billion, with social networks taking close to 32% of total U.S. digital ad investment. Differences reflect forecasting methodologies and category definitions.
- Global social media advertising spending was projected at $277 billion in 2025, an increase of 13.6% year over year. That equaled more than $5 billion in advertiser spending each week.
- Social media accounted for an estimated 32.1% of worldwide digital ad spending in 2025, demonstrating how far the channel has moved beyond an experimental share of media budgets.
- U.S. social media advertising revenue reached $117.7 billion in 2025, after generating roughly $88.7 billion in 2024. The $29 billion increase translated into 32.6% annual growth.
- Total U.S. internet advertising revenue approached $300 billion in 2025, growing 13.9% year over year. Social advertising therefore contributed a substantial portion of the digital industry’s expansion.
- In comparison, U.S. internet advertising revenue totaled $258.6 billion in 2024, up 14.9% from the prior year. The subsequent acceleration in social revenue shows that paid social grew considerably faster than the broader digital market.
- Longer term, worldwide social media ad spending is projected to reach $530.34 billion by 2030, based on an estimated 11.86% compound annual growth rate from 2026 through 2030.
Global Social Media Usage and Reach
- Active social media user identities reached 5.79 billion globally by April 2026. That represented 69.9% of the world’s population.
- Global social media identities grew by 294 million in 12 months, representing annual growth of 5.4%. That works out to more than 800,000 additional identities per day.
- For comparison, the early-2025 global count stood at 5.24 billion active social media user identities, having risen 4.1% during the preceding 12 months.
- In October 2025, global social media user identities stood at 5.66 billion, or 68.7% of the world’s population. This increased by 259 million identities from the prior year.
- Social media adoption has more than doubled in a decade. The worldwide user-identity total stood just below 2.27 billion in October 2015, compared with 5.66 billion a decade later.
- The typical online adult spends about 18 hours and 36 minutes per week across social networks and video-centric platforms. That equals more than 2½ hours per day and roughly 16% of waking time.
- Women ages 16 to 24 spend about 25 hours and 45 minutes per week consuming social and video feeds, equivalent to more than 3 hours and 40 minutes per day.
- The typical TikTok Android user spends about 1 hour and 37 minutes per day in the app. Instagram averages 1 hour and 13 minutes, while Facebook averages about 67 minutes.
- U.S. teens remain a particularly concentrated social audience. In a 2025 survey, roughly 90% used YouTube, while 63% used TikTok, 61% used Instagram, and 55% used Snapchat.
- Usage frequency among U.S. teens is also high: 61% used TikTok daily, and 55% used Instagram daily in a later 2025 survey, while 36% used at least one major platform almost constantly.
Platform-Specific Advertising Statistics
- YouTube generated $40.37 billion in advertising revenue in 2025, compared with $36.15 billion in 2024, an increase of roughly 11.7%.
- YouTube’s combined advertising and subscription revenue exceeded $60 billion in 2025, illustrating how its advertising operation sits within an increasingly diversified video business.
- Meta’s Family of Apps averaged 3.60 billion daily active people in June 2026, up 3% year over year. Its Q2 ad impressions increased 14%, while average price per ad increased 12%.
- Meta’s worldwide annual average revenue per person reached $57.03 in 2025, increasing 15% from 2024. Higher monetization per user gives advertisers a clear signal of continued demand across its advertising ecosystem.
- Pinterest reached 619 million monthly active users in 2025, up 12%, while annual revenue climbed 16% to $4.22 billion. Average revenue per user reached $7.21.
- Snapchat generated $5.19 billion in advertising revenue during 2025, compared with $4.90 billion in 2024. Advertising impressions grew about 17%, although cost per impression declined around 10%.
- Snapchat ended Q4 2025 with 474 million daily active users, up 5% year over year. Its Q4 average revenue per user increased from $3.44 in 2024 to $3.62 in 2025.
- Reddit’s advertising revenue jumped from $1.19 billion in 2024 to $2.06 billion in 2025, representing growth of roughly 74%. Total annual revenue reached $2.20 billion.
- Reddit averaged 121.4 million daily active uniques in Q4 2025, 19% more than a year earlier. Its quarterly advertising revenue rose 75% to $690 million, supported by gains in both impressions and pricing.
- TikTok continues to stand out for time spent per user. Its typical Android user spent 1 hour and 37 minutes per day in the app in August 2025, about 14% longer than the typical YouTube Android user, creating substantial inventory for short-form advertising.
Perception of Accuracy in Social Media Ads
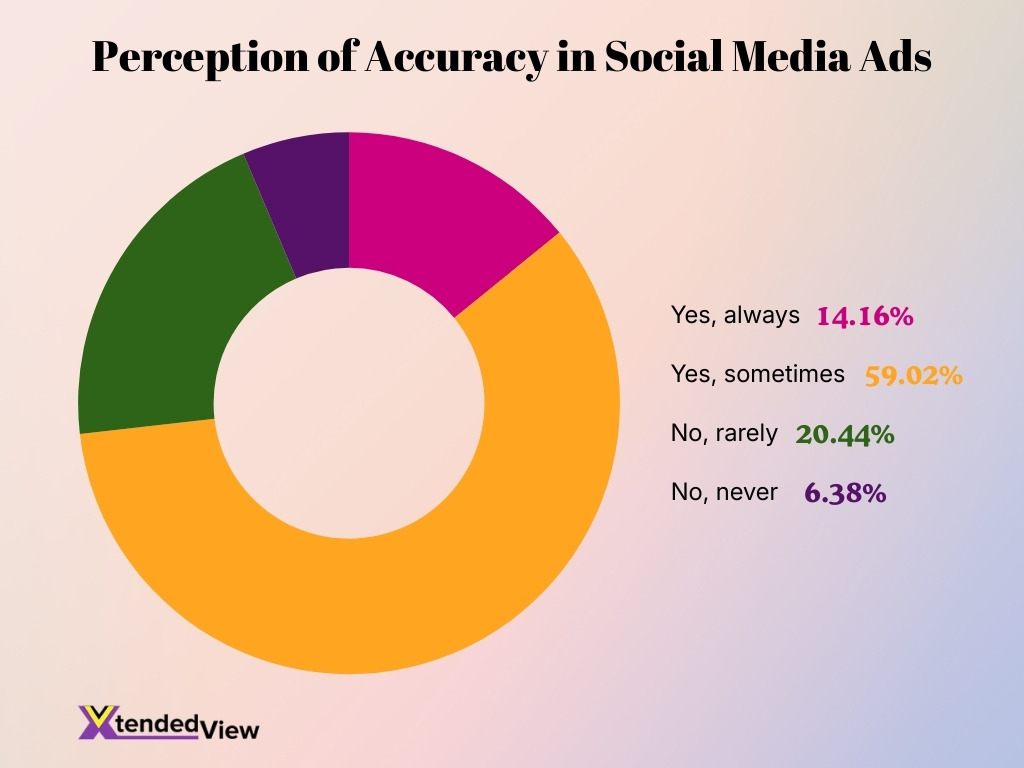
- A clear majority of users (59.02%) believe that social media ads are accurate only sometimes, indicating moderate trust but noticeable skepticism.
- Only 14.16% of respondents feel that ads are always accurate, showing limited full confidence in advertising claims.
- Around 20.44% of users report that ads are rarely accurate, highlighting ongoing concerns about misleading content.
- A smaller segment (6.38%) believes that social media ads are never accurate, reflecting strong distrust among a minority of users.
- Overall, nearly 26.82% of respondents (20.44% + 6.38%) express low trust in ad accuracy, emphasizing the need for greater transparency.
- The data suggests that improving fact-based messaging, credibility, and verification could help brands convert “sometimes” believers into loyal customers.
Social Media Ad Formats and Performance
- Over 30% of adult internet users discover new brands and products through social media ads.
- For users ages 16 to 34, social advertising is currently the leading source of brand awareness.
- In Q2 2026, a major app family delivered 14% more ad impressions while average ad prices rose 12%.
- New ad placements drove a 17% increase in Snapchat advertising impressions throughout 2025.
- Despite the impression volume surge, Snapchat’s cost per ad impression fell by roughly 10% in 2025.
- YouTube added $4.2 billion in annual ad revenue in 2025, largely fueled by direct-response formats.
- Reddit reported a 75% year-over-year growth in advertising revenue during Q4 2025.
- A 2025 study showed a 5.47% engagement rate on Instagram compared to just 1.42% on TikTok.
- An analysis of 250 creators found that surging short-form content caused significant drops in long-form video views.
Mobile vs. Desktop Social Media Advertising
- Global social media advertising spending is projected to reach $338.75 billion in 2026.
- During the 2024 holiday season, 79% of last-minute online orders occurred on smartphones.
- Social networks generated 14% of U.S. ecommerce traffic during the 2024 holiday period.
- A survey showed 69% of respondents use smartphones as their main device for watching digital video.
- The typical global Android user spent 1 hour and 37 minutes daily on TikTok in 2025.
- Global Android users averaged 1 hour and 13 minutes per day on Instagram in 2025.
- TikTok Shop’s U.S. ecommerce sales are projected to hit $23.41 billion in 2026, growing 48% from 2025.
- By 2030, mobile will generate 82.9% of total social media advertising spending.
Social Media Advertising Spend per Capita by Country
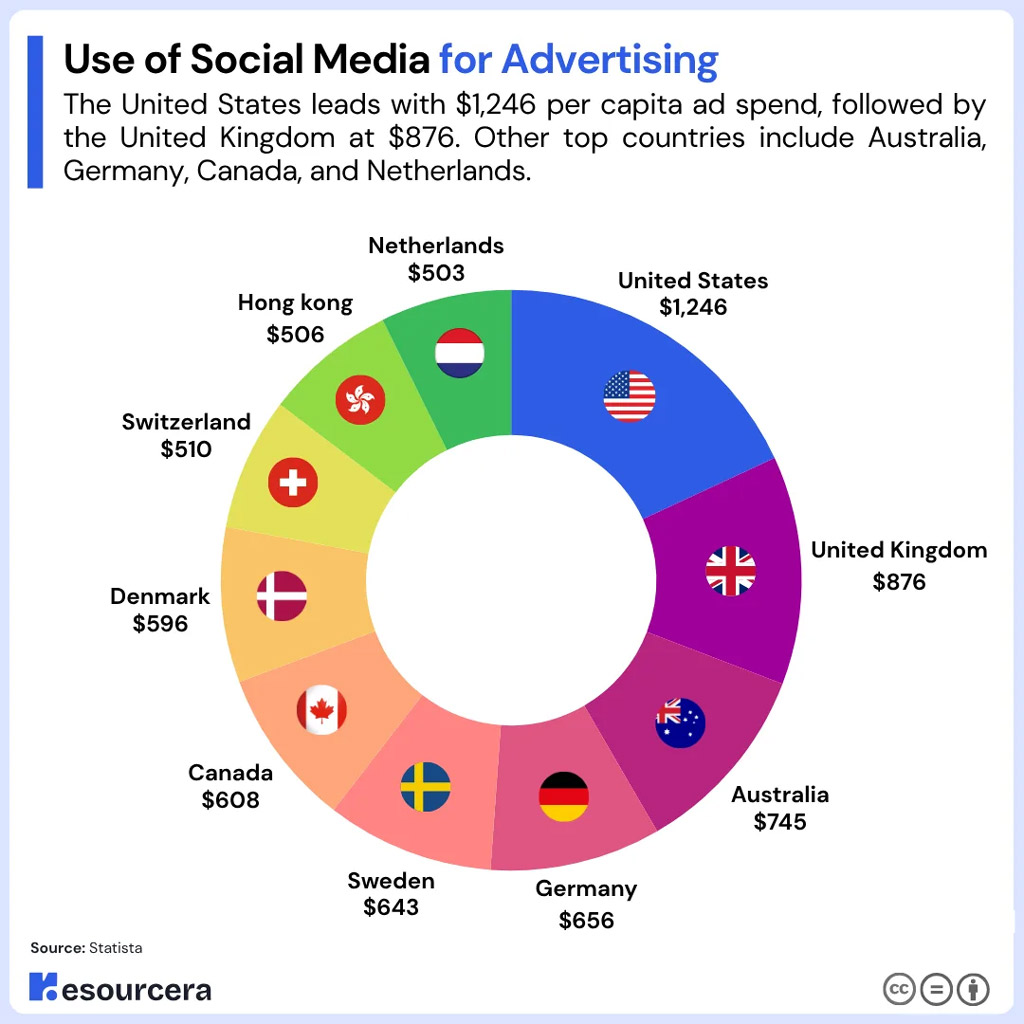
- The United States leads social media advertising spending by a wide margin, reaching $1,246 per capita, the highest among the countries shown.
- The United Kingdom ranks second with $876 per capita, placing it $370 behind the United States.
- Australia holds third place at $745 per capita, highlighting its relatively strong level of social media advertising investment.
- Germany and Sweden report similar spending levels at $656 and $643 per capita, respectively, a difference of just $13.
- Canada records social media ad spending of $608 per capita, ranking sixth among the 10 markets included in the data.
- Denmark follows closely behind Canada with $596 per capita, putting the two countries only $12 apart.
- Switzerland spends $510 per capita, while Hong Kong is nearly identical at $506 per capita.
- The Netherlands records the lowest figure among the countries shown at $503 per capita, although it remains close to Hong Kong and Switzerland.
- Overall, the gap between the highest and lowest markets is $743 per capita, with U.S. spending approximately 2.5 times that of the Netherlands.
- The data shows a clear concentration at the top, as the United States, United Kingdom, and Australia are the only markets exceeding $700 per capita in social media advertising spend.
Social Media Advertising ROI and Effectiveness
- Over 30% of adult internet users globally discover new brands through social media ads.
- Social ads are the leading source of brand awareness for internet users aged 16 to 34.
- Diversified social media strategies generated 2% to 5% higher web sales for ecommerce companies.
- About 73% of B2B marketers utilized paid social media advertising or promoted posts in 2025.
- Around 53% of enterprise marketers report that paid social channels produce their best results.
- LinkedIn Ads generated a 113% return on ad spend for B2B marketers in a 2025 benchmark.
- LinkedIn Ads accounted for nearly 39% of total advertising spending among B2B marketers.
- A massive 96% of social-first brands treat social commerce as a high or very high priority.
- Despite high adoption, only 39% of brands report that social commerce delivers a high ROI.
Targeting and Audience Demographics
- U.S. social media audiences vary sharply by platform. In 2025, YouTube and Facebook remained the two most widely used social platforms among American adults, while 50% of adults said they used Instagram.
- Age remains one of the clearest targeting variables. Among U.S. adults, Facebook continues to have substantial reach among middle-aged users: 58% of adults ages 30 to 49 and 54% of adults ages 50 to 64 reported using it daily in 2025.
- Instagram gives advertisers particularly strong access to younger adults. Half of all U.S. adults reported using Instagram in 2025, but adoption remains substantially higher among younger age groups than among older Americans.
- U.S. teen audiences remain heavily concentrated on video and visual platforms. About 90% of teens used YouTube in 2025, while 63% used TikTok, 61% used Instagram, and 55% used Snapchat. These differences help advertisers choose platforms based on age rather than total global audience.
- Frequency matters alongside reach. In late-2025 research, 61% of U.S. teens used TikTok daily, and 55% used Instagram daily, while 36% said they used at least one major social platform almost constantly.
- Global demographics also vary considerably by market. In India, social platforms’ advertising tools indicated 444 million users ages 18 and older at the beginning of 2025, equivalent to 43.1% of the country’s adult population.
- The same Indian advertising-audience data showed a pronounced gender split: 65.5% of social media user identities were male and 34.5% were female at the beginning of 2025. Advertisers running international campaigns therefore need country-level demographic planning rather than applying U.S. assumptions globally.
- Globally, people ages 16 to 24 are among the most active social media users, closely followed by those ages 25 to 34. The 25-to-34 segment accounts for an estimated 1.3 billion users, making young adults a core audience for paid social campaigns.
- Audience targeting requires care because social-platform populations do not perfectly mirror the general population. Research comparing advertising-platform demographics with census data found demographic representation biases, reinforcing the need to avoid treating platform audience estimates as equivalent to population counts.
B2B vs. B2C Social Media Advertising
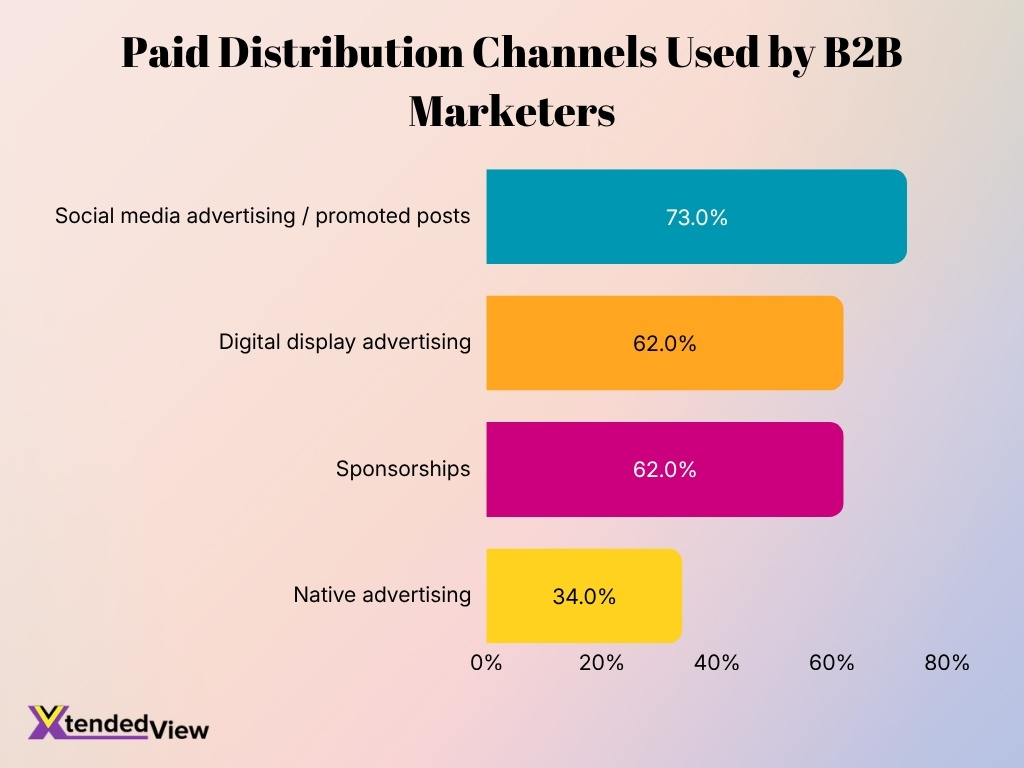
- Paid social is firmly established in B2B marketing. 84% of B2B marketers reported using paid distribution channels in the 2025 benchmark, and 73% of those advertisers used social media advertising or promoted posts.
- B2B marketers use social advertising more often than several other paid formats. Among marketers using paid channels, social advertising’s 73% adoption rate exceeded digital display advertising and sponsorships, both at 62%, as well as native advertising at 34%.
- Professional-network advertising commands a significant share of B2B budgets. One 2025 attribution benchmark found LinkedIn Ads received 32% of total advertising budgets, compared with 11% for Facebook among the businesses analyzed.
- A later benchmark placed LinkedIn Ads at almost 39% of B2B advertising spend among participating customers and calculated a 113% return on ad spend, demonstrating why professional audience data remains valuable for lead-generation campaigns.
- B2B marketers continue increasing their use of professional social platforms. In research covering 2025 strategy, 68% of B2B marketers said they had increased their use of LinkedIn during the preceding 12 months, while 27% reported no change.
- Industry specialization produces even stronger preferences. Among manufacturing marketers, 85% identified LinkedIn as delivering the best value, while 40% selected YouTube.
- In technology marketing, 43% of respondents said social media advertising or promoted posts were among the paid channels producing the best results in 2025. Search advertising led at 56%, while sponsorships reached 54%.
- B2C advertisers generally have broader opportunities to connect paid social directly with product purchases. U.S. social commerce alone reached $87.02 billion in 2025 and is expected to exceed $100 billion in 2026, giving consumer brands more opportunities for shoppable ads and in-app checkout.
- B2B campaigns, by contrast, often optimize for leads, account engagement and longer buying journeys instead of immediate checkout. That difference helps explain why precise professional targeting and attribution carry greater weight in B2B media planning.
- Looking toward 2026, B2B marketers identified 25% of planned incremental investment for paid media and 20% for social or earned media in one industry benchmark, showing that both paid distribution and social visibility remain priorities.
Video Advertising and Short-Form Content Statistics
- In 2025, 89% of businesses used video marketing.
- A benchmark found 41% cited short-form social video as driving ROI.
- Brand-storytelling video drove ROI for 38%, while testimonials and product demonstrations reached 34%.
- Around 17% of marketers identified short-form video as their top content investment.
- Roughly 29% of marketers reported using short-form video formats.
- 81% of consumers wanted more short-form video from brands.
- Approximately 72% of branded social video uploads were classified as short-form.
- The typical TikTok Android user spent about 97 minutes per day in the app.
- A study recorded an Instagram engagement rate of 5.47% compared with 1.42% on TikTok.
Influencer Marketing and Paid Partnerships
- U.S. creator advertising spending is projected to reach $44 billion in 2026.
- The global influencer-marketing-platform segment is estimated to hit $45.2 billion in 2026.
- This 2026 platform valuation represents a significant jump from the $34.2 billion recorded in 2025.
- Prior to 2026 projections, U.S. creator ad spending reached $37 billion in 2025.
- The 2025 creator advertising growth rose by an impressive 26% year over year.
- Creator advertising expanded roughly four times faster than the overall media industry’s 5.7% growth.
- The spending market more than doubled from $13.9 billion in 2021 to $29.5 billion in 2024.
- U.S. marketers allocated roughly $10 billion specifically for social media-sponsored content in 2025.
- Only 16% of B2B marketers leveraged influencer marketing compared to 73% using standard social advertising.
Social Ad Pixel Deployment Statistics
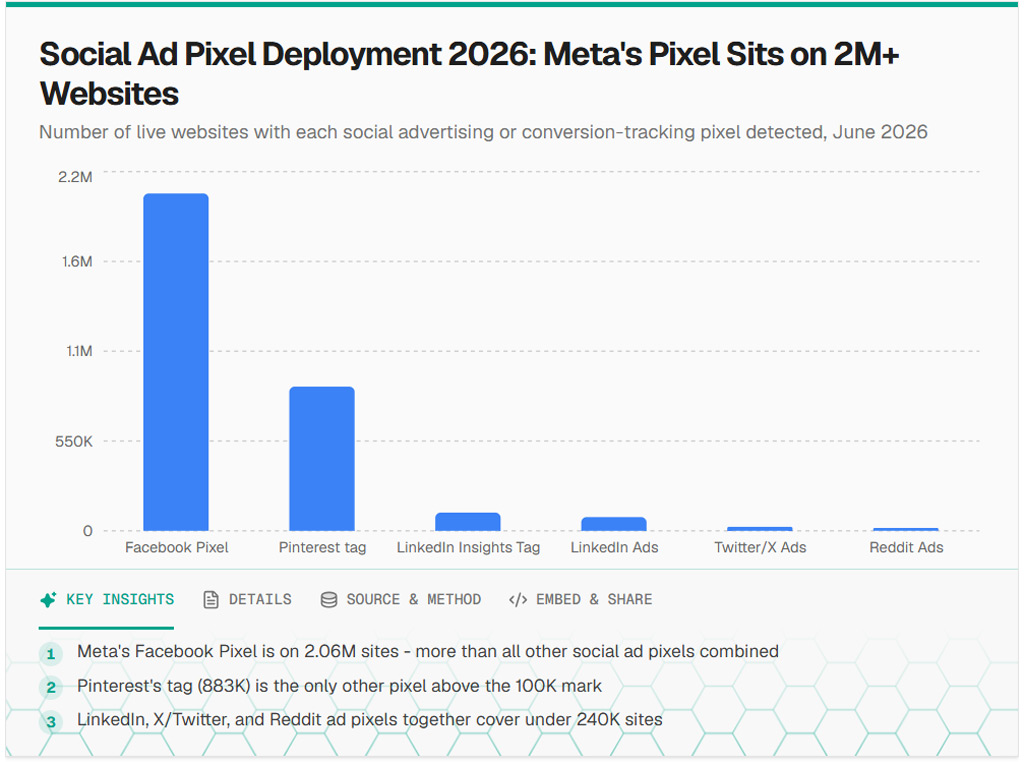
- Meta’s Facebook Pixel dominates social advertising tracking, appearing on approximately 2.1 million live websites as of June 2026.
- Pinterest ranks a distant second, with the Pinterest Tag installed on 883,000 websites, making it the only other pixel in the dataset approaching the million-site level.
- The LinkedIn Insights Tag reaches 111,000 websites, giving LinkedIn a notable footprint among sites tracking advertising conversions and audience activity.
- LinkedIn Ads tracking appears on another 84,000 websites, although its deployment remains substantially below Meta and Pinterest.
- Twitter/X Ads has a comparatively limited presence, with its advertising pixel detected across approximately 24,000 live websites.
- Reddit Ads records the smallest deployment among the platforms shown, with tracking technology installed on about 17,000 websites.
- Facebook Pixel’s 2.1 million-site footprint is more than twice the size of Pinterest’s 883,000-site deployment, highlighting Meta’s strong position in off-platform ad measurement.
- Combined, the three smaller deployments, LinkedIn Ads, Twitter/X Ads, and Reddit Ads, account for about 125,000 websites, only a fraction of Facebook Pixel’s reach.
Social Commerce and Shoppable Ads
- U.S. social commerce sales reached an estimated $87.02 billion in 2025, an increase of 21.5% year over year. Social commerce represented about 6.9% of U.S. retail ecommerce sales.
- U.S. social commerce sales are expected to grow another 18% in 2026, pushing annual sales past $100 billion for the first time. This gives shoppable ads and creator-led retail content a larger direct-response opportunity.
- TikTok Shop generated an estimated $15.82 billion in U.S. sales in 2025, rising 108% from 2024 and accounting for approximately 18.2% of U.S. social commerce sales.
- TikTok Shop’s U.S. ecommerce sales are projected to climb to $23.41 billion in 2026, representing another 48% annual increase. Its rapid expansion illustrates how entertainment feeds can function as both advertising surfaces and retail storefronts.
- More than half of U.S. social buyers, 51%, are forecast to shop on TikTok in 2026, strengthening its position as a product-discovery and transaction channel.
- Purchase frequency is also rising. Nearly 49.7% of TikTok social shoppers were expected to buy through the platform at least once per month, a higher frequency than shoppers on Facebook, Instagram or Pinterest.
- TikTok Shop exceeded $500 million in U.S. sales during the 2025 Black Friday-Cyber Monday period, showing that social commerce can now capture meaningful spending during major retail events.
- U.S. social shoppers increased from roughly 96 million in 2023 to about 104 million in 2025, expanding the addressable audience for shoppable posts, creator storefronts and in-app checkout.
- Adoption does not guarantee profitability. Although 96% of social-first brands viewed social commerce as a high or very high priority in 2025, only 39% reported high ROI, highlighting the importance of conversion tracking, margins and customer acquisition costs.
- Recent consumer research found 45% of U.S. consumers had purchased a product through social media within the previous month, while 50% described social media as their primary way to discover new brands and products. This tightens the connection between social advertising, discovery and commerce.
Social Media Advertising Cost Statistics
- Across 2025 campaigns, the average annual CPM for Facebook and Instagram advertising was $8.19, based on tens of millions of impressions across multiple industries.
- TikTok carried a lower average annual CPM of $4.82 in 2025, making its impression costs roughly 41% lower than the combined Facebook and Instagram benchmark in the same dataset.
- YouTube’s average CPM reached $4.99, placing its 2025 impression cost close to TikTok and below Facebook, Instagram and Snapchat.
- Pinterest recorded the lowest average CPM among the five major platforms in the dataset at $4.67, compared with $8.60 for Snapchat.
- In October 2025, TikTok campaigns averaged a $0.49 cost per link click and a 0.95% link click-through rate, alongside a $4.67 CPM.
- Snapchat’s October 2025 advertising benchmark reached $12.84 CPM, while its cost per link click averaged $0.51 and link click-through rate reached 2.50%.
- Social advertising becomes more expensive around major retail events. During Thanksgiving and Black Friday week in 2024, Facebook and Instagram CPM climbed to $13.42, followed by $12.53 during the week containing Cyber Monday.
- A separate 2026 Facebook advertising benchmark placed median CPM at $13.48, with traffic-campaign CPC averaging $0.70 and lead-generation CPC averaging $1.92. Costs vary substantially with objective, audience and competition.
- Pricing can also rise even when platforms expand inventory. In Q1 2025, overall Meta CPM increased 4% year over year, but Instagram CPM increased 14%, compared with just 1% for Facebook among the advertisers analyzed.
Social Media Advertising by Industry
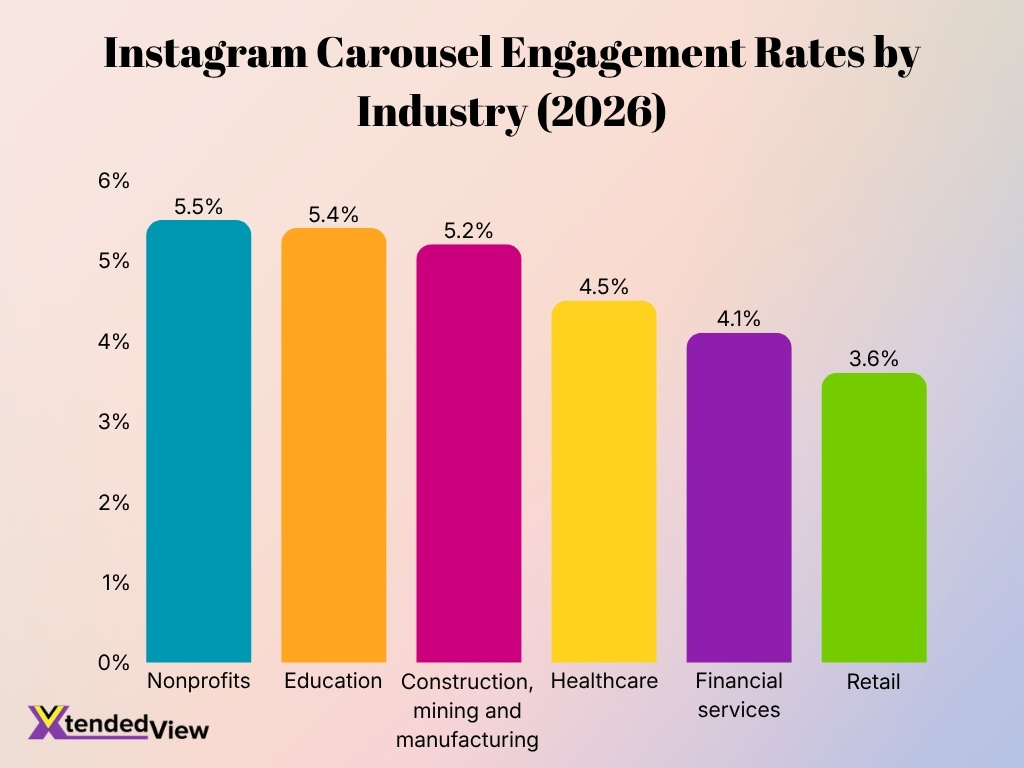
- Education organizations recorded some of the strongest 2026 engagement benchmarks. Instagram carousels produced an average 5.4% engagement rate, while Facebook albums reached 5.2%.
- Financial services brands saw Instagram carousels generate 4.1% engagement, compared with 3.3% for photos and videos on LinkedIn. Instagram also recorded 2.26% weekly follower growth for the sector.
- Healthcare organizations achieved 4.5% engagement with Instagram carousels. Facebook albums reached 3.8%, LinkedIn photos reached 3.4%, and TikTok video averaged 1.0%.
- Retail businesses saw Instagram carousels average 3.6% engagement, while LinkedIn video reached 4.3%. Retail TikTok video averaged 1.6%, illustrating how format performance differs by both industry and platform.
- Construction, mining and manufacturing companies recorded particularly strong Instagram carousel performance at 5.2% engagement. Photos and videos on LinkedIn each averaged 4.0%.
- Entertainment and media companies generated 3.4% engagement from LinkedIn video and 3.2% from Instagram carousels. Their average weekly Instagram follower growth reached 1.82%, ahead of TikTok at 1.51%.
- Nonprofits recorded 5.5% engagement on Instagram carousels, one of the stronger sector-level benchmarks in 2026. Their TikTok audience grew an average 2.15% per week.
- Marketing agencies experienced their fastest follower growth on TikTok, averaging 6.08% per week, compared with 1.62% on Facebook, 1.38% on LinkedIn and 1.36% on Instagram.
- Across 14 industries analyzed in the 2025 benchmark, overall engagement declined year over year by 36% on Facebook, 16% on Instagram, 34% on TikTok and 48% on X. The dataset covered more than 4 million posts and 9 billion interactions.
Privacy Changes and Their Impact on Advertising
- Global App Tracking Transparency (ATT) opt-in rates have fallen to just 13.85%, severely limiting cross-app advertising data.
- By 2026, over 33% of Chrome users have actively opted out of third-party cookies under the updated user-choice model.
- Approximately 71% of advertisers now rely on first-party data for targeting in 2026, up from 54% in 2024.
- The global contextual advertising market expanded to $249 million in 2026 as brands shift away from device-level tracking.
- Around 48% of digital advertisers are currently investing in contextual targeting solutions to mitigate privacy restrictions.
- Retail media networks grew into a $62 billion market in 2026 by utilizing closed-loop attribution that bypasses tracking limits.
- Global programmatic display spend reached $108 billion in 2026, heavily prioritizing privacy-safe audience measurement strategies.
- Gaming applications secured an 18.58% immediate opt-in rate for device tracking, outperforming the 11.92% average of non-gaming apps.
AI and Automation in Social Media Advertising
- AI use in advertising creative accelerated sharply by 2026. 83% of advertising executives said their company had deployed AI in its creative process, up from 60% in the comparable 2024 study.
- Social advertising is the leading channel for AI-generated advertising creative. Among executives whose companies use AI in ads, 85% use it for social media, compared with 73% for display, 56% for TV and 42% for audio.
- Generative AI has become especially important for video production. 86% of advertising buyers reported using or planning to use generative AI to create video advertising. Buyers expected AI-generated creative to account for 40% of ads by 2026.
- Cost efficiency became the top stated AI benefit in 2026, cited by 64% of advertising executives. Creative innovation followed at 61%, showing that companies increasingly judge AI by measurable operational gains.
- Advertisers created nearly 70 million AI-generated assets in Q4 2025 through two major automated advertising products. Across full-year 2025, generated-asset volume tripled.
- Automated delivery is also scaling ad inventory. In Q1 2026, one large social advertising ecosystem delivered 19% more ad impressions year over year, while average ad prices rose 12%. Total quarterly revenue increased 33% to $56.31 billion.
- U.S. spending routed through AI-powered advertising systems is projected to grow 63% in 2026 to $57 billion, representing about 12% of total advertising spending under one market forecast.
- AI adoption creates governance risks as well as efficiencies. More than 70% of marketers in a 2025 industry survey reported encountering an AI-related advertising problem, such as hallucinated information, bias or off-brand output. Fewer than 35% planned to increase AI-governance investment.
- Consumer enthusiasm does not match advertiser enthusiasm. Only 45% of Gen Z and Millennial consumers surveyed in 2026 felt positive about AI-generated advertising, while 82% of ad executives believed those consumers viewed it positively.
- Among Gen Z consumers, 39% expressed negative sentiment toward AI-generated advertising, nearly twice the 20% recorded among Millennials. This suggests that AI can improve scale without automatically improving trust.
Future Projections for Social Media Advertising
- Worldwide social media advertising spending is projected to reach $338.75 billion in 2026 and expand at an 11.86% compound annual growth rate through 2030.
- At that growth rate, global social advertising spending would reach approximately $530.34 billion by 2030, adding roughly $191.6 billion to the market compared with 2026.
- Social networks are expected to capture close to 32% of U.S. digital advertising spending in 2026. Their share is forecast to rise to 32.6% in 2027 even as social media’s share of total media time begins to level off.
- AI may alter the competitive structure of digital advertising. One 2026 forecast projects Meta’s worldwide net digital ad revenue at $243.46 billion, compared with $239.54 billion for Google.
- The same forecast expects Meta’s advertising revenue to grow 24.1% in 2026, compared with 11.9% growth for Google, reflecting increased monetization from automated ad products, short-form video and newer placements.
- Creator advertising is becoming a permanent part of media planning. U.S. creator ad spending is projected to reach $44 billion in 2026, up from roughly $37 billion in 2025.
- U.S. social commerce sales are expected to surpass $100 billion in 2026, creating additional demand for shoppable social ads, creator affiliate campaigns and in-app conversion formats.
- TikTok Shop alone is forecast to produce $23.41 billion in U.S. ecommerce sales in 2026, an increase of 48% from 2025. Its growth shows how social advertising and ecommerce are becoming increasingly difficult to separate.
- U.S. digital video advertising spending, which includes social video, is projected to exceed $80 billion in 2026, increasing 11% year over year and growing almost 20% faster than the overall advertising market.
- AI-driven media buying will likely account for a growing portion of this expansion. U.S. AI-powered advertising spending is projected to grow at roughly a 29% compound annual rate through 2030, as automated systems take on more bidding, targeting, creative, and budget-allocation decisions.
Frequently Asked Questions (FAQs)
Worldwide social media advertising spending is projected to reach $338.75 billion in 2026.
Global social media user identities reached 5.79 billion in April 2026, equal to 69.9% of the global population and up 5.4% year over year.
U.S. social media advertising revenue reached $117.7 billion in 2025, increasing 32.6% year over year.
U.S. creator advertising spending is projected to reach $44 billion in 2026, up from about $37 billion in 2025.
U.S. digital video ad spending, including social video, is projected to exceed $80 billion in 2026, growing 11% year over year.
Conclusion
Social media advertising enters the year with global spending projected at $338.75 billion, while the market could reach $530.34 billion by 2030. Mobile usage, short-form video, creator partnerships, social commerce and AI-powered campaign management continue to shape where brands invest and how they measure results.
At the same time, privacy restrictions, rising auction costs and uneven ROI make disciplined measurement increasingly important. Advertisers that match the right platform, format and audience with measurable business goals will be better positioned as paid social becomes more automated and more closely connected to commerce.
