


Google Search shapes how people discover products, compare prices, and answer everyday questions. Businesses rely on it to drive website traffic, while consumers use it to find local services, breaking news, and shopping recommendations. The platform also powers digital advertising, SEO strategies, and AI-driven search experiences that influence billions of decisions every day. The statistics below reveal the scale of Google’s reach and explain why it remains the world’s dominant gateway to information.
Editor’s Choice
- Google processed an estimated 13.6 billion searches per day in 2025, equivalent to nearly 157,000 searches every second.
- Google handles roughly 5 trillion searches annually, setting a new record for search activity.
- The company controlled 91.27% of the global search engine market in June 2026.
- Google accounted for 95.52% of all mobile search traffic worldwide in May 2026.
- The United States market remained highly concentrated, with Google holding 85.51% search share in May 2026.
- Americans performed an average of 126 Google searches per month on desktop devices during 2024.
- Google Search and YouTube remained the two most-visited websites globally in 2026.
Recent Developments
- Google introduced and expanded AI Overviews across more markets during 2025 and 2026, integrating generative responses directly into search results.
- Google’s search market share briefly dipped below 90% in late 2024, marking the first time in nearly a decade that it fell under that threshold.
- By mid-2025, Google recovered some ground and maintained roughly 90% global search share despite growing AI competition.
- Google announced that annual search activity surpassed 5 trillion searches, a significant jump from previous estimates of around 3 trillion.
- AI tools have increased competitive pressure, with ChatGPT reportedly processing 2.5 billion prompts per day by July 2025.
- AI-driven search traffic increased 527% year over year, signaling a shift in how users seek information online.
- Google’s 2025 “Year in Search” showed that Gemini became the most searched term globally, highlighting mainstream interest in AI.
- Search data increasingly reflects real-time events, with sports, elections, and AI technologies driving global search demand.
Daily, Monthly, and Annual Search Volume
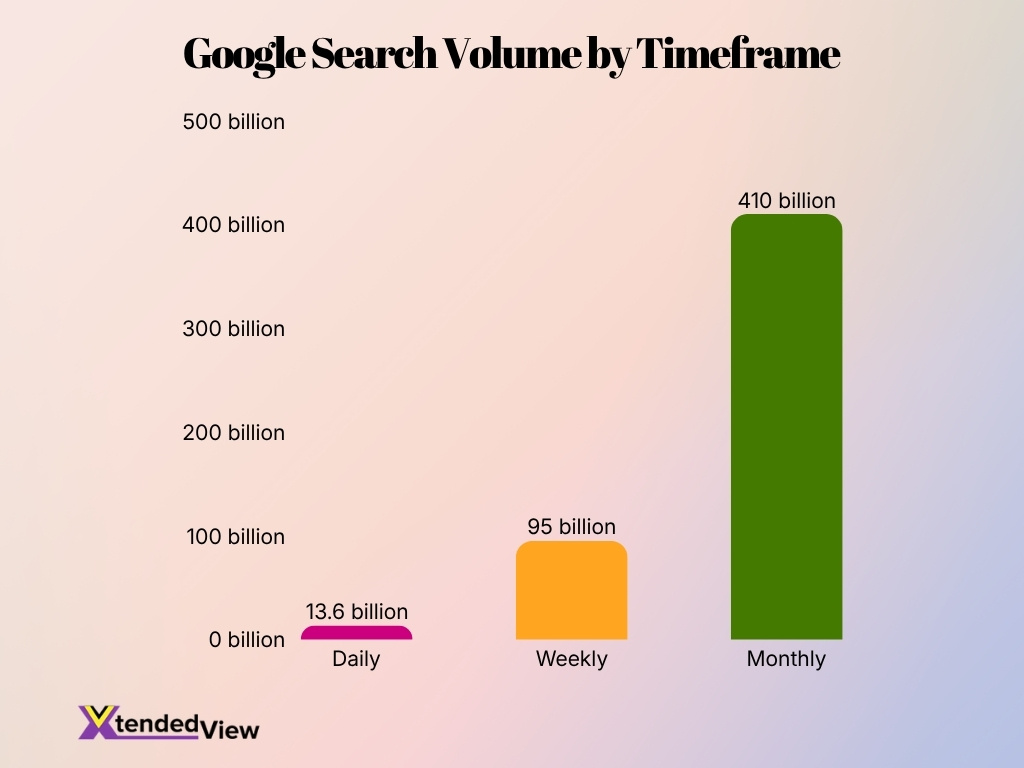
- Google users conduct around 13.6 billion searches every day.
- The search engine handles approximately 95 billion searches each week.
- Monthly search activity exceeds 410 billion searches worldwide.
- Annual search volume now stands near 5 trillion searches, according to Google’s latest estimates.
- Google processes about 189,800 searches every second.
- More than 5.9 million searches occur every minute, representing one of the largest real-time information systems ever built.
- Search activity increased significantly from roughly 3.1 trillion annual searches estimated several years ago to nearly 5 trillion today.
- If distributed evenly across the world’s population, Google processes roughly 1.6 searches per person per day.
Global Google Search Volume Statistics
- Google processes approximately 13.6 billion searches every day worldwide.
- Daily search activity translates into nearly 5 trillion searches annually.
- Around 9.5 million searches occur every minute on Google.
- Users perform nearly 570 million searches every hour on average.
- Google handled only 10,000 searches per day during its first year of operation, illustrating extraordinary long-term growth.
- Approximately 15% of daily searches are entirely new queries that Google has never seen before.
- More than 680 million daily searches are question-based queries, reflecting the platform’s role as an information engine.
- Exploratory and learning-focused searches generate over 1.9 billion daily queries worldwide.
- Google Search volumes increased substantially from around 8.3 billion daily searches in 2024 to more than 13 billion in 2025.
Number of Google Users Worldwide
- Google had an estimated 2.85 billion users worldwide by 2025, making it one of the largest digital platforms on the planet.
- Billions of people use Google products every month, including Search, Maps, Gmail, and YouTube.
- Google Search remains the primary information source for nearly half of internet users when they need answers online.
- Active American desktop users performed an average of 126 unique Google searches per month in 2024.
- The median American desktop user completed 53 Google searches each month.
- Google and YouTube continue to rank as the two most-visited websites globally, giving Google unparalleled audience reach.
- Search behavior increasingly spans multiple devices, with smartphones accounting for the majority of Google usage worldwide.
- The growth of AI search alternatives has not materially reduced Google’s massive user base, which still serves billions of people every month.
Google Search Engine Market Share
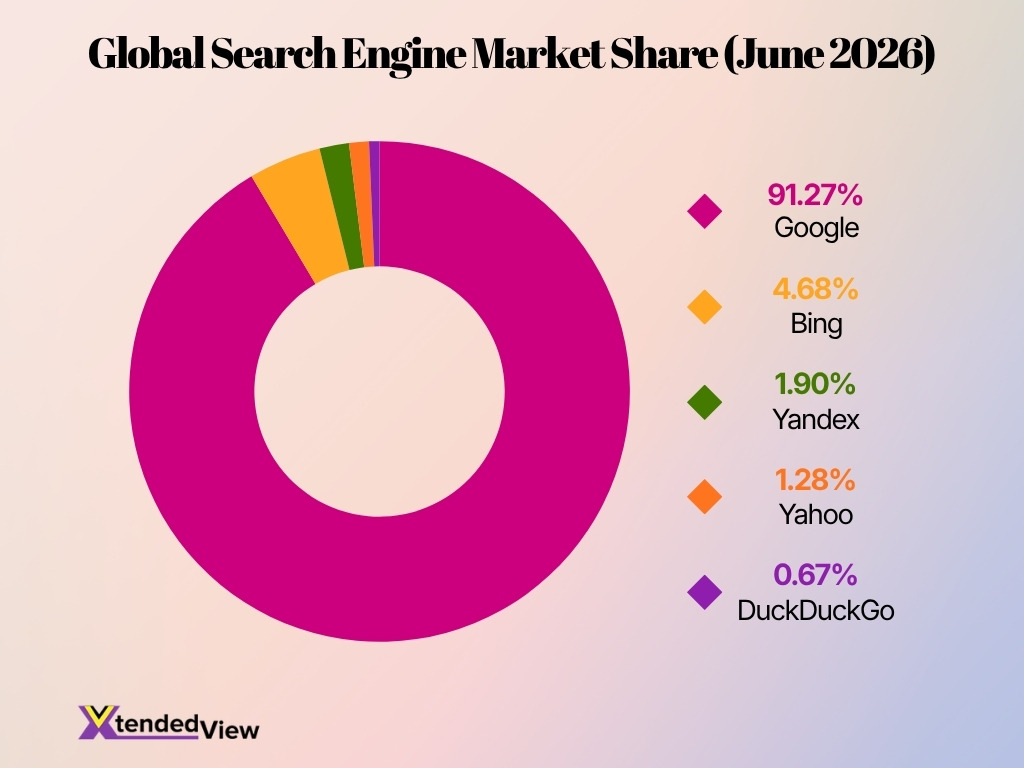
- Google held 91.27% of the global search engine market in June 2026.
- The company maintained approximately 90.39% market share across all devices worldwide in May 2026.
- Google’s market share reached around 90.56% across desktop and mobile devices combined during 2026.
- Search host data showed 89.77% of searches originated on google.com in June 2026.
- Google remained far ahead of Bing, which held only 4.68% of global search market share in June 2026.
- Yahoo’s worldwide search share stood at 1.28%, while DuckDuckGo captured 0.67%.
- Despite rising AI competition, Google still controls roughly nine out of every ten searches worldwide.
- Google’s market share has declined modestly from peaks above 92% in 2023, but it remains the dominant search engine by a wide margin.
Google Market Share by Device Type
- Google accounted for 95.52% of the global mobile search market in May 2026, reinforcing its dominance on smartphones.
- On desktop devices, Google held approximately 79.86% market share worldwide in May 2026.
- Tablets generated a higher concentration of Google searches, with the platform controlling more than 91% of tablet search traffic globally.
- Bing maintained a stronger desktop presence than mobile, capturing around 11% of desktop searches but less than 1% of mobile search activity.
- Google’s mobile search share has consistently remained above 94% for the past five years, despite increased competition from AI-powered search tools.
- More than three out of every four desktop searches worldwide still happen on Google.
- Search traffic from mobile devices now exceeds desktop traffic by a wide margin, increasing Google’s dependence on smartphone ecosystems.
- Android’s global smartphone presence contributes significantly to Google’s mobile search leadership because Google Search ships as the default search engine on most Android devices.
- In the United States, Google remains the leading search engine on both desktop and mobile devices, though desktop competition from Bing remains comparatively stronger.
World’s Most Visited Websites
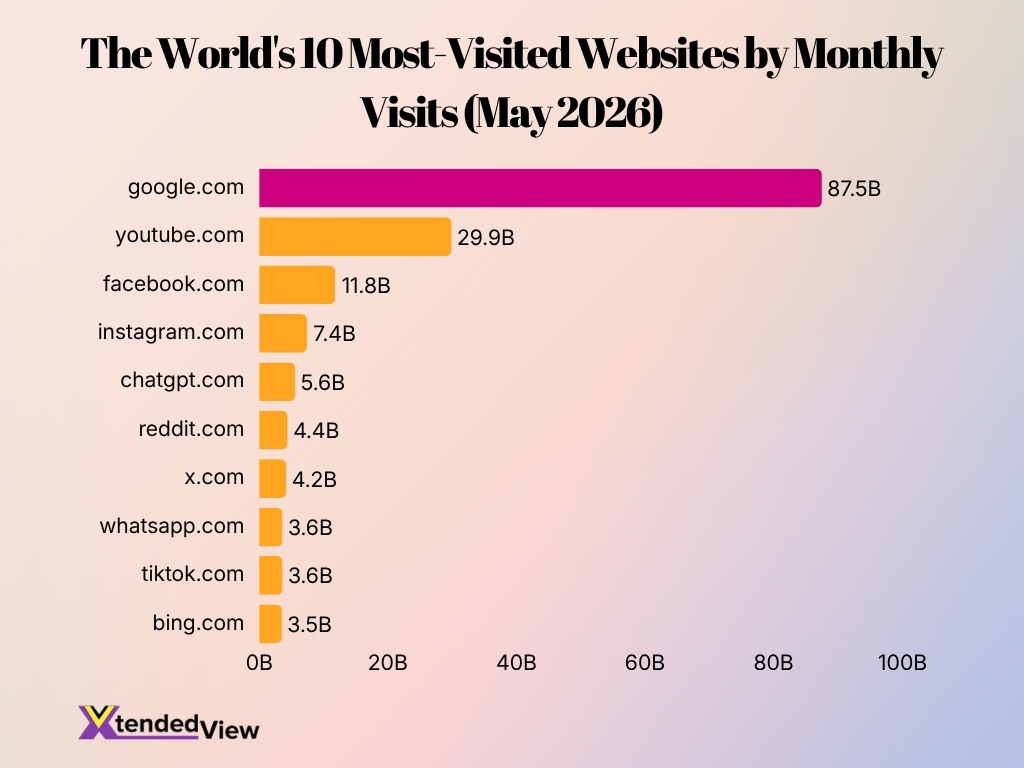
- Google.com remained the world’s most-visited website with 87.5 billion monthly visits, far ahead of every other platform.
- YouTube ranked second with 29.9 billion visits, recording the highest month-over-month traffic growth among the top five at 5.24%.
- Facebook held the third position with 11.8 billion monthly visits, posting a 3.74% annual increase.
- Instagram attracted 7.4 billion visits and delivered a strong 15.46% year-over-year traffic growth.
- ChatGPT ranked fifth with 5.6 billion visits, while achieving an impressive 24.02% yearly increase.
- Reddit recorded 4.4 billion monthly visits and grew 21.32% year over year, one of the fastest growth rates in the top 10.
- X.com received 4.2 billion visits, with traffic increasing 3.28% month over month and 1.53% annually.
- WhatsApp generated 3.6 billion monthly visits but was the largest annual decliner, with traffic falling 5.58% year over year.
- TikTok also reached 3.6 billion visits and posted the highest yearly growth in the ranking at 25.08%.
- Bing rounded out the top 10 with 3.5 billion monthly visits, despite a 2.93% decline in yearly traffic.
Google vs Other Search Engines
- Google held 91.27% global search market share in June 2026, while Bing ranked second at 4.68%.
- Yahoo accounted for roughly 1.28% of worldwide searches, placing it in third position.
- DuckDuckGo generated approximately 0.67% of global search traffic in 2026.
- Yandex maintained around 1.9% market share globally, although it remains significantly stronger in Russia and neighboring countries.
- Baidu controlled less than 1% of global search traffic, despite dominating the Chinese market.
- Google’s share is nearly 20 times larger than Bing’s on a global basis.
- More than 9 out of 10 searches worldwide still occur on Google despite the emergence of AI-powered alternatives.
- ChatGPT reportedly processes around 2.5 billion prompts per day, equivalent to nearly one-fifth of Google’s daily search volume, though prompts and searches are not directly comparable.
- Surveys indicate that users increasingly experiment with AI search tools, yet traditional search engines remain their primary source for news, products, and local information.
Desktop vs Mobile Google Search Usage
- Mobile devices generated approximately 63% of global web traffic in 2026.
- More than 60% of Google searches now occur on smartphones, continuing a trend that began several years ago.
- Desktop devices account for less than 40% of total Google search activity globally.
- Americans perform an average of 126 Google searches per month on desktop devices.
- Mobile users tend to conduct shorter, location-based, and action-oriented searches compared with desktop users.
- More than 76% of people who search for something nearby on a smartphone visit a related business within a day.
- Google reports that mobile searches containing phrases like “open now” and “near me” continue to grow every year.
- Shopping-related searches increasingly originate from smartphones, with consumers comparing products and prices while in stores.
- Mobile search traffic generates a significant share of Google’s advertising revenue because advertisers increasingly target smartphone users.
Google Market Share by Region and Country
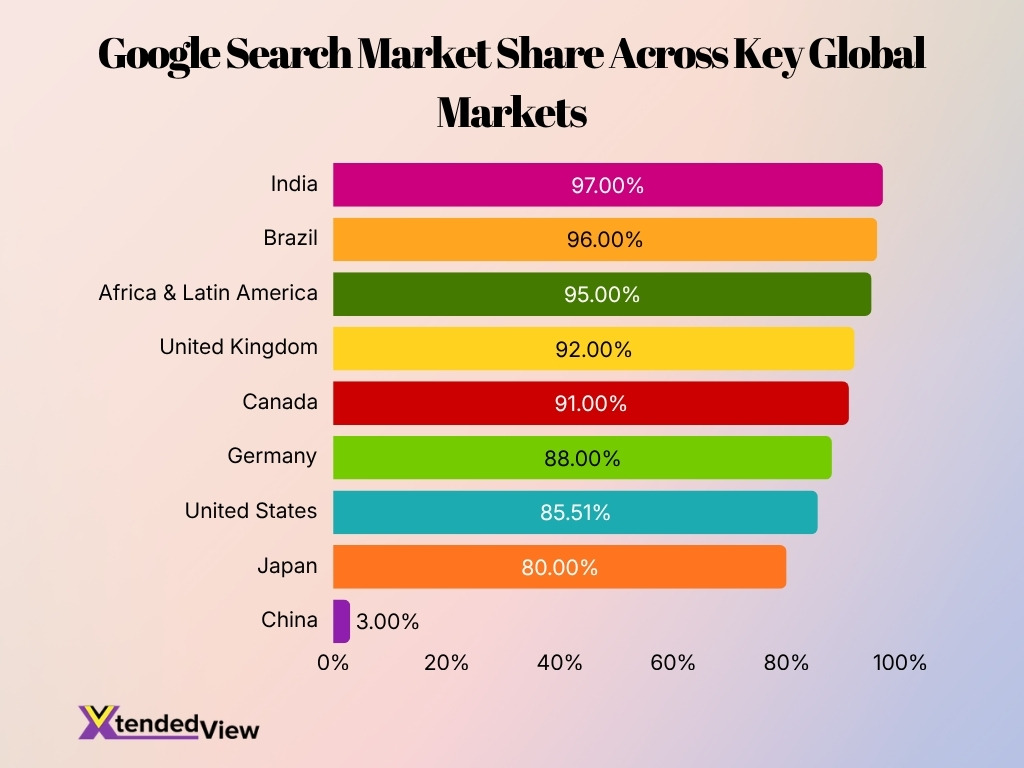
- Google held 85.51% of the search market in the United States during May 2026.
- In Canada, Google accounted for more than 91% of all search activity across devices.
- The United Kingdom reported Google search market share above 92% in 2026.
- Germany maintained Google’s share at roughly 88%, one of the lower levels among major European markets due to stronger local competition.
- In India, Google commanded more than 97% of search traffic, making it one of the company’s strongest markets globally.
- Brazil reported Google search market share exceeding 96%, driven largely by mobile internet usage.
- Japan represented one of Google’s most dominant developed markets, with share consistently above 80%.
- In China, Google’s market share remained below 3% because domestic search providers dominate the market.
- Across Africa and Latin America, Google controls more than 95% of search traffic in many countries, supported by Android’s widespread adoption.
Google Search Behavior and User Engagement
- Around 15% of daily Google searches are entirely new, meaning Google has never seen those exact queries before.
- Users conduct approximately 9.5 million Google searches every minute.
- Nearly 49% of consumers use Google to discover new products or brands.
- More than 80% of online users rely on search engines to answer questions and research topics.
- The average Google search query contains between three and four words.
- Search sessions increasingly include multiple refinements, with users often adjusting their query before selecting a result.
- Product reviews, maps, videos, and featured snippets significantly influence user engagement and click behavior.
- Users increasingly search with conversational phrases because voice assistants and AI tools have normalized natural-language queries.
- Research shows that most searchers click a result within the first few seconds after the results page loads.
Zero-Click Search Statistics
- Approximately 58.5% of Google searches in the United States end without a click, meaning users find their answers directly on the results page.
- Worldwide, nearly 60% of searches are now zero-click searches.
- Mobile devices generate a higher percentage of zero-click searches than desktop devices.
- Featured snippets, knowledge panels, and local packs contribute significantly to the growth of zero-click behavior.
- Weather, definitions, calculations, and sports scores are among the most common zero-click query categories.
- Around 30% of clicks on Google go to platforms owned by Google, including YouTube, Maps, and Shopping.
- Organic websites face increasing competition because Google provides more answers directly in search results.
- Publishers increasingly optimize content for featured snippets and rich results to maintain visibility despite declining click-through rates.
- The expansion of AI-generated summaries could push zero-click search rates even higher in the coming years.
SERP Outcome Distribution by Query Type
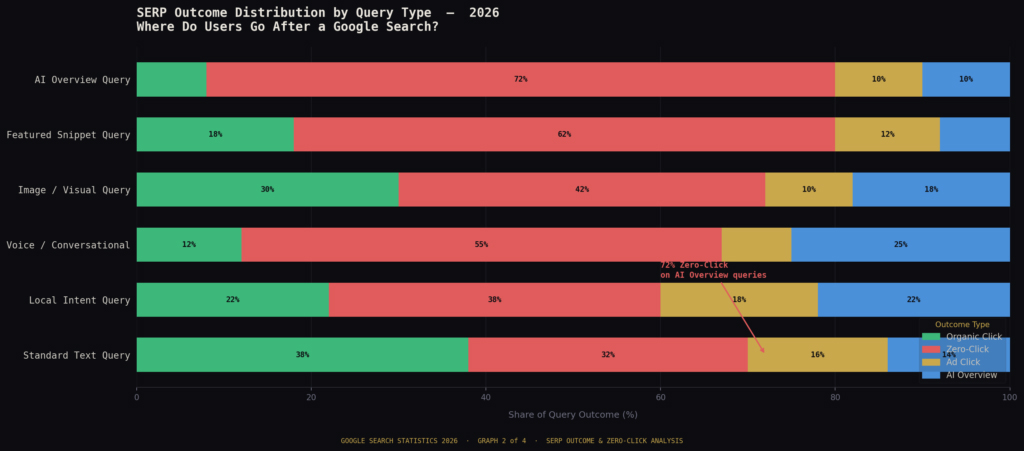
- AI Overview queries record the highest zero-click rate at 72%, with only 4% resulting in an organic click.
- Featured Snippet queries generate a 62% zero-click rate, while 18% of users continue to organic results.
- Image / Visual queries drive the highest organic click share at 30% among non-standard search types.
- Voice / Conversational searches see 55% zero-click outcomes, while 25% of users engage with AI Overviews.
- Local Intent queries are evenly split between organic clicks (22%) and AI Overview interactions (22%).
- Standard Text queries achieve the strongest organic click rate at 38%, exceeding their 32% zero-click rate.
- AI Overview usage is highest for Voice / Conversational searches (25%), followed by Local Intent queries (22%).
- Ad clicks peak in Local Intent queries at 18%, highlighting stronger commercial search behavior.
- Standard Text queries produce 16% ad clicks, making them the second most ad-driven query category.
- Image / Visual queries receive 18% AI Overview interactions, indicating growing AI engagement in visual search.
- Featured Snippet queries have a relatively low 8% AI Overview share, compared to other search types.
- The data shows that zero-click behavior dominates AI Overview, Featured Snippet, and Voice searches, while Standard Text searches still deliver the highest level of organic website traffic.
AI Overviews and Generative Search Statistics
- Google expanded AI Overviews to more than 200 countries by 2025.
- The generative search feature now supports over 40 languages globally.
- AI Overviews successfully reach over 1.5 billion users every single month.
- AI-generated summaries reduce clicks to traditional organic listings by 15% to 30%.
- AI-powered search traffic across the web increased by more than 500% during 2025.
- Top-ranking web pages experience up to a 58% lower average click-through rate.
- Conversational search queries of ten or more words trigger AI summaries 53% of the time.
- Nearly 88% of generated AI Overviews cite three or more unique sources per response.
- Approximately 60% of Google searches now end without a click to any external website.
Google Image, Video, and News Search Statistics
- Google Images accounts for approximately 10% to 12% of all Google searches, making it one of the world’s largest visual search platforms.
- More than one billion visual searches occur on Google Lens every month, reflecting growing interest in image-based discovery.
- Google Lens usage increased substantially, surpassing 20 billion visual searches per month across all surfaces by 2025.
- YouTube videos appear in roughly one-quarter of Google search results, particularly for tutorials, reviews, and educational topics.
- News-related searches surge during major global events, elections, and sporting tournaments, generating billions of additional search impressions.
- Google News serves users in more than 125 countries and 40 languages.
- Video results frequently outperform standard text listings for how-to and product-related queries.
- Mobile users increasingly rely on image search and visual shopping experiences to identify products and compare prices.
- Publishers continue investing in video SEO because multimedia content receives prominent placement in Google’s search results.
Voice Search and Google Assistant Usage
- By 2026, the number of voice assistant users in the US is projected to reach 157.1 million.
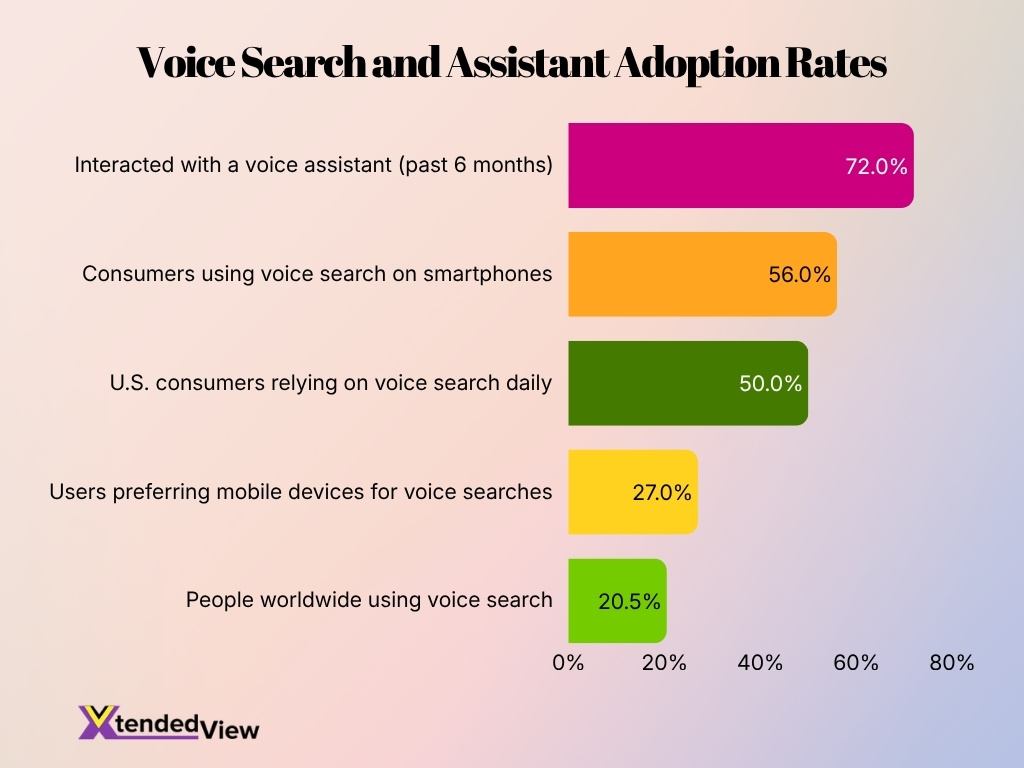
- Approximately 20.5% of people worldwide regularly use voice search for online queries.
- Globally, Google Assistant commands a dominant 36% market share among digital voice assistants.
- The average voice search result page loads 52% faster than a standard web page.
- Around 56% of consumers use voice search on their smartphones to research brands or businesses.
- Over 50% of U.S. consumers rely on voice search on a daily basis.
- Nearly 27% of users explicitly prefer mobile devices to carry out their voice searches.
- Approximately 72% of individuals have interacted with a voice assistant in the past six months.
- The average length of a voice search query is typically around 29 words.
Local Search and “Near Me” Query Statistics
- Nearly 46% of all Google searches have local intent, meaning users are looking for nearby information or businesses.
- Searches containing phrases like “near me” have increased dramatically over the past several years and continue to rise.
- Around 76% of people who search for something nearby on a smartphone visit a business within one day.
- Approximately 28% of local searches result in a purchase within 24 hours.
- More than 88% of consumers who perform a local search on a mobile device contact or visit a business within a week.
- “Open now” searches have continued to grow as users increasingly seek immediate services and real-time business information.
- Local search has become essential for industries such as restaurants, healthcare, automotive services, and home improvement.
- Businesses with complete profiles, reviews, and updated hours generally perform better in local search visibility.
- Mobile devices generate the majority of local search traffic because users often search while traveling or shopping.
Google Search Advertising Spend and ROI Statistics
- Google generated $307 billion in advertising revenue in 2025, representing the vast majority of its total income.
- Advertisers earn an estimated $2 in revenue for every $1 spent, yielding a 200% return on investment.
- The average click-through rate for search ads across all industries currently sits at approximately 6.66%.
- The average cost-per-click across all sectors is $5.26, with the legal industry facing the highest rates.
- Search advertisements achieve an impressive average conversion rate of 7.52% across various business categories.
- Over 86% of active campaigns now utilize automated Smart Bidding to optimize ad performance and targeting.
- Mobile devices generate approximately 68% of all ad clicks, reflecting the dominance of mobile search behavior.
- Roughly 80% of global businesses allocate a portion of their digital marketing budget to search advertising.
Future Outlook for Google Search Usage
- Google currently maintains a massive 90.04% share of the global search engine market across all devices.
- The search engine processes over 5 trillion searches annually, reflecting continuous growth alongside global internet access.
- AI Overviews now appear in more than 25% of all Google searches, rapidly becoming a standard component of search results.
- Mobile devices continue to dominate the landscape, accounting for an unprecedented 94.6% of Google’s global search market share.
- Driven by shopping and product discovery, visual search tools now process over 20 billion queries every single month.
- The global voice search market is expanding rapidly and is projected to reach a staggering value of $176.91 billion by 2035.
- Reflecting a major shift toward conversational search behavior, alternative AI chatbots now process over 2.5 billion daily queries.
- Businesses cited within AI-generated summaries experience a 35% increase in organic clicks compared to their non-cited competitors.
Frequently Asked Questions (FAQs)
Google processes approximately 13.6 billion searches per day, which equals nearly 5 trillion searches annually.
Google holds 91.27% of the worldwide search engine market, far ahead of all competitors combined.
Around 58% to 62% of Google searches are zero-click searches, meaning users get their answers directly on the results page.
Google AI Overviews reach approximately 2.5 billion monthly users, making them one of the largest generative AI products globally.
Studies show that about 50% to 55% of Google searches in the U.S. now generate an AI Overview response, depending on the query type and dataset used.
Conclusion
Google Search remains the world’s most influential information platform, processing an estimated 5 trillion searches every year and maintaining more than 90% global market share. Search behavior continues to evolve through mobile usage, AI-generated results, voice interactions, and visual discovery tools. At the same time, local search and paid search advertising continue to deliver measurable value for businesses and consumers alike.
The next phase of Google Search will likely center on generative AI, conversational experiences, and multimodal discovery. Yet the underlying mission remains unchanged: helping people find relevant information quickly and accurately. For marketers, publishers, and businesses, understanding these statistics provides a clearer view of where search is heading and how to prepare for the opportunities ahead.
