Smartphones now shape how people communicate, shop, work, learn, and access financial services. Businesses use smartphone data to improve mobile commerce and customer engagement, while healthcare providers, educators, and transportation companies increasingly rely on mobile-first experiences. The latest statistics reveal how smartphone adoption continues to evolve across the US and worldwide. Explore the data below to understand the trends driving today’s mobile economy.
Editor’s Choice
- More than 5.83 billion people worldwide use a mobile phone in 2026, representing 70.4% of the global population.
- Smartphones now account for approximately 89.1% of all mobile handsets in active use worldwide in 2026.
- Around 7.65 billion smartphone connections are active globally in 2026, reflecting continued migration away from feature phones.
- Global smartphone connections are forecast to reach 7.59 billion in 2026, up from 7.38 billion in 2025.
- Worldwide smartphone market revenue is projected to reach $503.1 billion in 2026.
- Global smartphone shipments reached 293.8 million units during Q1 2026, although quarterly shipments declined 2.9% year over year.
- Smartphone adoption continues to expand across developing economies, with nearly 230 million additional smartphones added during the past 12 months.
Recent Developments
- The smartphone industry entered 2026 facing supply-side challenges, with IDC forecasting 1.09 billion smartphone shipments for the full year because of memory shortages.
- IDC expects global smartphone shipments to decline 13.9% year over year in 2026, marking one of the steepest annual contractions on record.
- Premium smartphones continue to outperform budget models despite lower overall shipment volumes.
- Rising memory prices have increased manufacturing costs and pushed average smartphone selling prices higher in 2026.
- Samsung and Apple both increased market share during Q1 2026 despite weaker global demand.
- Smartphone shipments declined 2.9% globally during Q1 2026 after nearly three years of consecutive quarterly growth.
- Foldable phones and AI-powered premium devices remain among the fastest-growing product categories entering 2026.
- Analysts expect market recovery to begin once component supply stabilizes, with growth projected to resume after 2027.
Number of Smartphone Users Worldwide
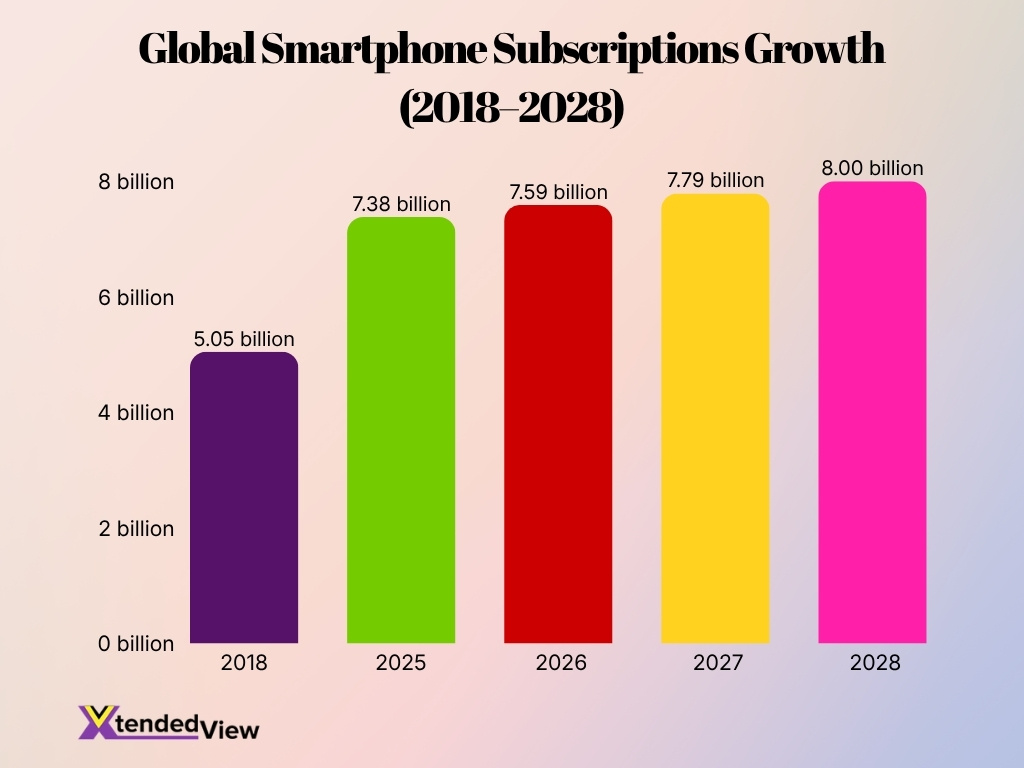
- Smartphone subscriptions are projected to reach 7.59 billion globally during 2026.
- Global smartphone subscriptions totaled approximately 7.38 billion in 2025.
- Smartphone subscriptions grew by roughly 214 million between 2025 and 2026.
- Forecasts indicate smartphone subscriptions will exceed 7.79 billion in 2027.
- Worldwide subscriptions are expected to approach 8 billion by 2028.
- China, India, and the United States remain the three largest smartphone markets by subscriber count.
- Smartphone subscriptions have more than doubled since 2018, when global subscriptions stood near 5.05 billion.
- Long-term forecasts continue to show steady smartphone adoption despite slower replacement cycles.
Global Smartphone Ownership and Penetration
- Around 70.4% of the world’s population now owns or uses a mobile phone.
- Smartphones represent approximately 89% of all mobile devices currently in use worldwide.
- More than 4 in 5 people now live in urban areas where smartphone access continues to expand rapidly.
- Global smartphone adoption continues to grow by approximately 3.1% annually.
- Smartphone connections increased by nearly 230 million over the past year worldwide.
- Unique mobile users increased by 103 million between 2025 and 2026.
- Many consumers now own multiple smartphones, resulting in smartphone connections exceeding the number of unique users.
- Emerging markets across Asia, Africa, and Latin America continue to drive most new smartphone adoption globally.
Smartphone Ownership by Country and Region
- The United States remains a highly mature market, with adult smartphone ownership exceeding 90% according to recent industry estimates.
- China continues to lead the global market, generating an estimated $118.2 billion in smartphone revenue in 2026.
- Indiaremains one of the fastest-growing markets due to affordable Androids and 5G, boasting over 659 million smartphone users.
- Western Europe continues to report strong digital connectivity, with smartphone penetration remaining above 85% across most major economies.
- Sub-Saharan Africais rapidly replacing feature phones with low-cost smartphones, with countries like Nigeria reaching 83.3 million smartphone users.
- Latin America is rapidly adopting mobile internet, led by markets like Brazil which has reached a 66.6% smartphone penetration rate.
- Southeast Asiarecords strong adoption fueled by digital payments, with Indonesia reaching over 187.7 million smartphone users.
- Developed markets focus on premium upgrades given their 80% or higher penetration, while emerging markets continue adding millions of first-time smartphone users.
Smartphone Usage by Age Group
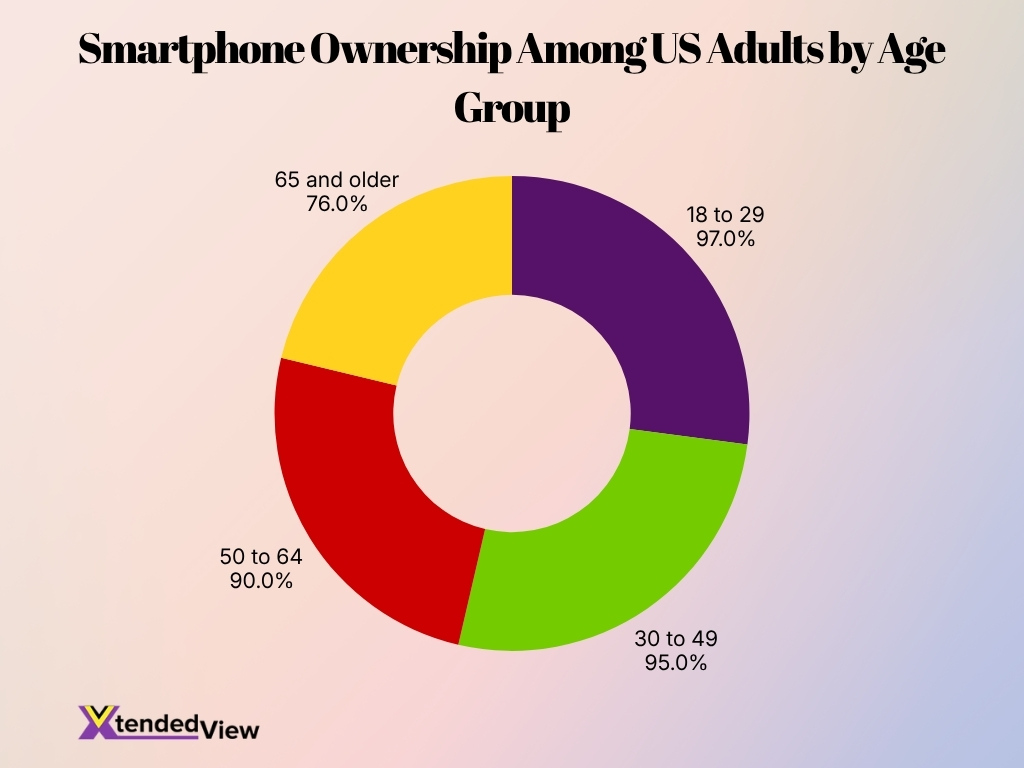
- An overwhelming 97% of adults aged 18 to 29 currently own a smartphone.
- Smartphone ownership among adults aged 30 to 49 remains consistently above 95%.
- More than 90% of Americans aged 50 to 64 are now active smartphone users.
- Adoption among adults 65 and older has reached 76%, up from just 53% a decade ago.
- Younger users average over 5.5 hours of daily screen time on mobile apps.
- A striking 95% of teenagers use a smartphone as their primary device for internet access.
- Over 89% of Millennials and Gen Z actively use mobile banking applications.
- Nearly 65% of older adults now use their smartphones for healthcare access and video calls.
Smartphone Usage by Generation
- 95% of US Gen Z consumers owned a smartphone in 2024, while the corresponding rate reached 98% in the UK. These near-universal ownership levels set the baseline for Gen Z usage entering 2026.
- In 2025, adults ages 18 to 24 spent 6 hours and 20 minutes online each day across personal smartphones, tablets and computers. This was the highest average among all measured adult age groups.
- Smartphone activity accounted for 79% of women’s personal online time and 75% of men’s online time in May 2025, showing that mobile devices dominate internet access across generations.
- Adults ages 65 and older averaged 3 hours and 20 minutes online per day in 2025. Although this was the lowest generational average, it still represented substantial daily digital engagement.
- In a 2024 US survey, 95% of teenagers reported access to a smartphone, up 22 percentage points from 73% in 2014-15.
- 44% of US teenagers said being without their phone made them feel anxious at least sometimes, highlighting the device’s emotional role among younger users.
- Teen girls were more likely than teen boys to say they spent too much time on their smartphones, at 44% versus 33%.
- In India, 90% of children ages 14 to 16 had access to a smartphone at home in 2024. Among them, 76% used digital devices for social media recreation, compared with 57% who used them for education.
Average Daily Smartphone Usage
- Mobile users spent an estimated 5.3 trillion hours in apps during 2025, an increase of 3.8% year over year.
- The 2025 total equaled approximately 3.6 hours of app use per mobile user each day. This figure excludes some browser-based and system-level smartphone activity.
- In 2024, mobile users spent 4.2 trillion hours across iOS and Google Play apps, or about 3.5 hours per user per day.
- Therefore, average app time increased by roughly six minutes per user per day between the 2024 and 2025 reporting periods.
- Adults in Great Britain spent an average of 3 hours and 21 minutes daily on mobile phones in 2025. That total exceeded traditional television viewing for the first time.
- Daily mobile use in Great Britain has nearly tripled from 1 hour and 17 minutes a decade earlier.
- People younger than 24 in Great Britain spent close to five hours per day on mobile phones in 2025, compared with 1 hour and 49 minutes watching traditional television.
- Indian users spent an average of 3.2 hours per day on social media in 2025, illustrating how a single activity category can account for much of total smartphone use.
Daily Smartphone Screen Time
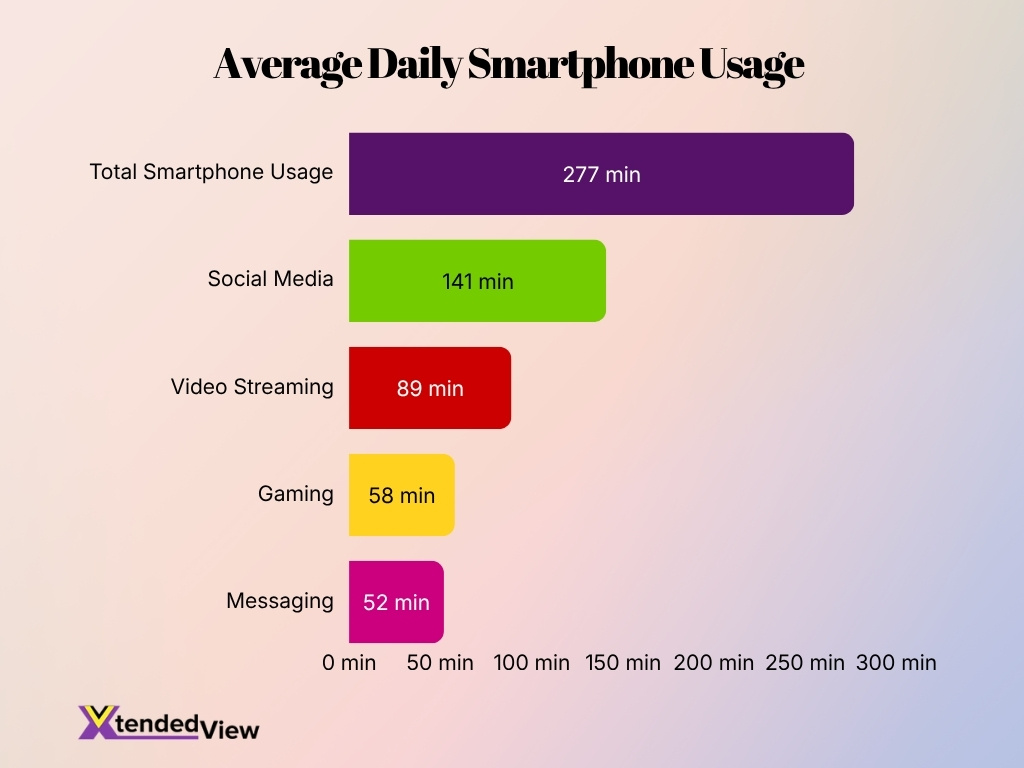
- Average total smartphone usage reached 4 hours and 37 minutes per day in 2026.
- Social media accounted for the largest share of screen time at 2 hours and 21 minutes daily.
- Users spent an average of 1 hour and 29 minutes per day watching videos on smartphones.
- Daily gaming time averaged 58 minutes, making it another major smartphone activity.
- Messaging occupied approximately 52 minutes per day.
- Social media and video streaming combined represented 3 hours and 50 minutes of daily smartphone engagement.
- The data highlights how entertainment and communication activities dominate overall smartphone usage.
Smartphone Checking and Unlock Frequency
- A 2025 US analysis estimated that the average user checked a device 58 times per day.
- At that rate, a person checks a device approximately once every 16½ minutes during a 16-hour waking day.
- More than half of recorded device checks took place during working hours, showing how smartphone habits extend into professional settings.
- Researchers cited in a 2025 behavioral analysis noted that checking a phone more than 100 times daily may indicate problematic or highly fragmented use.
- The same research found that checking frequency can predict attention and memory problems more strongly than total screen time alone.
- 36% of US teenagers used at least one of five leading social platforms almost constantly in 2025, making frequent phone opening and app switching common within this group.
- 21% of US teens said they used TikTok almost constantly in 2025, up from 16% in 2022.
- In a three-week experimental study of 109 undergraduates, 19.3% said they were unwilling to use an app that restricted smartphone activity because they disliked restrictions or found such tools annoying.
Mobile App Usage Statistics
- Global consumer spending in mobile apps reached $167 billion in 2025. For the first time, consumers spent more on non-game apps than on mobile games.
- Mobile app spending totaled $150 billion in 2024, meaning consumer expenditure increased by approximately $17 billion in one year.
- App downloads across iOS and Google Play totaled about 136 billion in 2024 and remained broadly flat year over year.
- Annual downloads have stayed within a range of roughly 135 billion to 140 billion since 2020 as major app markets mature.
- Generative AI app downloads increased 148% year over year in 2025, making AI one of the fastest-growing app categories.
- Short-drama app downloads rose 278% in 2025, reflecting rapid demand for serialized, mobile-first video entertainment.
- Facebook’s mobile app still attracted approximately 2.3 billion users per month at the start of 2025.
- The average global social media user engaged with 6.83 platforms per month in early 2025, reinforcing the importance of multi-app behavior.
- Forecast models project that consumers will spend 58 trillion hours in apps during the decade, indicating that mobile apps will retain a central role in entertainment, communication and commerce.
Most Common Smartphone Activities
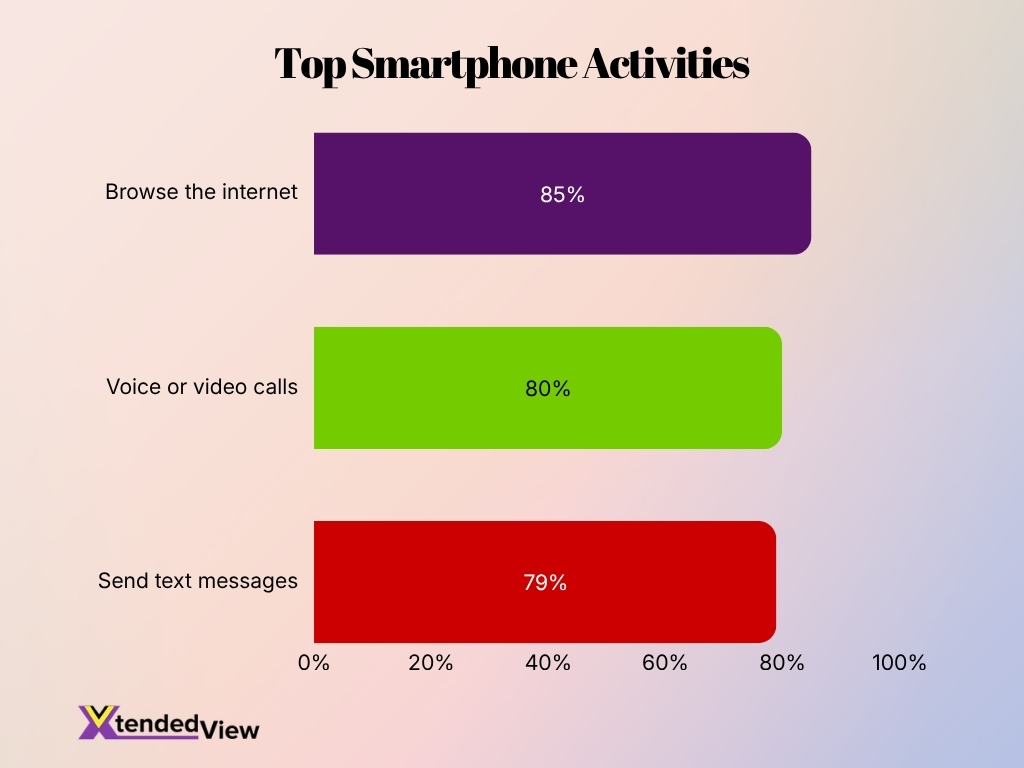
- In a 2025 multi-country survey, 85% of respondents used their phones to browse the internet, making web access the most frequently reported activity.
- 80% used phones for voice or video calls, demonstrating that direct communication remains central despite app growth.
- 79% used mobile phones to send text messages.
- 98% of respondents used social media, making it one of the most widespread smartphone-supported activities in the surveyed African markets.
- In India, average monthly mobile data consumption reached 24 GB per user in 2025, compared with only 62 MB in 2014.
- 64% of US teenagers used an AI chatbot in 2025, showing how generative AI became a mainstream mobile-accessed activity.
- About 30% of US teens used AI chatbots every day, including 16% who used them several times per day or almost constantly.
- Among children ages 8 to 14, YouTube reached 96% and Google Search reached 95% during an average month in 2025, highlighting the importance of video and search on connected devices.
Smartphone Shopping and Ecommerce Usage
- Smartphones generated 56.4% of US online holiday spending from Nov. 1 through Dec. 31, 2025, up from 54.5% during the 2024 holiday season.
- Mobile devices produced 66.5% of online sales on Christmas Day 2025, compared with 65% on the same day in 2024.
- Smartphones accounted for 61.6% of Thanksgiving Day online sales in 2025, an increase from 59.3% a year earlier.
- US consumers spent a record $257.8 billion online during the 2025 holiday season. Spending increased 6.8% from 2024, supporting continued growth in smartphone-based retail activity.
- Buy now, pay later services generated $20 billion in online holiday spending in 2025, up 9.8% year over year. Smartphones handled 82.2% of those purchases.
- Cyber Monday produced $1.03 billion in buy now, pay later spending in 2025, marking the first time the payment category exceeded $1 billion in a single day.
- Mobile devices handled only 38.8% of online returns during the 2025 holiday season, even though they generated more than half of online spending. This gap suggests that many shoppers prefer larger screens for return processing.
- Social media generated 4.6% of US online holiday revenue in 2025, up from 3.3% in 2024. Its revenue contribution increased 40.3% year over year.
- US retail ecommerce represented 16.9% of total retail sales in Q1 2026, up from 16% in Q1 2025.
- The global mobile commerce market reached an estimated $2.24 trillion in 2025 and is projected to rise to about $2.42 trillion in 2026.
Android and iPhone Usage Statistics
- Android generated 73% of global smartphone sales in Q1 2026, maintaining a clear lead over every competing operating system.
- iOS captured 22% of global smartphone sales in Q1 2026, its highest recorded share for a January-to-March quarter.
- Together, Android and iOS represented approximately 95% of worldwide smartphone sales in Q1 2026. This leaves only a small portion for alternative operating systems.
- Android’s Q1 2026 global sales share exceeded the iOS share by 51 percentage points.
- Android sales were approximately 3.3 times the iOS total worldwide during Q1 2026.
- Apple accounted for 31.95% of worldwide mobile web activity in the period ending May 2026, while Samsung accounted for 18.84%. These figures measure active device usage rather than unit sales.
- Android users reported stronger password habits in a 2025 survey, 41% used unique passwords, compared with 35% of iPhone users.
- 29% of Android users said they used mobile security software in 2025, compared with 21% of iPhone users.
- 55% of iPhone owners trusted their phone’s built-in security to keep them safe, slightly above the 50% recorded among Android owners.
- Reported scam exposure reached 53% among iPhone users and 48% among Android users in the same international survey.
Smartphone Market Share
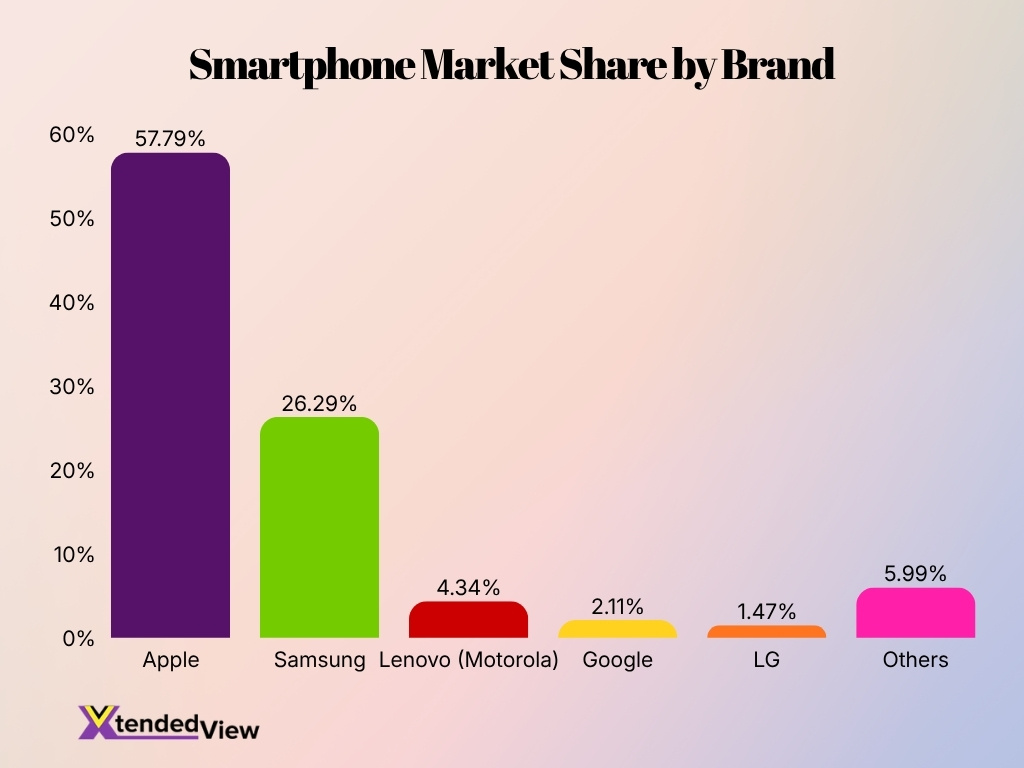
- Apple dominates the smartphone market with a 57.79% share of ownership, making it the leading smartphone brand by a significant margin.
- Samsung ranks second with a 26.29% market share, accounting for more than one-quarter of total smartphone ownership.
- Apple and Samsung together control 84.08% of the smartphone market, highlighting the strong dominance of the two leading brands.
- Lenovo (Motorola) holds a 4.34% share, making it the largest brand outside of Apple and Samsung in this dataset.
- Google captures 2.11% of smartphone ownership, reflecting a relatively small but notable presence in the market.
- LG accounts for 1.47% of smartphone ownership, representing one of the smallest shares among the listed brands.
- The Others category contributes 5.99%, indicating that all remaining smartphone manufacturers collectively account for less than 6% of the market.
- The data shows a highly concentrated smartphone market, with the top two brands controlling the overwhelming majority of smartphone ownership.
5G Smartphone Adoption Statistics
- Global 5G subscriptions exceeded 2.9 billion by the end of 2025, accounting for roughly one-third of all mobile subscriptions.
- The number of 5G subscriptions increased by approximately 600 million during 2025.
- 5G networks carried 48% of global mobile data traffic at the end of 2025, up from 34% at the beginning of the year.
- The 5G share of mobile data traffic is projected to reach 85% by 2031 as consumers replace older smartphones and networks expand capacity.
- Global 5G subscriptions are forecast to reach 6.4 billion by 2031, representing about two-thirds of all mobile subscriptions.
- More than 390 service providers had launched commercial 5G services by mid-2026, including over 90 that had introduced standalone 5G networks.
- North America, Western Europe, Northeast Asia and Gulf countries are each projected to approach or exceed 90% 5G subscription adoption by 2031.
- Europe’s 5G adoption rate is forecast to reach 88% by 2030, while Latin America is projected to reach 50%.
- Asia-Pacific 5G connections are projected to represent 50% of the region’s mobile connections by 2030. Adoption has already approached mass-market levels in Australia, Japan and Singapore.
- Africa had commercial 5G services from 53 operators across 29 markets by September 2025. In addition, 25 operators offered commercial 5G fixed wireless access.
Social Media Usage on Smartphones
- 99.3% of users of major Meta platforms accessed those services through mobile devices in early 2025. This makes smartphone behavior a strong indicator of overall social platform use.
- YouTube ranked as the world’s most-used social platform at the start of 2025, based on third-party active-user estimates.
- YouTube’s Android active-user base was approximately 16% larger than that of WhatsApp, its nearest competitor, in November 2024.
- 16.6% of adult social media users identified Instagram as their favourite social platform in early 2025.
- TikTok ranked among the top five favourite platforms, selected by 8.1% of adult social media users.
- 90% of US teens used YouTube in 2024, making it the most widely used platform among surveyed teenagers.
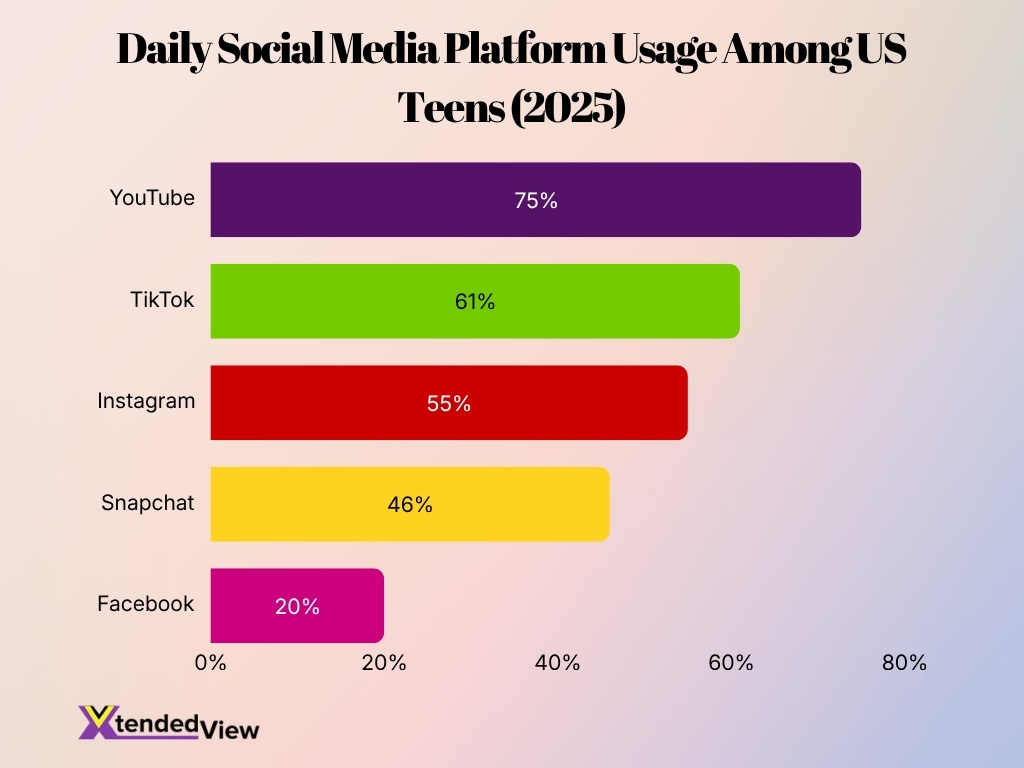
- In 2025, 75% of US teens visited YouTube daily, while 61% used TikTok daily and 55% used Instagram daily.
- Snapchat reached 46% of US teens daily, compared with 20% for Facebook.
- Teen boys were more likely than teen girls to use YouTube almost constantly, at 20% versus 13%, while girls reported higher near-constant use of TikTok and Instagram.
- India had approximately 500 million unique social media users by late 2025, including an estimated 481 million Instagram users and 403 million Facebook users.
Smartphone Privacy and Security Habits
- 24% of smartphone users in an international survey said they had experienced a phishing attack involving a fraudulent text, email or phone call.
- After experiencing a security problem, 73% of affected consumers said they had less trust in their smartphone brand or operating system provider.
- In controlled testing, no assessed premium smartphone blocked every simulated phishing text, call and email, indicating that user judgment remains an important layer of protection.
- Only 21% of surveyed iPhone users had installed mobile security software, compared with 29% of Android users.
- Just 35% of iPhone owners used a unique password for each online account. The corresponding rate among Android owners reached 41%.
- 47% of iPhone users had bought an item from an unknown seller because it offered the lowest price, compared with 40% of Android users.
- 41% of iPhone users had contacted an unfamiliar seller through a social media direct message to obtain a discount. Android users reported this behavior at a lower rate of 33%.
- Half of US adults spent at least five hours per day on their phones in a 2025 survey, increasing the number of daily opportunities for phishing, account theft and privacy exposure.
- More than 60% of Gen Z adults spent at least five hours per day on their phones, although younger users reported greater use of passkeys and social sign-ins than older consumers.
- A 2025 assessment of 92 Android ecommerce apps found that 77 requested excessive permissions, while the apps received an average mobile security score of 40.92 out of 100.
Frequently Asked Questions (FAQs)
There are approximately 5.83 billion unique mobile users worldwide in 2026, representing 70.4% of the global population.
Mobile broadband accounts for approximately 89% of all global mobile subscriptions in 2026.
Global 5G subscriptions are projected to reach about 6.4 billion by 2031, accounting for roughly two-thirds of all mobile subscriptions.
Smartphones generated 56.4% of U.S. online holiday spending during the 2025 holiday shopping season.
The average smartphone user in India consumed approximately 24 GB of mobile data per month in 2025.
Conclusion
Smartphones continue to play a central role in everyday life, from communication and entertainment to shopping, banking, and work. The statistics show that smartphone ownership has reached maturity in many developed markets, while emerging economies continue to drive new user growth. At the same time, mobile commerce, AI-powered apps, and 5G adoption are reshaping how consumers interact with digital services. As smartphone usage expands, privacy, security, and responsible digital habits will remain essential priorities for users, businesses, and technology providers alike.