



Social media marketing continues to shape how brands attract customers, build communities, and generate revenue. From ecommerce stores driving product discovery through short-form video to B2B companies generating qualified leads on professional networks, social platforms now influence nearly every stage of the customer journey. As AI-powered advertising, creator partnerships, and social commerce expand, marketers rely on accurate statistics to guide investment decisions. Explore the latest data below to understand how social media marketing is evolving.
Editor’s Choice
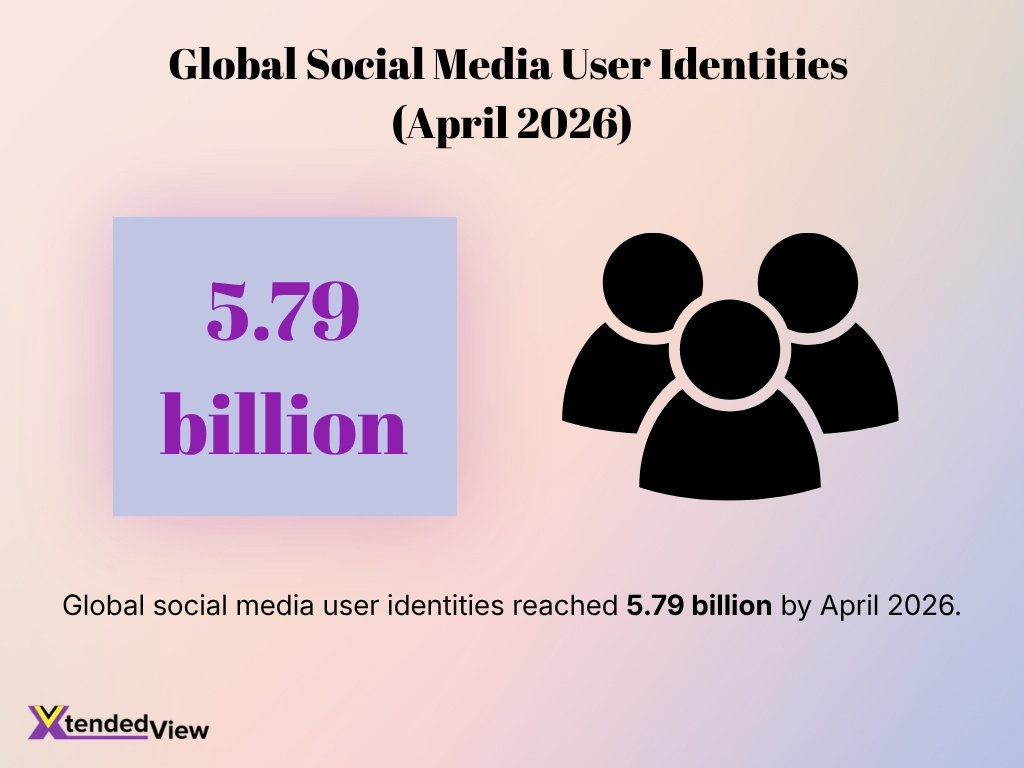
- Global social media user identities reached 5.79 billion in April 2026, representing about 69.9% of the world’s population.
- Worldwide social media advertising spending is estimated to reach $276 billion in 2025, with continued growth projected throughout 2026.
- Internet users worldwide spent an average of 141 minutes per day on social media during 2025.
- Facebook remained the most-used platform among marketers entering 2026, with 86% reporting that they actively use it for marketing.
- Around 83% of marketers reported increased brand exposure as one of the biggest benefits of social media marketing.
- Global social media users increased by approximately 294 million over the previous year, adding more than 800,000 new users every day.
- The United States had approximately 313 million social networking users during 2025, keeping it among the world’s largest social media markets.
Recent Developments
- AI-assisted content creation and campaign optimization ranked among the fastest-growing priorities for marketers entering 2026.
- Marketers identified generative AI, connected TV, and short-form social video as the leading consumer marketing trends in 2025 surveys.
- Facebook and Instagram delivered the highest reported ROI among major social platforms in late 2025.
- Meta generated more than $196 billion in advertising revenue during 2025, highlighting continued advertiser demand.
- Social media advertising impressions continued to increase throughout 2025 as advertisers expanded budgets across multiple platforms.
- Video-first platforms continued attracting larger marketing investments, particularly for short-form content and creator partnerships.
- Platform diversification accelerated as brands expanded spending beyond Meta to include TikTok, LinkedIn, Pinterest, and YouTube.
- Digital reports released in 2026 place stronger emphasis on AI usage, social commerce, and cross-platform measurement than previous annual reports.
Global Social Media Usage Statistics
- Global social media user identities reached 5.79 billion by April 2026.
- Social media penetration worldwide stood at approximately 63.9% during 2025.
- China remained the world’s largest social media market with more than one billion users.
- India had over 870 million social media users, making it the second-largest market globally.
- Europe accounted for approximately 731 million social media users in 2025.
- Global social media audiences grew by 5.4% year over year between 2025 and 2026.
- More than 9 new social media user identities were added every second during the past year.
- Social media audiences now exceed the number of people watching traditional broadcast and cable television each month.
Social Media User Behavior and Time Spent
- Internet users worldwide spent an average of 141 minutes daily on social media in 2025.
- Approximately 51% of global internet users primarily use social platforms to stay connected with friends and family.
- Exactly 47% of internet users actively browse social media to fill their leisure and spare time.
- Around 34% of consumers now utilize social networks for product research before making purchase decisions.
- Young adults aged 18 to 24dominate content consumption, spending a massive 186 minutes daily across platforms.
- The average user now actively engages with 6.84 different platforms monthly instead of relying on a single network.
- AI-powered recommendations heavily influence engagement, prompting users to visit recommended brands 2 to 4 times more often.
- Expanding beyond simple communication, global social ad spending successfully reached $277 billion in 2025.
Social Media Platform Demographics
- The United States recorded approximately 313 million social media users during 2025.
- Facebook maintained around 3.07 billion monthly active users entering late 2025.
- Instagram reached roughly 3 billion monthly active users, reinforcing its position globally.
- YouTube attracted more than 2.5 billion monthly active users worldwide.
- India had an estimated 481 million Instagram advertising audience in late 2025.
- Facebook’s advertising reach in India reached approximately 403 million users by late 2025.
- Global social media adoption reached 5.79 billion active users, representing 69.9% of the population by early 2026.
- The average social media user actively engages with 6.8 different platforms every month.
Worldwide Total Media Ad Spending Statistics
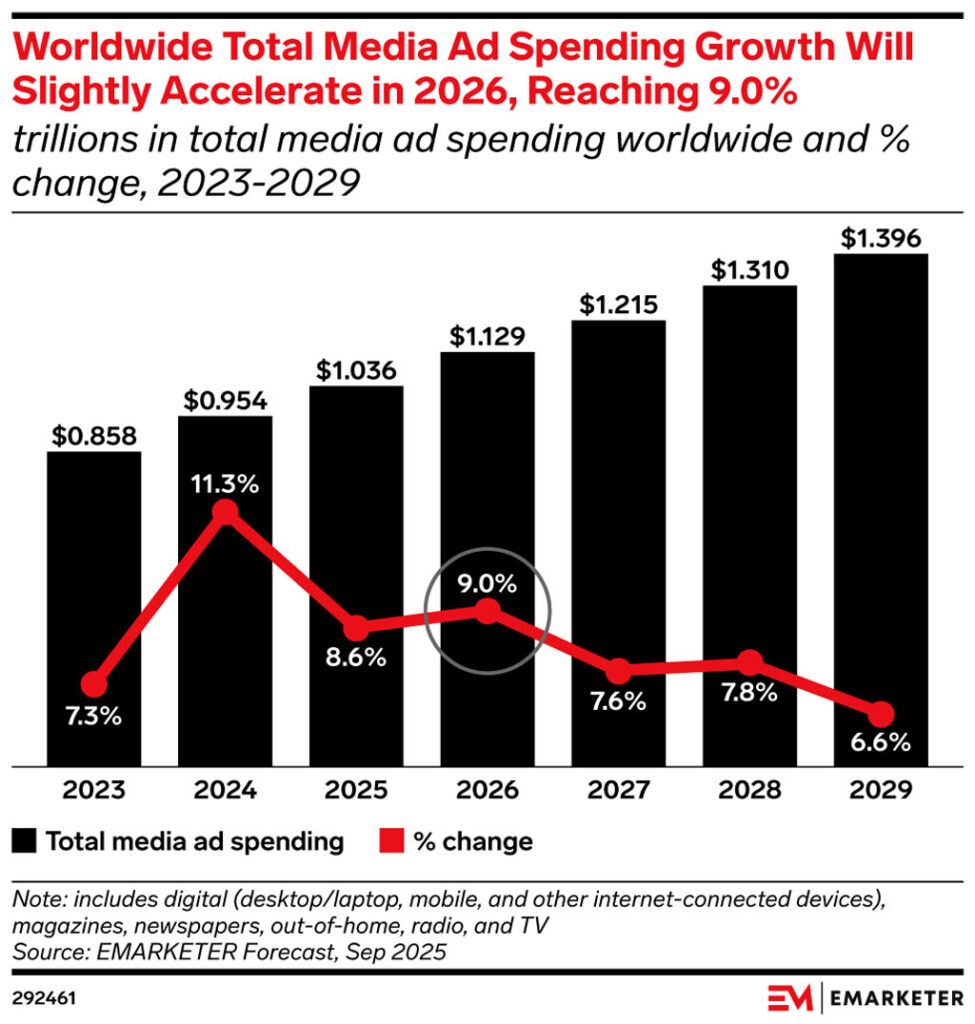
- Worldwide total media ad spending is projected to rise from $0.858 trillion in 2023 to $1.396 trillion by 2029, showing substantial expansion across the global advertising market.
- Global media ad spending increased to $0.954 trillion in 2024, representing the period’s strongest annual growth rate of 11.3%.
- In 2025, worldwide spending is estimated to cross the $1 trillion threshold for the first time, reaching approximately $1.036 trillion.
- Total media ad spending is forecast to climb to $1.129 trillion in 2026, while annual growth slightly accelerates to 9.0%, up from 8.6% in 2025.
- By 2027, global media advertising expenditure is expected to reach $1.215 trillion, although its annual growth rate is projected to moderate to 7.6%.
- Worldwide media ad spending could increase further to $1.310 trillion in 2028, accompanied by a modest rebound in annual growth to 7.8%.
- By 2029, total spending is forecast to reach a record $1.396 trillion, despite annual growth slowing to 6.6%, the lowest rate shown in the forecast.
- Overall, global media ad spending is projected to increase by about $538 billion between 2023 and 2029, equivalent to roughly 62.7% growth over the six-year period.
- The figures indicate that the worldwide advertising market will continue expanding through 2029, even as year-over-year growth gradually settles into the 6% to 8% range toward the end of the forecast.
Platform-Specific Marketing Statistics
- Facebook remains the top choice globally, with 83% of marketers using the platform and its monthly active users surpassing 3.07 billion.
- Instagram is the most-cited platform for marketing ROI, boasting 3 billion monthly active users and driving product discovery for 61% of users.
- LinkedIn consistently ranks as the strongest channel for B2B marketers, with nearly 70% of its 1.3 billion users engaging with brand content weekly.
- YouTube has grown to 2.5 billion monthly active users, while YouTube Shorts generate over 70 billion daily views globally for video marketers.
- TikTok achieves a massive 4.07% average engagement rate, successfully converting 43.8% of its 1.9 billion global users into buyers.
- Pinterest continues to thrive as a product discovery hub, delivering a highly effective 2.3% conversion rate for targeted shopping ads.
- X maintains a strong web presence with 150 million daily active users, heavily catering to real-time news and maintaining an audience of nearly 450 million globally.
- Threads expanded rapidly, reaching 400 million monthly active users and encouraging brands to test new text-first engagement strategies.
Content Format Performance Statistics
- Short-form video delivers the highest ROI, with 56% of marketers ranking it as top-performing.
- Approximately 67% of marketers plan to increase their investment in video content this year.
- Brands publishing educational content see a 131% increase in immediate consumer purchasing intent.
- Instagram carousel posts generate a 1.92% engagement rate, significantly outperforming single-image content.
- Live streaming successfully holds audience attention 10 to 20 times longer than pre-recorded video.
- Infographics are shared 3 times more often on social platforms than any other B2B content type.
- Campaigns featuring user-generated content experience a significant 29% boost in conversion rates.
- Interactive content like platform polls and quizzes yields 2 times more engagement than static posts.
- Marketing teams utilizing AI-assisted production tools report a 40% reduction in campaign creation time.
Social Media Engagement Rate Benchmarks
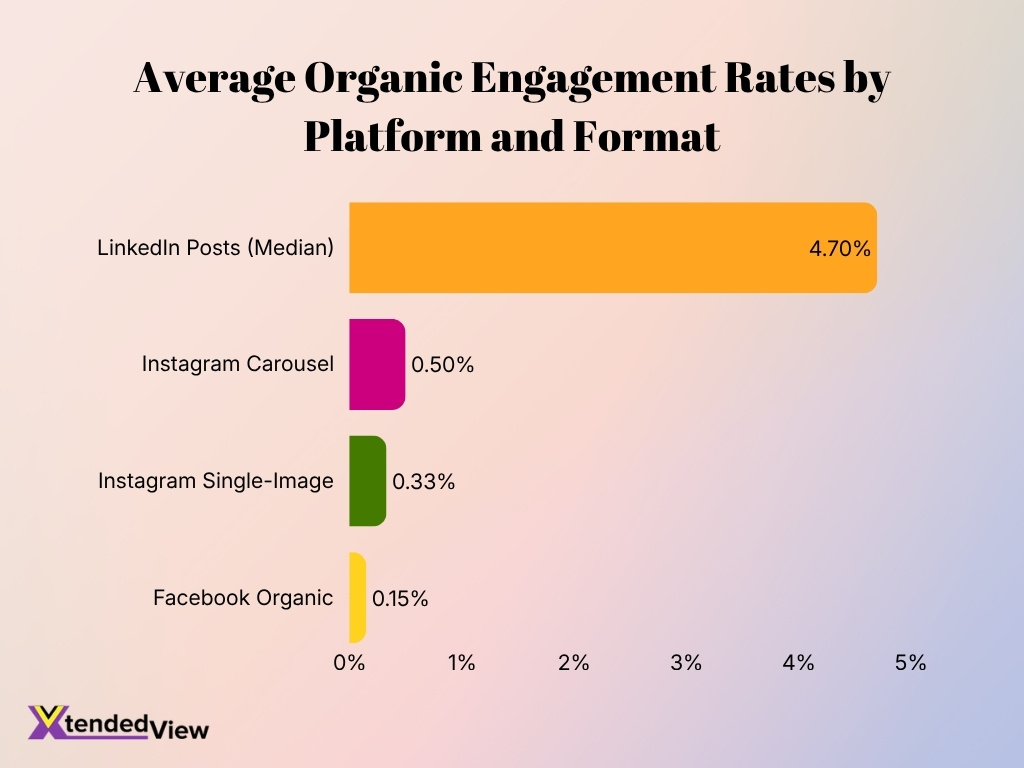
- Instagram carousel posts achieve the highest average engagement rate at 0.50%, significantly outperforming single-image posts that average just 0.33%.
- Short-form videos dominate overall metrics, with YouTube Shorts reaching up to 5.91% and TikTok averaging between 2.50% and 4.64% engagement.
- Facebook organic engagement rates have declined, averaging a mere 0.15% for business pages as overall content volume saturates the platform.
- LinkedIn posts boast a strong 4.7% median engagement rate, particularly when utilizing educational document carousels that encourage active swiping.
- Brands posting consistently 3 to 5 times per week across platforms generally achieve up to 5 times more engagement than those publishing sporadically.
- Content leveraging polls, questions, and user participation generates interaction rates of 12% to 18%, vastly outperforming traditional promotional broadcasts.
- Authentic user-generated content organically boosts reach and continuously outperforms highly polished, branded-only content across multiple industries.
- Video posts typically capture up to 14 minutes of watch time per viewer and generate significantly more comments than standard static image posts.
- Performance varies heavily by industry, with sports and education sectors exceeding 7% engagement, while financial and retail brands average 2% to 3.9%.
Social Media Marketing ROI and Business Impact
- 83% of companies report that improved brand visibility is the primary advantage of their social media marketing efforts.
- Nearly 96% of marketers report positive financial returns from their active social media marketing campaigns.
- Facebook and Instagram deliver the highest social media ROI for 54% and 43% of marketers, respectively.
- E-commerce brands utilizing strong revenue attribution models see 6 to 10 times higher returns on their social media investments.
- Social media marketing drives full-funnel value, including 67% brand awareness and 60% customer acquisition.
- Paid social campaigns maintain a standard 5:1 return on investment, with well-optimized accounts exceeding an 8:1 ratio.
- Around 60% of marketers report at least 2x returns on AI investments used for campaign optimization.
- Approximately 71% of consumers state that their purchasing choices are heavily swayed by social media content.
- Influencer marketing initiatives deliver an average ROI of $5.78 per $1 spent, significantly outperforming traditional digital ads.
- Global social commerce revenue driven by social media platforms is projected to cross $1 trillion by 2028.
Social Commerce and Shopping Statistics
- The global social commerce market is projected to reach $1.92 trillion by 2026, growing at a 37.4% annual rate.
- Nearly 80% of shoppers now use social media for product discovery, completely transforming the traditional digital buying journey.
- Roughly 55% of Gen Z consumers execute purchases directly within social apps, surpassing the 41% average for all age groups.
- Over 57% of consumers have purchased items during livestream shopping events, with a strong focus on beauty and fashion.
- The US TikTok Shop market expanded to $15.1 billion in 2025, marking a remarkable 68% year-over-year growth in sales.
- Global TikTok Shop sales are forecast to reach $112.2 billion in 2026, powered by more than 15 million active sellers.
- Approximately 85% of Gen Z buyers confirm that social media and creator recommendations directly dictate their purchasing decisions.
- A massive 82% of consumers discover and buy products directly on their mobile phones through integrated social shopping tools.
- Authentic creator content and product reviews currently account for 42% of all US TikTok Shop sales, underscoring the influence of user-generated content.
Optimal Social Media Posting Frequency for Brands
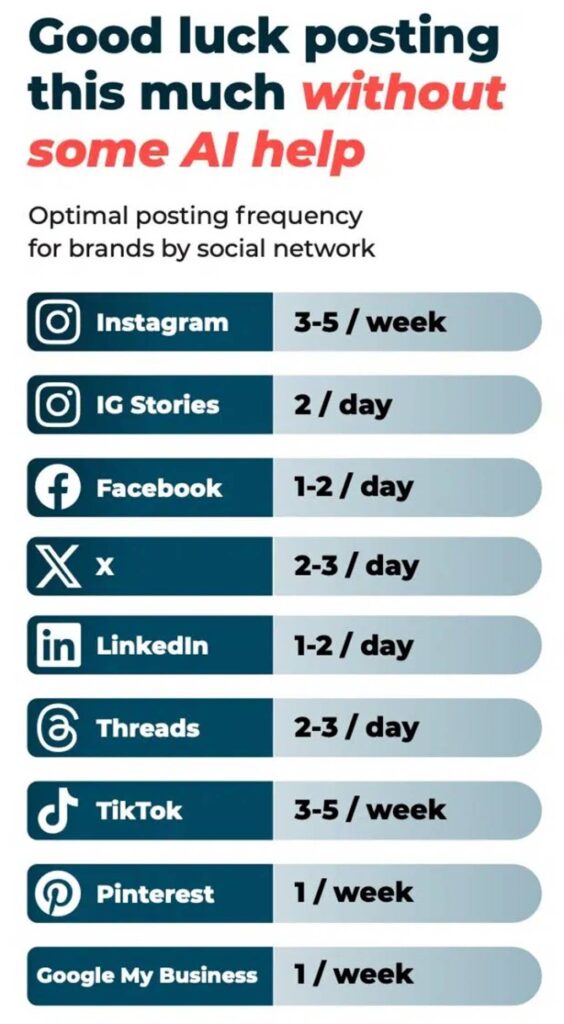
- Instagram performs best with a posting frequency of around 3–5 posts per week, giving brands regular visibility without requiring daily feed updates.
- Instagram Stories demand a much higher cadence, with brands recommended to publish around 2 Stories per day to maintain consistent audience engagement.
- Facebook brands should aim for 1–2 posts per day, making it one of the platforms where daily publishing remains important.
- X has a recommended frequency of 2–3 posts per day, reflecting the platform’s fast-moving, real-time content environment.
- LinkedIn brands can target 1–2 posts per day, allowing businesses to maintain professional visibility throughout the working week.
- Threads also favors frequent activity at around 2–3 posts per day, matching the conversational and rapidly updating nature of the platform.
- TikTok requires fewer scheduled posts, with an optimal frequency of about 3–5 posts per week for brands.
- Pinterest has a comparatively light recommended schedule of just 1 post per week, according to the data.
- Google My Business also requires only around 1 post per week, the lowest posting frequency alongside Pinterest.
- Overall, the data shows that posting frequency varies substantially by platform, ranging from 1 post per week to 3 posts per day, highlighting the need for platform-specific social media strategies.
Influencer Marketing Statistics
- Global influencer marketing spending reached a projected $32.5 billion in 2025.
- Nano and micro-influencers represent 76% of creators, driven by their stronger engagement and audience trust.
- Instagram remains the leading platform for campaigns, utilized by 68% of marketing specialists worldwide.
- TikTok captures 35% of global influencer spend in 2026 while recording median engagement rates of 3.7%.
- Over 71% of creators now offer pricing discounts to secure long-term partnerships instead of one-time posts.
- Short-form video campaigns consistently outperform static content and are the preferred format for 53% of creators.
- Around 73% of brand teams actively use AI tools for influencer discovery, campaign management, and performance tracking.
- Performance-based compensation is replacing flat fees, with 53% of marketers adopting this scalable payout model.
- Brands generate an average ROI of $5.78 for every $1 spent, heavily prioritizing revenue and conversions over follower counts.
Organic vs Paid Social Media Performance
- Average organic reach on major platforms has plummeted to just 1.5% to 2.2% of total followers.
- Global paid social advertising spending is projected to surpass $250 billion by the end of this year.
- Combining organic content with targeted paid boosts generates a 35% increase in overall campaign ROI.
- Video advertisements consistently drive up to 1200% more shares than static images and text combined.
- Social media retargeting campaigns produce a 70% higher conversion rate compared to targeting cold audiences.
- Implementing AI-driven campaign optimization reduces the average cost per acquisition by roughly 25%.
- Ad campaigns utilizing first-party customer data achieve a 2.5x higher return on ad spend on average.
- Maintaining consistent organic community engagement improves long-term customer retention rates by up to 40%.
- Diversifying ad spend across three or more social platforms results in a 90% higher customer retention rate.
Social Media Marketing Trends and AI Usage
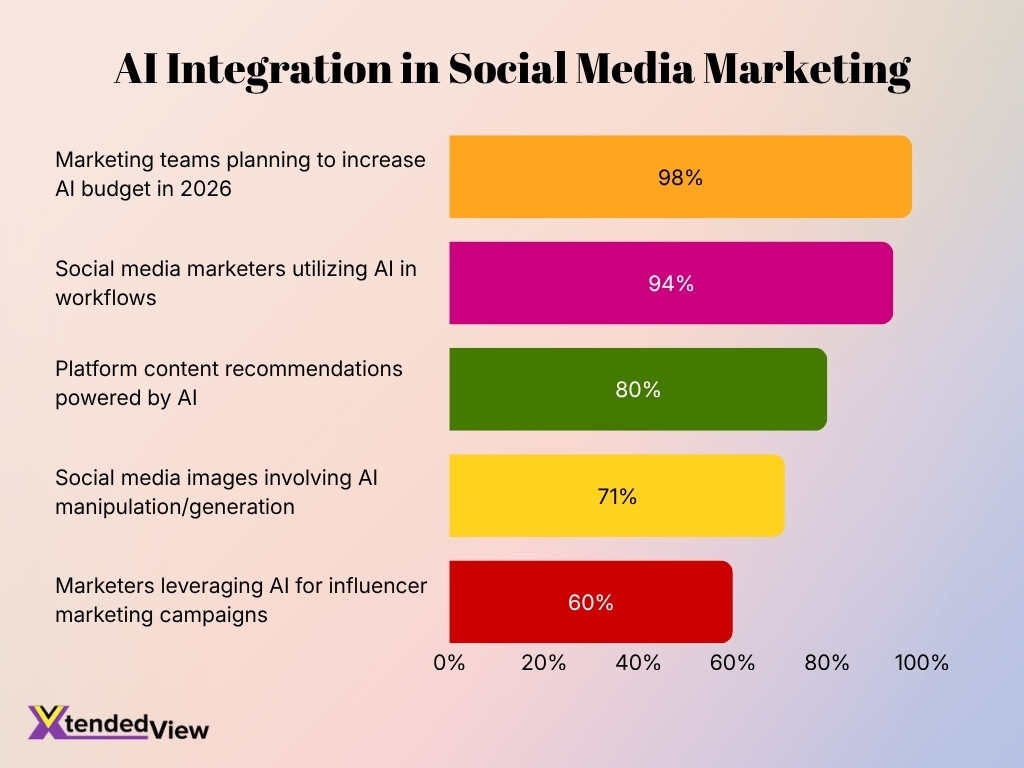
- Approximately 94% of social media marketers now utilize AI in their workflows, rising from 71% in 2025.
- Marketers using AI tools for content creation save an average of 6.1 hours per week.
- Around 71% of social media images now involve AI, ranging from basic edits to full text-to-image generation.
- Over 80% of social media content recommendations and platform feeds are currently powered by AI algorithms.
- A staggering 98% of marketing teams plan to increase their overall AI budget moving into 2026.
- Nearly 60% of marketers currently leverage AI for managing and optimizing their influencer marketing campaigns.
- Only 1% of content marketers rely entirely on automated AI, proving that human review remains the industry standard.
- Private investment in generative AI for enterprise and marketing applications surged by more than 200% throughout 2025.
Social Search and Discovery Statistics
- About 24% of internet users now state they primarily use social media as their main search engine.
- A significant 46% of Gen Z consumers prefer social platforms over traditional search engines for product discovery.
- Approximately 40% of Gen Z use TikTok and Instagram for search instead of Google for lifestyle topics.
- Around 78% of global internet users report using social media platforms for brand and product research.
- On average, 55% of consumers prefer searching for products directly on social platforms rather than traditional search engines.
- Over 49% of Gen Z users turn specifically to TikTok for new product discovery.
- Approximately 66.6% of U.S. consumers utilized social search behaviors to find answers or products in 2025.
- About 52% of social media users favor social search over AI chatbots to find authentic user experiences.
- Roughly 40.6% of marketers are actively updating their social media SEO strategy to adapt to shifting behaviors.
- The global social commerce market reached $1.48 trillion in 2025, driven by integrated product discovery.
Mobile vs Desktop Social Media Usage
- More than 98% of social media users accessed platforms through mobile devices during 2025.
- Mobile applications accounted for approximately 80% of total social media usage time worldwide.
- Nearly 60% of desktop usage remained dedicated to professional networking and advertising management.
- Mobile-first video consumption drove a 151% increase in higher engagement across major platforms.
- Vertical video formats outperformed traditional horizontal formats by over 90% on mobile-first platforms.
- Mobile commerce accounted for 72.9% of purchases completed directly from social applications.
- Global mobile internet connections averaged 131 Mbps, supporting higher-quality video content viewing.
- Over 75% of brands designed campaigns using a mobile-first creative strategy rather than adapting desktop content.
- Targeted mobile notifications boosted repeat engagement and user retention by up to 50% across platforms.
B2B vs B2C Social Media Marketing Statistics
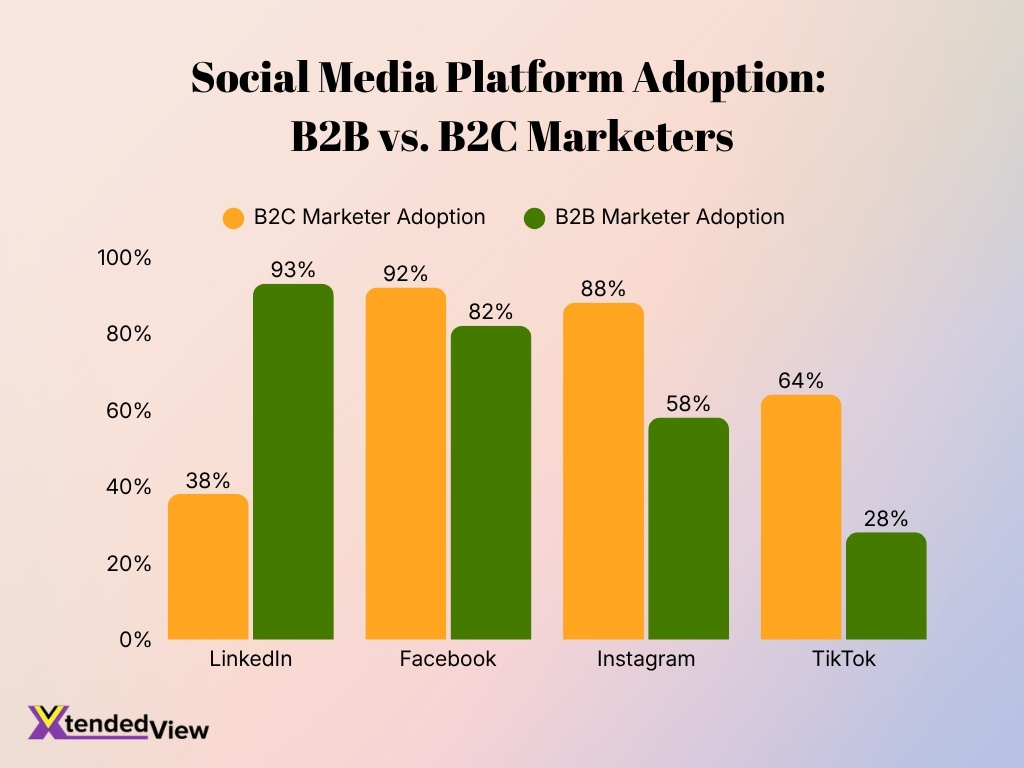
- LinkedIn is utilized by 93% of B2B marketers compared to only 38% of B2C marketers.
- Facebook maintains strong adoption across both sectors with 92% in B2C and 82% in B2B.
- Instagram is significantly preferred by B2C marketers at 88% versus 58% for B2B marketers.
- TikTok sees a massive adoption gap with 64% of B2C marketers using it compared to just 28% of B2B.
- B2C paid social campaigns achieve an average conversion rate of 2.1% while B2B campaigns average 0.9%.
- Organic social media yields a 2.4% conversion rate for B2C compared to 1.7% for B2B marketing.
- Short-form video generates the highest ROI at 41% among all video formats for B2B marketers.
- The average B2B marketing ROI sits at 5:1 while B2C ecommerce email ROI reaches $38 to $42.
- AI-powered targeting on LinkedIn improved B2B paid social conversion rates from 0.9% to 1.4%.
Social Media Marketing Trends and Future Outlook
- Global social media user identities are expected to continue growing beyond 6 billion over the next few years.
- AI-powered campaign management is expected to become a standard capability across advertising platforms.
- Social commerce will continue expanding as more platforms integrate checkout and payment functionality.
- First-party data strategies will become increasingly important as privacy regulations continue evolving.
- Short-form video is expected to remain the highest-performing social content format for marketers.
- Creator partnerships will increasingly shift toward long-term brand ambassador relationships rather than one-time sponsorships.
- AI-generated creative testing will allow marketers to launch and optimize campaigns more quickly than traditional production methods.
- Community building and customer engagement will become stronger competitive advantages as advertising costs continue rising.
- Brands investing in omnichannel social media strategies are expected to achieve stronger long-term customer retention and revenue growth.
Frequently Asked Questions (FAQs)
There were 5.79 billion social media user identities worldwide as of April 2026, representing more than two-thirds of the global population.
Global social media advertising spending is projected to reach approximately $276 billion in 2025 and continue growing through 2030.
According to a 2025 global marketer survey, Facebook and Instagram delivered the highest reported ROI among major social media platforms.
The average internet user spends approximately 141 minutes (2 hours and 21 minutes) per day on social media.
More than 80% of marketers, specifically over four in five (about 83%), say increased brand exposure is one of the biggest benefits of social media marketing.
Conclusion
Social media marketing continues to evolve as consumer behavior, artificial intelligence, and platform innovations reshape the digital marketing landscape. The latest statistics demonstrate that businesses are investing more heavily in data-driven strategies, short-form video, influencer collaborations, social commerce, and AI-powered campaign optimization to improve engagement and maximize return on investment. At the same time, marketers are placing greater emphasis on meaningful business outcomes such as qualified leads, customer retention, revenue growth, and long-term brand loyalty rather than focusing solely on follower counts or impressions.
Looking ahead, organizations that embrace emerging technologies, adapt to changing platform algorithms, and create authentic, audience-focused content will be better positioned for sustainable success. By combining organic community building, paid advertising, creator partnerships, and advanced analytics, businesses can strengthen their competitive advantage and respond more effectively to evolving customer expectations. These statistics provide a valuable benchmark for marketers, executives, and decision-makers planning their social media strategies.
