


Instagram Stories remain one of the platform’s most influential content formats, helping brands, creators, publishers, and retailers connect with short-lived, interactive content. Businesses use Stories to launch products, while creators rely on polls, link stickers, and behind-the-scenes updates to build stronger communities and drive conversions. As Meta continues to refine discovery, advertising, and AI-powered creative tools, Stories remain central to social media marketing strategies. Explore the latest statistics below to understand how Instagram Stories continue to shape audience behavior and business performance.
Editor’s Choice
- More than 500 million accounts use Instagram Stories every day, making Stories one of the most widely used content formats across Meta’s ecosystem.
- Instagram reached approximately 2.4 billion monthly active users worldwide by early 2026, providing an enormous audience for Stories content.
- Instagram’s global advertising audience exceeded 1.74 billion users during 2025, offering marketers unprecedented Stories advertising opportunities.
- Stories accounted for approximately 44% of Instagram ad impressions during Q2 2025, highlighting their growing role in paid social campaigns.
- Research analyzing 161,180 Instagram Stories found that posting 6 to 13 Stories in a sequence generally produced the strongest reach performance in 2025.
- Average first-slide exit rates measured around 23.8% during 2025, reinforcing the importance of capturing attention immediately.
- Video Stories consistently generated higher reach rates than image Stories across every follower-size category analyzed.
Recent Developments
- During 2025 and 2026, Meta continued expanding AI-powered creative tools that automatically recommend backgrounds, text variations, image editing, and ad creatives for Instagram campaigns.
- Instagram increasingly prioritizes shares, sends, retention, and meaningful interactions over simple likes when distributing content across the platform.
- Meta expanded generative AI features that help advertisers create multiple Story ad variations more efficiently for different audience segments.
- Instagram continued refining analytics available to professional accounts, giving marketers deeper visibility into Story performance and engagement trends.
- Social media analysts observed that retention metrics became increasingly important for Story visibility during 2025 compared with previous years.
- Video Stories maintained stronger organic distribution than static image Stories across nearly every account-size category studied.
- Marketers increasingly combine Stories with Reels and Feed posts in integrated campaigns instead of treating Stories as a standalone content format.
- AI-assisted creative optimization has reduced production time for Story advertisements while allowing advertisers to test multiple creative combinations at scale.
Instagram Stories Global Usage and Daily Active User Statistics
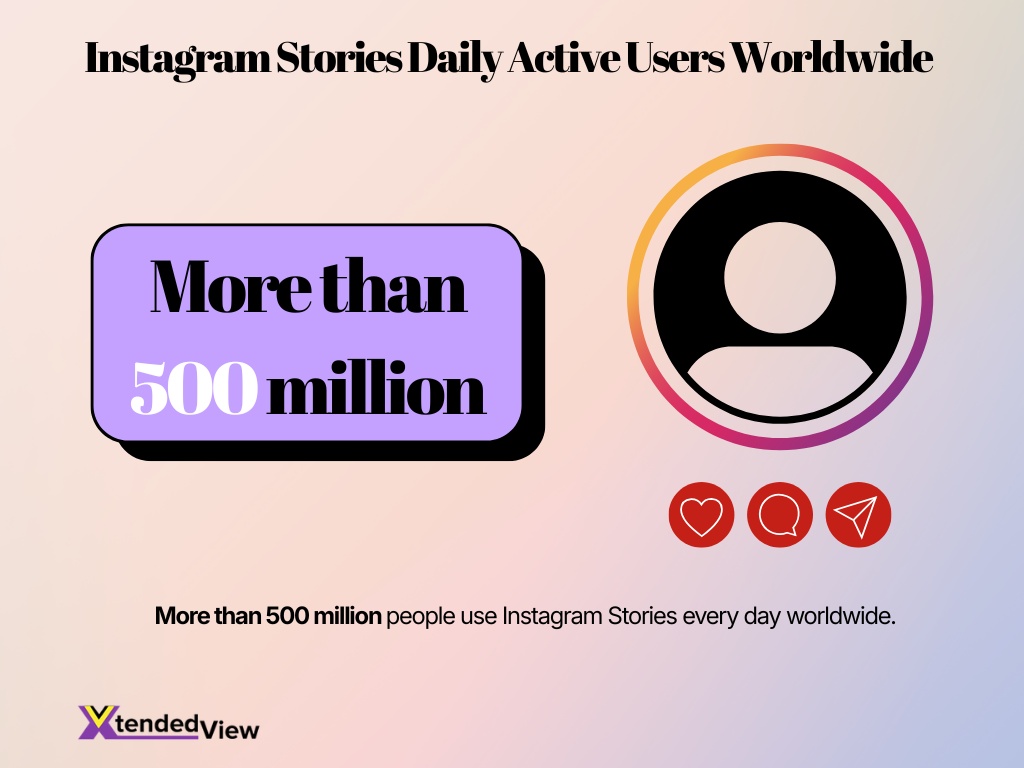
- More than 500 million people use Instagram Stories every day worldwide.
- Instagram reached roughly 2.4 billion monthly active users globally by 2026.
- Instagram’s advertising audience surpassed 1.74 billion users during 2025, reflecting continued platform growth.
- India remained Instagram’s largest advertising market with approximately 481 million reachable users by late 2025.
- India added nearly 89.5 million Instagram ad-reach users between late 2024 and late 2025, representing 22.9% annual growth.
- At the beginning of 2025, Instagram’s advertising audience in India stood at approximately 414 million users, illustrating the platform’s rapid year-over-year expansion.
- Instagram remains among the world’s most-used social media platforms, making Stories one of the largest daily short-form content ecosystems available to marketers.
- Businesses across retail, travel, entertainment, education, and ecommerce continue using Stories for product launches, customer engagement, and limited-time promotions because of their daily audience scale.
Instagram Stories Engagement Statistics
- Over 500 million accounts engage with Instagram Stories daily.
- The average reach rate for Stories is 4.8% of a creator’s follower base.
- Interactive stickers like polls and quizzes boost engagement by 15-25%.
- Story completion rates hit 75% for 1-3 frames but drop to 50% at 7+ frames.
- The cross-industry average engagement rate for Stories is around 0.48%.
- The average link sticker tap-through rate ranges between 0.3% and 1.0%.
- Accounts with over 100K followers publish 6x more Stories monthly than smaller profiles.
- Brands actively post an average of 13 to 15 Stories per month.
- Profiles under 10,000 followers often see Story engagement rates double the average.
Instagram Stories View Completion and Completion Rate Statistics
- Industry benchmarks indicate that a 70% Story completion rate represents strong performance for most accounts during 2026.
- Smaller Instagram accounts frequently achieve Story completion rates above 90%, largely because of more loyal audiences.
- Many business accounts record Story completion rates close to 88.2% under strong-performing campaigns.
- Approximately 23.8% of viewers exit on the first Story slide, making the opening frame the most critical for retention.
- Impressions improved consistently from Story 1 through Story 6 in the 2025 benchmark analysis.
- Impression rates flattened around Stories 7 and 8, suggesting that audience attention begins stabilizing after several consecutive posts.
- Story sequences reached their highest recorded impression level of approximately 40% around Story 13 during the benchmark study.
- High-performing Stories typically maintain viewer attention by combining interactive elements, concise messaging, and visually engaging first frames.
Sound-On Viewing Across Social Platforms
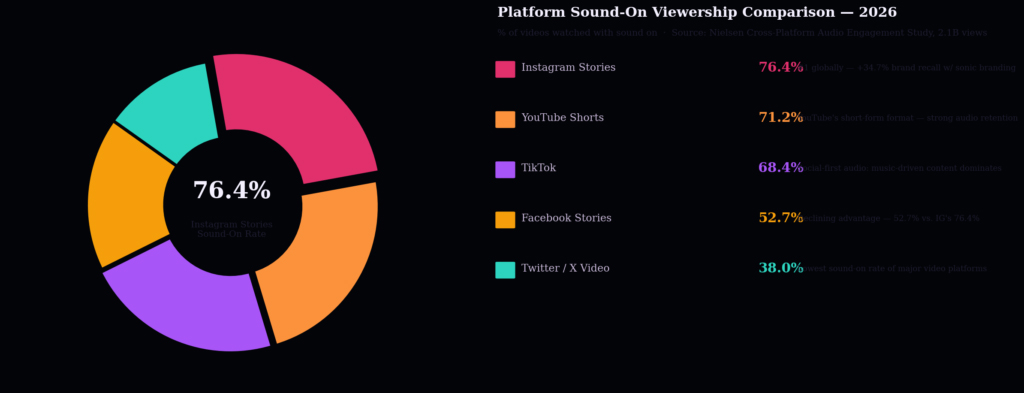
- Instagram Stories leads all platforms, with 76.4% of viewers watching content with sound enabled.
- YouTube Shorts ranks second at 71.2%, only 5.2 percentage points behind Instagram Stories.
- TikTok records a strong 68.4% sound-on rate, showing that audio remains central to short-form video engagement.
- Facebook Stories reaches 52.7%, trailing Instagram Stories by 23.7 percentage points.
- Twitter/X Video has the lowest rate at 38.0%, nearly half the sound-on audience share of Instagram Stories.
- The top three platforms, Instagram Stories, YouTube Shorts, and TikTok, all exceed a 68% sound-on viewing rate.
- The gap between the highest and lowest platforms is 38.4 percentage points, highlighting major differences in user viewing behavior.
Interactive Sticker Performance Statistics
- Over 500 million accounts actively use Instagram Stories every single day.
- Approximately 70% of Instagram users watch Stories on a daily basis.
- Interactive sticker interaction rates average between 12% and 18% of total viewers.
- Stories feature an impressive average completion rate of 70% per post.
- Automating direct messages from sticker replies generates high open rates of 40% to 60%.
- Automated responses linked to interactive stickers produce 15% to 25% click-through rates.
- The platform-wide average Instagram engagement rate sits at 0.48%.
- Accounts under 10,000 followers often see engagement rates double the platform average.
- Using interactive stickers strategically can push engagement consistently above 0.6%.
- Instagram Stories typically reach between 2% and 9% of total followers.
Link Sticker Click-Through Statistics
- The industry average click-through rate for Instagram Story link stickers is between 1% and 3%.
- Highly engaged niche audiences can achieve a significantly higher tap-through rate of 5% to 10%.
- Approximately 99% of all link sticker clicks originate directly from mobile devices.
- Interactive stickers like polls and quizzes receive 5 to 10 times more engagement than standard link stickers.
- A high-friction call to action involving purchases typically yields a lower click rate of around 0.5%.
- Instagram accounts with over 10,000 followers see an average Story reach of just 2% of their total audience.
- Automated Story replies sent via direct messages achieve a massive 90% open rate compared to passive stickers.
- Smaller accounts often experience a much higher Story reach of up to 20% for engaged audiences.
- Utilizing clear visual cues like arrows pointing to the link can boost overall sticker interactions by 15%.
Instagram Stories Reach and Reach Rate Statistics
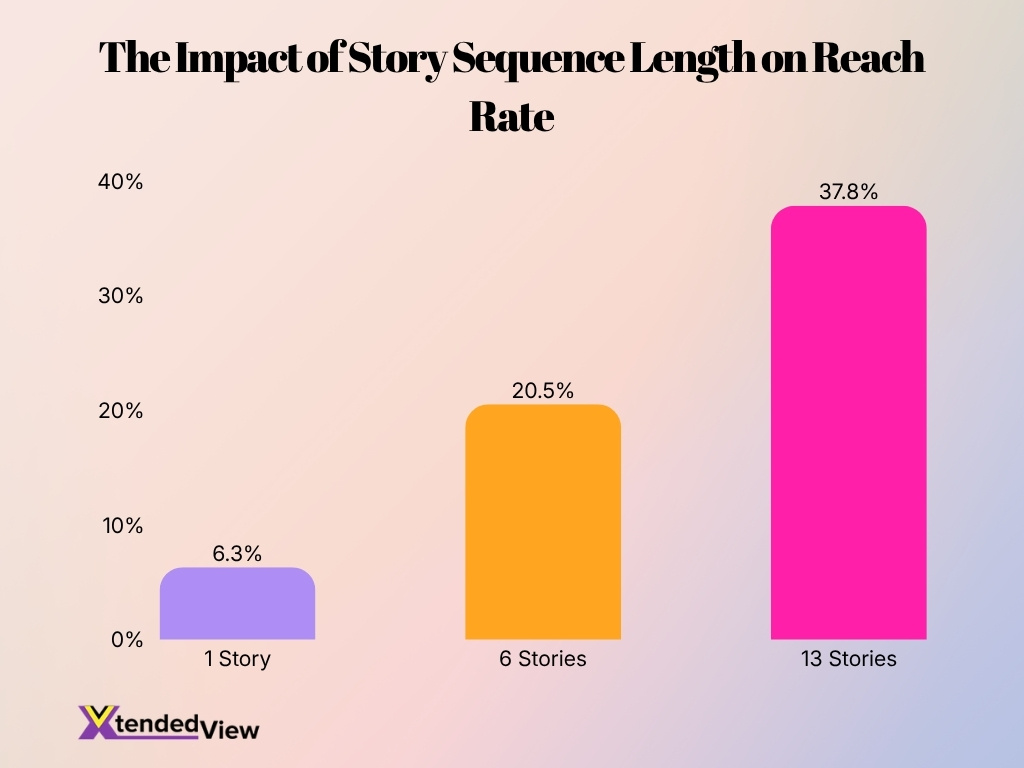
- Benchmark analysis found that posting 6 Stories increased average reach rate to approximately 20.5%, compared with much lower reach from single-slide Stories.
- Reach continued climbing through longer Story sequences, peaking at approximately 37.8% around the 13th Story before declining.
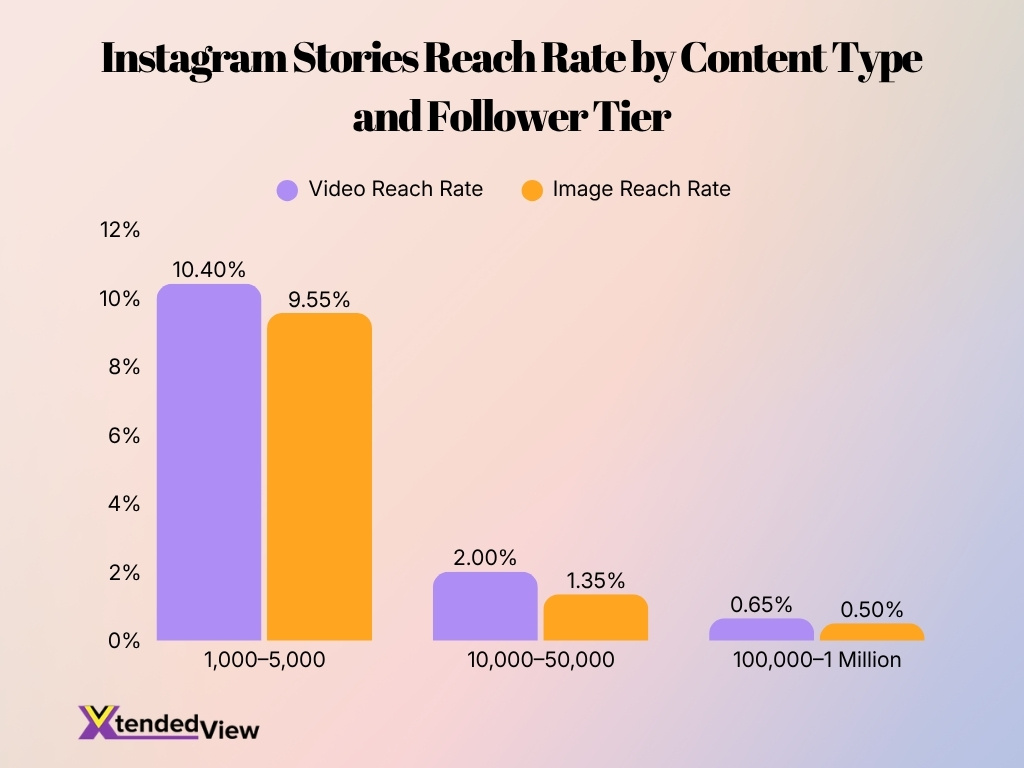
- Accounts with 1,000-5,000 followers achieved average image Story reach rates of 9.55% and video Story reach rates of 10.40%.
- Accounts with 10,000-50,000 followers averaged 2.00% reach for video Stories versus 1.35% for image Stories.
- Accounts with 100,000 to 1 million followers averaged roughly 0.65% reach for video Stories compared with 0.50% for image Stories.
- The benchmark study showed that video consistently outperformed static images regardless of audience size.
- Researchers also observed that Story reach drops noticeably once daily Story sequences exceed approximately 13 slides, suggesting audience fatigue.
- While Stories remain highly effective for audience engagement, Feed posts generally produced higher organic reach than Stories during 2025 across several follower tiers.
Instagram Stories Advertising Statistics
- 500 million daily active users view Instagram Stories worldwide.
- Over 4 million businesses run Story ads every single month.
- Story ads shot on mobile devices outperform studio-shot ads 63% of the time.
- One-third of the most-viewed Stories come directly from business accounts.
- Approximately 58% of users become more interested in a brand after seeing its Story ad.
- 50% of viewers have visited a website to make a purchase after seeing a product in Stories.
- Interactive poll stickers within Story ads increase overall interaction by 30%.
- Around 25% of users immediately visit a website after viewing a Story advertisement.
- Brand Stories maintain an impressive 88.2% completion rate among engaged viewers.
- The average Story ad duration runs for 15 seconds to maximize viewer retention.
AI-Optimized Stories Advertising Statistics
- Advertisers currently earn $4.52 for every dollar spent on Meta’s AI-enabled campaigns.
- Approximately 78% of advertisers now utilize AI-powered automated campaigns for improved efficiency.
- Over 41% of marketers actively leverage generative AI creative tools to enhance visual relevance.
- Employing AI-powered continuous optimization reduces marginal CPA by 30-40% within just six weeks.
- Marketers utilizing AI-automated management experience an average 45% reduction in manual setup time.
- Consistently following automated AI campaign recommendations yields an average 5% drop in cost per result.
- Advanced AI bid and budget allocation successfully improves overall budget efficiency by 30–40%.
- Brands utilizing continuous AI creative testing report an average 38% increase in purchase conversions.
Instagram Stories Navigation Metrics Statistics
- Instagram analyzed 161,180 Stories across 2024 and 2025, providing one of the largest recent benchmarks for Story navigation behavior.
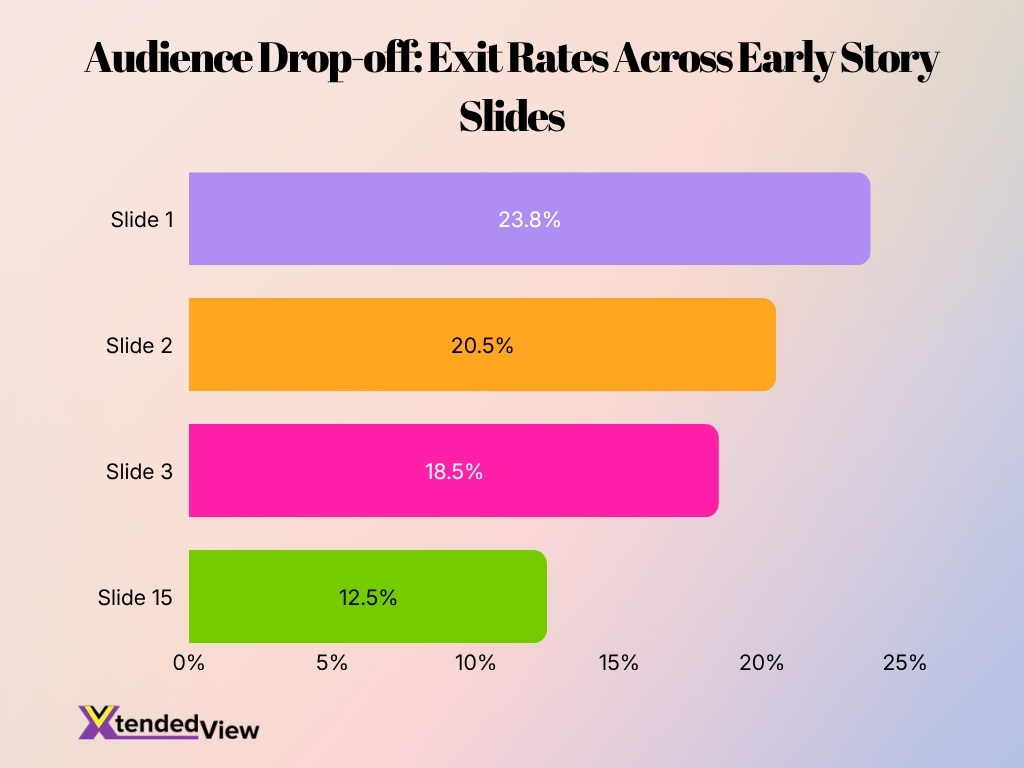
- The first Story slide records the highest viewer loss, with an average 23.8% exit rate, making the opening frame the most critical for retention.
- Exit rates improve to 20.5% on the second Story and 18.5% on the third as more engaged viewers continue watching.
- Between Stories 4 and 9, exit rates gradually decline from 15.7% to 13.3%, indicating the strongest audience retention window.
- By Story 15, average exit rates fall to roughly 12.5%, although viewer fatigue begins increasing after the 10th Story.
- Accounts with 1K-5K followers recorded image Story tap-forward rates of 56.82%, compared with 50.50% for video Stories, showing that videos encourage viewers to stay longer.
- Among accounts with 10K-50K followers, image Stories averaged a 63.7% tap-forward rate versus 56% for video Stories, reinforcing video’s stronger attention-holding ability.
- Instagram Story analytics track forward taps, back taps, exits, and next Story swipes, allowing marketers to identify where viewers lose interest or rewatch content.
Shoppable Stories and Product Tag Statistics
- Over 130 million active users tap on Instagram product tags every single month.
- Instagram shoppable stories ad formats currently generate $8.9 billion in revenue.
- Content with shopping features enabled receives 2.4 times more views than non-shoppable stories.
- Short-form video content featuring product tags converts 61% better than untagged content.
- Approximately 44% of platform users actively browse or make purchases every week.
- Implementing Instagram Shopping features increases average conversion rates by 15-30%.
- Video formats with product tags drive 37% more clicks to product pages than static posts.
- Around 75% of users base their purchase decisions directly on the platform’s shoppable content.
Influencer Marketing and Campaign ROI Statistics
- Businesses generate an average ROI of $5.78 for every $1 invested in influencer marketing campaigns.
- The global influencer marketing industry has expanded to an estimated $24 billion in total market size.
- Instagram is actively utilized by nearly 90% of marketers for executing primary influencer campaigns.
- Modern engagement prediction models can identify top-performing content with 94% F1-score accuracy.
- Micro-influencers consistently yield up to 60% higher engagement rates than their macro-influencer counterparts.
- Campaigns utilizing transparent disclosure tags experience zero statistical penalty in their engagement performance.
- Approximately 67% of brands intend to strategically increase their budgets for upcoming creator partnerships.
- Over 80% of consumers have completed purchases directly through an influencer’s affiliate link or custom code.
Brand vs. Creator Stories Statistics
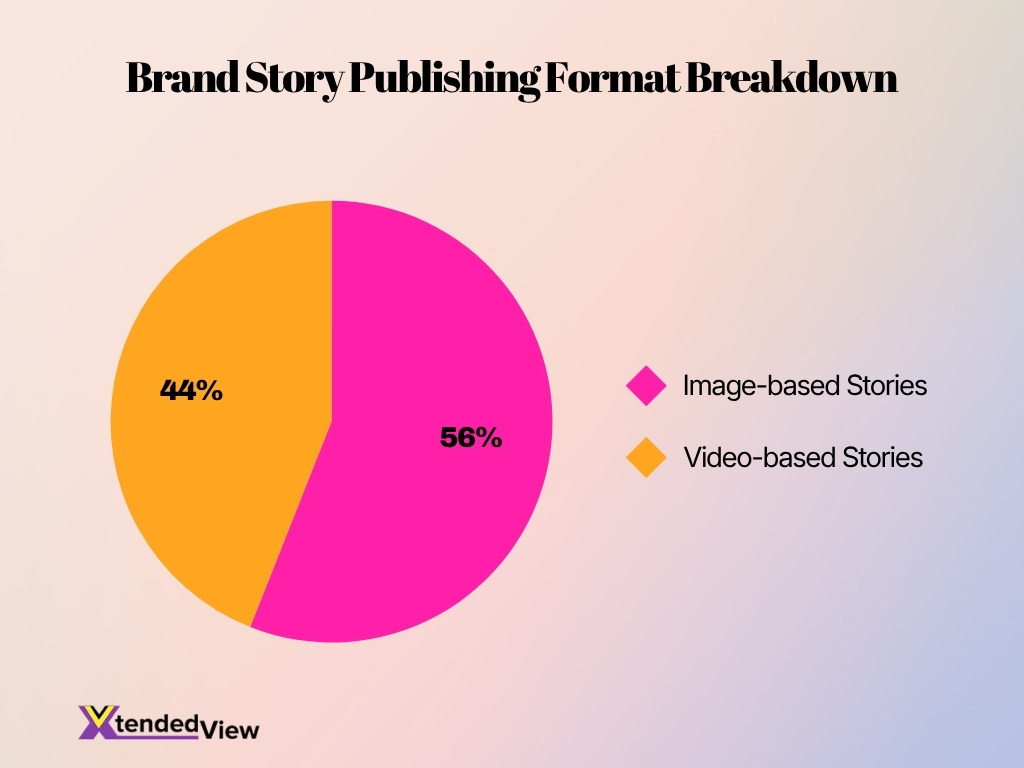
- Brands publish 56% image-based Stories compared to 44% video-based formats.
- Video Stories consistently generate higher reach across all follower sizes during 2025.
- The optimal reach growth for Stories occurs when posting between 6 and 13 consecutive slides.
- Accounts with 1k–5k followers publish an average of 12 Stories per month.
- Profiles with 100k–1M followers maintain higher volume with 80 Stories per month.
- Most Story exits happen after the first 3 slides, showing increased drop-offs in 2025.
- Collaborative posts between brands and creators deliver 3.4× higher engagement on average.
- Accounts under 10k followers see video slides consistently outperform images in retention.
Audience Demographics Statistics
- Instagram’s global audience continues to be dominated by users aged 18-34, making Stories particularly valuable for brands targeting younger consumers.
- In early 2025, Instagram reached approximately 414 million users in India through Meta’s advertising platform, making it the platform’s largest advertising market.
- Instagram’s advertising reach in India represented 28.4% of the country’s total population in early 2025.
- Among India’s eligible audience aged 13 and older, Instagram reached 35.8% of users at the beginning of 2025.
- Instagram’s advertising audience in India equaled 37.6% of adults aged 18 and above, highlighting strong penetration among working-age consumers.
- Approximately 70.8% of Instagram’s adult advertising audience in India was male, while 29.2% was female during early 2025.
- Instagram’s ad reach represented 51.4% of India’s internet users, demonstrating the platform’s significant role in digital marketing campaigns.
- Stories continue attracting high engagement among Gen Z and Millennials because of their mobile-first, short-form, and interactive design.
Regional Growth Statistics
- India remains the largest advertising audience worldwide, boasting over 480 million active users.
- The Asia-Pacific region leads global expansion by hosting a massive 953 million active users.
- North American ad value remains incredibly high, as Instagram generated an estimated $37.1 billion in US ad revenue alone.
- Europe provides a massive base for creator partnerships and Stories campaigns, with over 403 million monthly active users.
- Global long-term engagement patterns remain relatively stable across countries, averaging around 0.48%.
- Over 500 million daily active users engage with Stories amidst varying regional sponsored content regulations.
- Audience expansion is thriving in developing economies, driving the addition of 40 million new users globally from 2024 to 2025.
- Global brands increasingly localize their creative strategies because 90.43% of the reachable advertising audience resides outside the US.
Best Posting Frequency and Story Length Statistics
- Research analyzing 161,180 Instagram Stories found the strongest reach growth between 6 and 13 Stories published in a day.
- Reach rate increases from 6.3% with a single Story to approximately 20.5% by the sixth Story.
- Story reach peaks at roughly 37.8% around the 13th Story before declining in longer sequences.
- Posting fewer than three Stories generally limits overall visibility compared with longer Story sequences.
- Publishing significantly more than 13 Stories in one day may reduce reach because of audience fatigue.
- Video Stories consistently outperform image Stories in reach across every follower-size category measured.
- Brands increasingly combine short videos, static images, polls, and Link Stickers within the same Story sequence to improve completion rates.
- The most successful Story strategies balance posting frequency with content variety instead of maximizing the number of Story slides alone.
Stories Retention Statistics
- The highest viewer loss occurs on the first Story, where the average exit rate reaches 23.8%.
- Exit rates decrease to 20.5% on the second Story and 18.5% by the third as committed viewers continue watching.
- Between Stories 4 and 9, exit rates gradually improve from 15.7% to 13.3%, representing the strongest retention period.
- Around Story 15, average exit rates stabilize near 12.5%, although viewer fatigue begins appearing after longer sequences.
- The strongest reach growth occurs between 6 and 13 consecutive Stories, indicating that well-structured Story sequences improve retention.
- Story impressions continue increasing through approximately the 10th Story, reflecting sustained viewer interest before flattening.
- Video Stories consistently generate stronger attention and lower tap-forward behavior than image Stories across most account sizes.
- Brands increasingly monitor completion rate, exits, forward taps, and back taps together to understand Story retention more accurately.
Frequently Asked Questions (FAQs)
More than 500 million accounts use Instagram Stories daily, making it one of the world’s most-used social media content formats.
The average first-slide exit rate is 23.8%, meaning nearly one in four viewers leave after the opening Story.
Benchmark data shows that posting 6 to 13 Stories in a sequence delivers the strongest reach growth, with peak reach of approximately 37.8% around the 13th Story.
Instagram’s advertising audience exceeded 1.74 billion users globally during 2025, providing marketers with one of the largest social advertising audiences.
Instagram Stories accounted for approximately 44% of Instagram ad impressions during Q2 2025, highlighting their importance in advertising campaigns.
Conclusion
Instagram Stories continue to play a central role in social media marketing, with over 500 million daily users and growing opportunities for brands, creators, and advertisers. Recent benchmark data shows that Story success depends less on publishing the highest volume of content and more on maintaining viewer retention, encouraging interaction, and optimizing Story sequences. Features such as Link Stickers, interactive stickers, AI-powered advertising tools, and product tags have expanded Stories beyond simple content sharing into a performance-driven marketing channel.
As Instagram’s recommendation systems continue evolving, businesses that focus on meaningful engagement, high-quality creative, and data-backed optimization will remain best positioned to maximize reach, conversions, and long-term audience loyalty.
