



LinkedIn has moved far beyond an online resume directory. Recruiters use it to identify candidates, sales teams use it to reach decision-makers, and companies use its professional graph to study skills and labor-market shifts. The network now connects more than 1.3 billion members, giving businesses a large pool of professional identity, employment, company, and skills data. Explore the statistics below to see how LinkedIn’s audience and global footprint continue to change.
Editor’s Choice
- LinkedIn surpassed 1.3 billion members in 2026, up from approximately 1.2 billion in 2025.
- The United States had approximately 270 million registered members in late 2025, after adding 30 million over the preceding year.
- India reached about 170 million members in late 2025, representing year-over-year growth of 21.4%.
- Brazil passed 100 million members in June 2026, putting it among the platform’s three largest national markets.
- LinkedIn generated about $19.8 billion in annual revenue by fiscal 2026, while fourth-quarter revenue rose 12% year over year.
- The 2026 professional data graph included 71 million companies, 145,000 schools and 42,000 skills, illustrating the scale of information available for hiring and workforce analysis.
- Members worldwide view more than 1.8 million feed updates every minute, showing the volume of professional content distributed through the network.
Recent Developments
- LinkedIn crossed the 1.3 billion-member threshold by 2026, extending a multiyear period of double-digit membership expansion.
- Annual revenue climbed to approximately $19.8 billion by fiscal 2026, compared with more than $17 billion reported around the end of fiscal 2025.
- Revenue increased 12% year over year in the quarter ended June 30, 2026, or 10% after adjusting for currency movements.
- The Economic Graph expanded to more than 501 billion edges by mid-2026, representing relationships among members, employers, schools, skills, jobs and other professional entities.
- Brazil became a 100 million-member market in June 2026. That was 10 million higher than the 90 million registered-member audience reported for late 2025.
- Brazil’s professional community was generating more than 1,100 new connections per minute and viewing more than 101,600 feed updates per minute by June 2026.
- During fiscal 2025, comments increased by more than 30%, while video uploads rose more than 20%, signaling continued expansion beyond traditional text-based professional updates.
- Earlier in fiscal 2025, video viewing time had already increased 36% year over year, while comments were up 32%, showing that richer content formats contributed to engagement growth.
LinkedIn Overview and History
- LinkedIn began in co-founder Reid Hoffman’s living room in 2002 and officially launched on May 5, 2003.
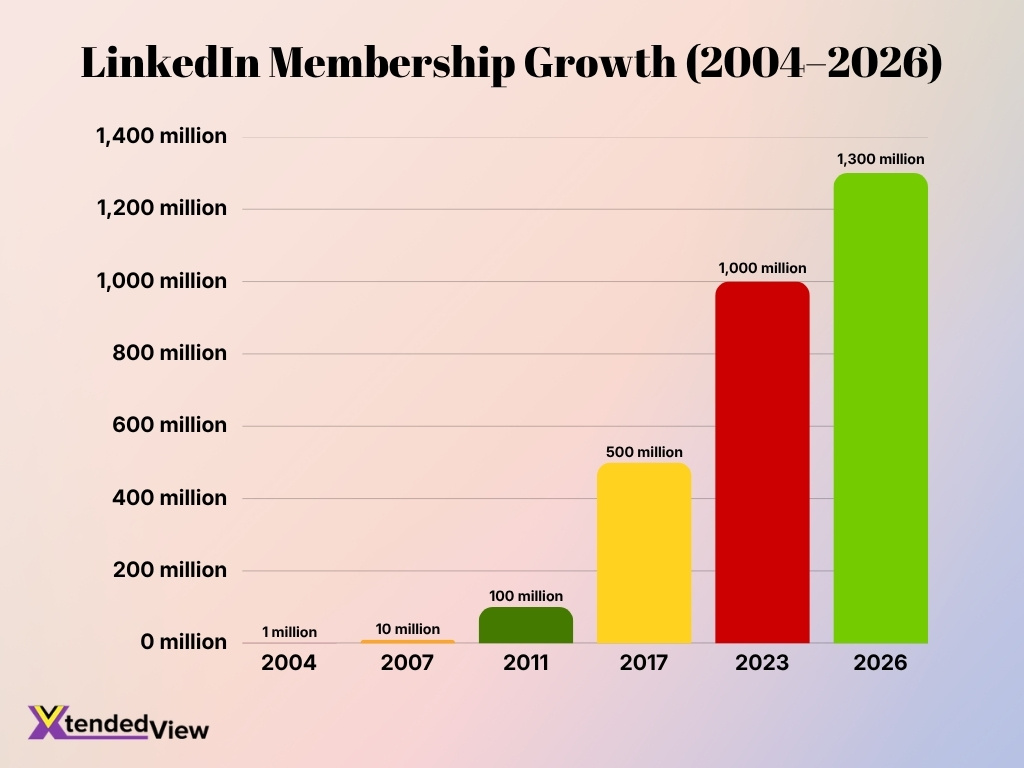
- The network reached its first 1 million members in 2004, roughly one year after its public launch.
- LinkedIn reached 10 million members in 2007, demonstrating its early growth as an online professional network.
- The platform crossed 100 million members in 2011, eight years after launch.
- Membership reached 500 million in 2017, representing a fivefold increase from the 2011 milestone.
- The company agreed to an acquisition valued at $26.2 billion in 2016, based on an all-cash offer of $196 per share.
- The acquisition officially closed on Dec. 8, 2016; subsequent financial reporting recorded a total purchase price of approximately $27 billion.
- LinkedIn reached 1 billion members in 2023 and added roughly another 300 million members by 2026.
LinkedIn User and Membership Growth Statistics
- LinkedIn reported more than 1.3 billion members in 2026, compared with 1.2 billion at the end of fiscal 2025.
- Membership achieved five consecutive years of double-digit growth by fiscal 2026; the comparable figure in 2025 was four consecutive years.
- The U.S. registered-member audience rose from about 240 million to 270 million between the end of 2024 and the end of 2025, a 12.5% increase.
- India’s audience expanded from approximately 140 million to 170 million over the same period, an increase of 30 million or 21.4%.
- Brazil’s registered-member audience increased by 12 million, or 15.4%, between late 2024 and late 2025, reaching approximately 90 million.
- Brazil subsequently reached 100 million members in June 2026, adding another major milestone within months of the late-2025 measurement.
- The UK’s registered-member audience increased by 5 million, or 11.6%, between the end of 2024 and the end of 2025, reaching 48 million.
- Canada added approximately 3 million members over the same period, lifting its registered audience to 29 million and producing 11.5% growth.
- LinkedIn’s expansion has accelerated over a long period: the network moved from 100 million members in 2011 to more than 1.3 billion in 2026, an increase of more than 1.2 billion memberships.
LinkedIn User Demographics
- Adults aged 25 to 34 formed the largest global advertising-audience segment in January 2025, accounting for 47.3% of the measured audience when male and female segments were combined.
- Men aged 25 to 34 accounted for 26.8% of the global advertising audience, making them the largest individual age-and-gender segment in the 2025 data.
- Women aged 25 to 34 represented 20.5% of the same global audience.
- Adults aged 18 to 24 represented 28.7% of the global advertising audience in early 2025, including 16.2% male and 12.5% female members.
- Adults aged 35 to 54 made up 20.7% of the global measured audience, split between 11.7% male and 9% female members.
- Members aged 55 and older represented just 3.3% of the global measured audience in early 2025, including 2.2% male and 1.1% female members.
- In the United States, the late-2025 registered advertising audience had an even 50% female and 50% male split.
- India showed a wider gender gap: 69.2% of its late-2025 advertising audience was male and 30.8% was female.
- Brazil had one of the more balanced large-market audiences in late 2025, with 50.6% male and 49.4% female members in the measured advertising population.
- Canada was also relatively balanced at 52% male and 48% female, while the UK stood at 54.5% male and 45.5% female in late 2025.
LinkedIn Users by Country and Region
- The United States remained LinkedIn’s largest national audience with roughly 270 million registered members in late 2025, equivalent to 77.6% of the country’s total population.
- India ranked among the platform’s largest markets with approximately 170 million members in late 2025. That audience equaled 16.4% of India’s population aged 18 and older.
- Brazil had about 90 million members in late 2025 before reaching 100 million in June 2026, making it one of LinkedIn’s three largest countries by membership.
- The United Kingdom had approximately 48 million members in late 2025, equivalent to 86.8% of its population aged 18 and older.
- Canada had approximately 29 million registered members in late 2025, with reported ad reach equal to 88.2% of adults aged 18 and older.
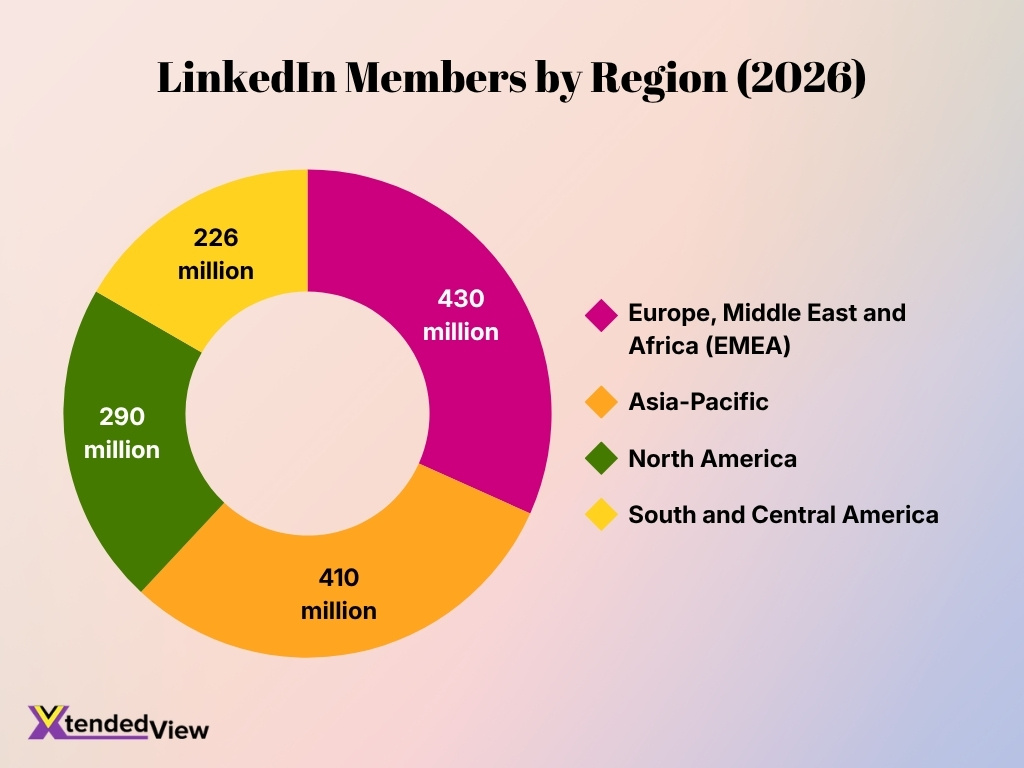
- At the regional level, the Asia-Pacific membership base exceeded 410 million in 2026, making it one of the network’s largest geographic communities.
- Europe, the Middle East and Africa collectively accounted for more than 430 million members in the latest 2026 regional reporting.
- North America represented more than 290 million members, including the large U.S. and Canadian professional audiences.
- South and Central America accounted for more than 226 million members, supported by rapid expansion in Brazil and other Latin American markets.
LinkedIn Usage, Website Traffic, and Active User Statistics
- LinkedIn recorded an estimated 1.68 billion website visits in July 2026, up from 1.48 billion in June and 1.51 billion in May.
- The website ranked No. 19 globally by traffic in July 2026 and No. 20 in the United States.
- U.S. visitors generated an estimated 473.73 million visits in July 2026, accounting for 28.21% of worldwide web traffic.
- India generated approximately 147.29 million visits, or 8.77% of July 2026 traffic. Brazil followed with 75.61 million visits, while the UK generated 74.58 million.
- In June 2026, visitors viewed an average of 7.18 pages per visit and spent 10 minutes, 43 seconds per visit. The estimated bounce rate was 36.44%.
- Direct navigation produced 71.88% of desktop traffic in July 2026, while Google accounted for another 16.49%.
- AI platforms sent approximately 15.3 million visits to LinkedIn in July 2026. ChatGPT represented 72.81% of that AI-driven traffic.
- Member activity extends beyond website visits: more than 1.8 million feed updates are viewed every minute in 2026.
- Members also make more than 18,000 professional connections per minute, demonstrating that networking remains a major source of platform activity.
LinkedIn Mobile App Statistics
- The Android app had an estimated 4 million worldwide downloads during the latest measured month in August 2026.
- The Android app’s lifetime install range stood between 1 billion and 5 billion installs on Google Play in 2026.
- India, the United States, and Brazil ranked as the Android app’s top three geographic markets, matching three of LinkedIn’s largest membership bases.
- Estimated Android in-app revenue reached approximately $12 million worldwide during the latest measured month.
- On iOS, the app generated an estimated 3 million worldwide downloads during the latest measured month in August 2026.
- Estimated worldwide iOS revenue reached approximately $52 million during the same period, substantially above the Android estimate.
- The iOS app dated its worldwide release to Aug. 20, 2008, while the Android version listed its worldwide release as April 7, 2011.
- In Brazil, the iOS app averaged roughly 32,000 to 37,000 weekly downloads during Q4 2025, while weekly active users declined modestly from around 2.5 million to 2.3 million by year-end.
- LinkedIn continued frequent mobile development in 2026: the Android app showed an update dated Aug. 17, 2026, while the iOS version showed an Aug. 20 update.
LinkedIn Content Format Engagement Statistics
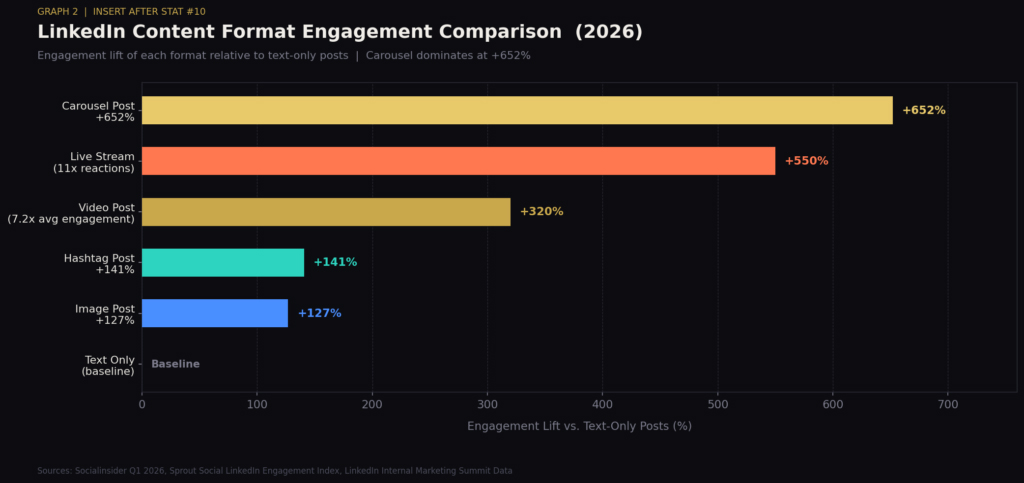
- Carousel posts generate the strongest engagement, delivering a 652% lift compared with text-only LinkedIn posts.
- Live streams produce a 550% engagement lift and attract roughly 11x more reactions, highlighting the value of real-time content.
- Video posts achieve a 320% engagement lift, with around 7.2x higher average engagement than standard content.
- Hashtag posts record a 141% engagement lift, showing that strategic hashtag use can improve content interaction.
- Image posts deliver a 127% engagement lift over text-only posts, making visual content notably more engaging.
- Text-only posts serve as the baseline, with every measured visual or interactive format generating substantially higher engagement.
LinkedIn Video, Newsletter, and Creator Statistics
- Video viewing time increased 36% year over year during fiscal Q3 2025.
- In fiscal Q1 2025, weekly views of LinkedIn’s immersive video experience increased sixfold quarter over quarter.
- Video creation was growing at 2x the rate of other original formats by fiscal Q2 2025.
- Across fiscal 2025, video uploads ultimately increased more than 20%, confirming that the early growth continued through the year.
- Paid video advertising continued that momentum into 2026. In fiscal Q2 2026, paid video ads grew 30%, alongside continued double-digit membership growth.
- By the latest fiscal 2026 reporting, paid video ads were still growing 26% year over year.
- An earlier creator-product update reported a 625% increase in newsletters published after broader access to newsletter creation, alongside an 89% rise in newsletter subscriptions.
- LinkedIn newsletter analytics can measure article views and new subscribers across selectable periods from seven to 365 days, giving creators a direct way to monitor audience growth.
- In a 2025 B2B benchmark, 78% of marketers used video, while 55% used influencer marketing. Marketers using these approaches reported stronger performance across brand awareness, lead generation, and revenue growth.
LinkedIn Company Page and Follower Statistics
- LinkedIn’s network contained approximately 71 million companies by June 2026, creating a large ecosystem of organizational identities and employer profiles.
- Pages with complete business information receive 30% more weekly views than incomplete Pages, based on platform data reported in July 2025.
- Companies that publish at least weekly see 2x higher engagement than companies that post less frequently.
- For smaller organizations, follower growth can accelerate after a Page reaches roughly 150 followers, making the first audience-building stage particularly important.
- Page admins can notify employees about an important Page post up to once per week, extending content through employee networks.
- Follower analytics track new followers across the previous 365 days, while the lifetime follower total updates once per day.
- Follower data can be segmented across seven professional demographic dimensions, including country, industry, function, seniority and company size.
- For each demographic dimension exposed through the follower-statistics interface, results can return up to the top 100 segments, such as the top 100 countries represented among followers.
- Company Page analytics cover at least seven major areas: content, followers, visitors, search appearances, competitors, employer brand and newsletters.
- More than 100 million members had added a verification by December 2025, while LinkedIn stated a broader ambition to expand verification across members, jobs and Company Pages.
LinkedIn Hiring Performance Insights
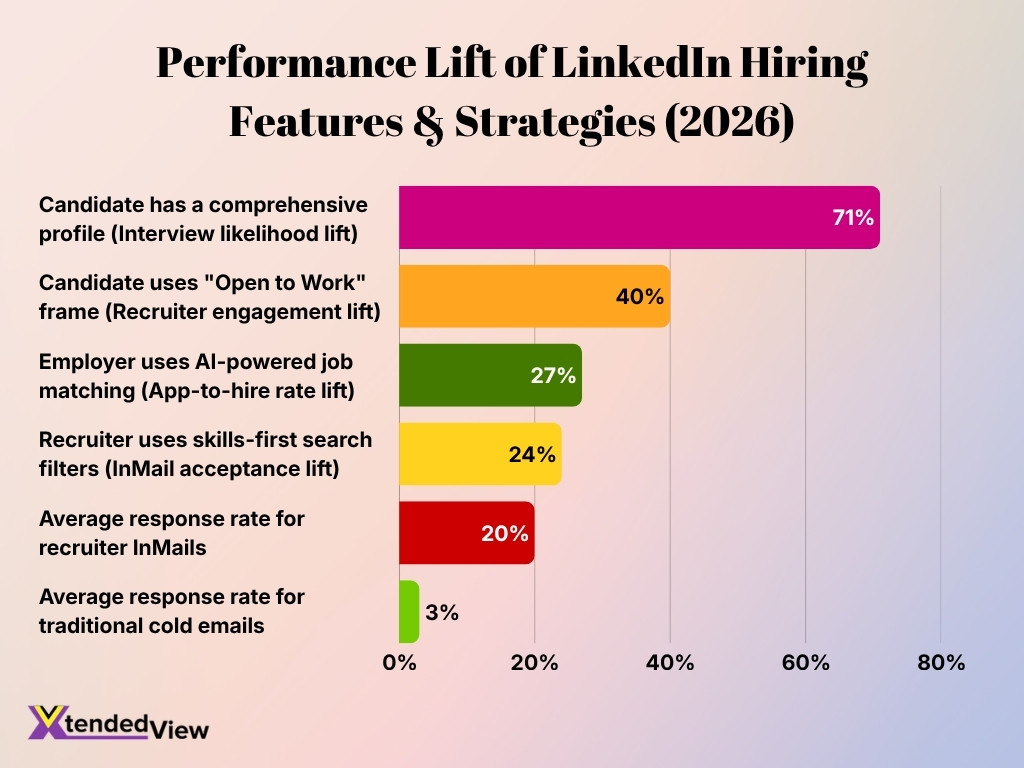
- Candidates with a comprehensive LinkedIn profile see the strongest impact, with a 71% increase in interview likelihood.
- Using the “Open to Work” frame can boost recruiter engagement by 40%, highlighting the value of signaling job availability.
- Employers using AI-powered job matching achieve a 27% lift in app-to-hire rates, indicating stronger candidate-job alignment.
- Recruiters applying skills-first search filters can improve InMail acceptance rates by 24%, reinforcing the shift toward skills-based hiring.
- Recruiter InMails record an average 20% response rate, making them a comparatively effective direct outreach channel.
- Traditional cold emails generate an average response rate of just 3%, substantially below LinkedIn InMail performance.
- Based on these figures, LinkedIn InMails deliver roughly 6.7 times the response rate of traditional cold emails.
LinkedIn Skills and Learning Statistics
- LinkedIn listed more than 42,000 skills across its professional ecosystem in 2026.
- Members consume approximately 123 hours of learning content every minute, equivalent to about 177,000 hours per day if the current rate remains constant.
- In the U.S., job postings requiring AI literacy skills increased 70% year over year in the latest 2026 labor-market analysis.
- Over the preceding two years, roughly 1.3 million new AI-enabled jobs emerged globally, illustrating how skills requirements are moving beyond traditional job categories.
- Employees at organizations with LinkedIn Learning were developing AI skills 3.4x faster year over year than employees without access to the product.
- In 2025, 49% of learning and talent-development professionals said their executives worried employees lacked the skills required to execute business strategy.
- Only 36% of organizations qualified as career-development champions with mature programs that produced business results; 31% had programs with limited adoption, and 33% had little or no established initiative.
- Career-development leaders were 42% more likely to be frontrunners in generative AI adoption than organizations with weaker career-development programs.
- 71% of organizations offered leadership training in the 2025 workplace-learning research, making it the most common career-development practice measured.
- 84% of employees agreed that learning adds purpose to their work, while only 15% said their manager had helped them build a career plan during the preceding six months.
LinkedIn Premium Statistics
- Premium subscriptions surpassed $2 billion in annual revenue for the first time in fiscal Q2 2025.
- Premium subscriber growth increased by nearly 50% over two years leading into early 2025.
- Nearly 40% of Premium subscribers had used AI-powered profile tools by early 2025, showing that generative AI had become a meaningful subscription feature rather than an experimental add-on.
- Premium Pages for small and midsize businesses recorded more than 75% quarter-over-quarter subscriber growth in fiscal Q3 2025.
- By fiscal Q4 2026, Premium revenue was still expanding at a double-digit year-over-year rate, extending the subscription business’s growth into the current year.
- Premium Company Pages can produce up to 7.5 times more Page engagement and 5.8 times more Page views than comparable non-Premium Pages.
- Early users of Premium All-in-One recorded a 57% rise in followers and a 40% increase in profile views, giving small businesses measurable gains in visibility.
- Daily prospect suggestions in Premium All-in-One produced up to a 60% increase in reply rates in early performance data.
- The Top Applicant feature increased Premium members’ chances of getting hired by nearly four times, according to late-2025 product data.
- Premium Company Pages helped participating small businesses attract followers 6.7 times faster in late 2025, demonstrating how subscriptions increasingly support business growth as well as individual career development.
LinkedIn Ad Performance by Format Statistics
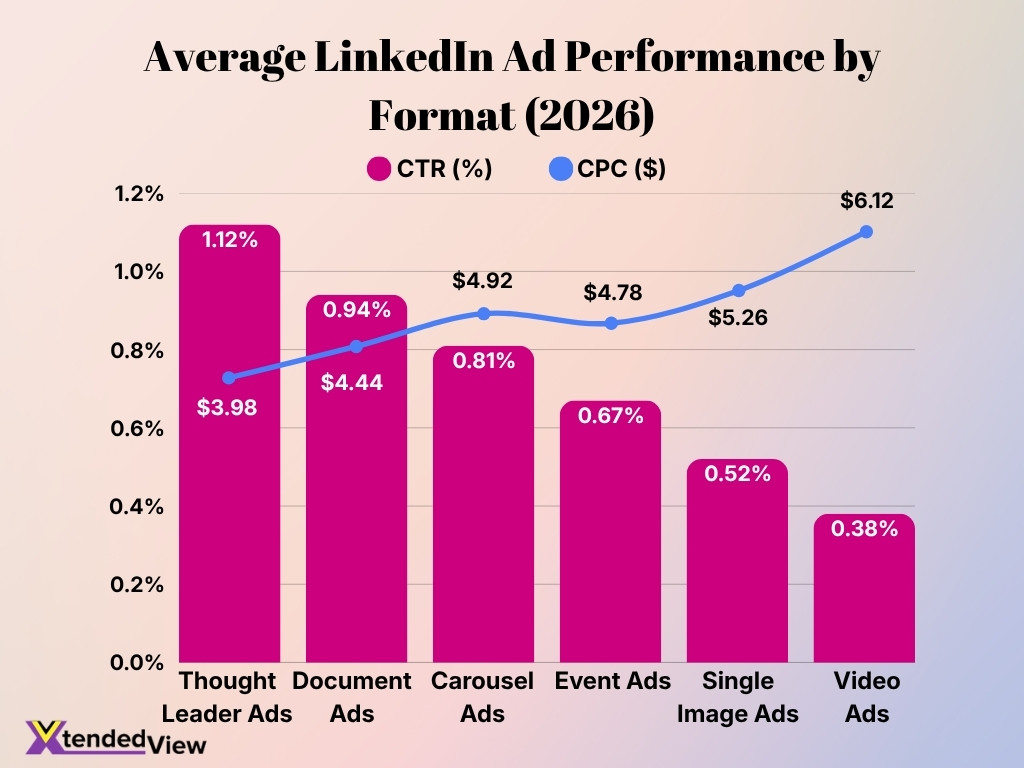
- Thought Leader Ads deliver the strongest performance, recording the highest average CTR of 1.12% and the lowest CPC at $3.98.
- Document Ads rank second for engagement with a 0.94% CTR, while maintaining a relatively competitive $4.44 CPC.
- Carousel Ads generate an average CTR of 0.81% at a CPC of $4.92, positioning them in the middle of LinkedIn’s ad formats.
- Event Ads achieve a 0.67% CTR with an average CPC of $4.78, slightly cheaper per click than Carousel Ads despite lower engagement.
- Single Image Ads record a comparatively modest 0.52% CTR, alongside a higher average CPC of $5.26.
- Video Ads show the lowest average CTR at 0.38% and the highest CPC at $6.12, making them the weakest format on these two performance metrics.
- The CTR gap between Thought Leader Ads and Video Ads is 0.74 percentage points, while Thought Leader Ads cost $2.14 less per click, highlighting a substantial performance difference across formats.
LinkedIn B2B Marketing, Lead Generation, and Social Selling Statistics
- 82% of B2B marketers working with creators said influencer campaigns were essential for delivering measurable ROI in a five-country study conducted in early 2026.
- 81% of B2B CMOs said video accelerates the sales cycle compared with other content formats.
- Another 79% of B2B CMOs said video speeds up lead conversion, connecting video engagement with lower-funnel outcomes.
- Among buyers who rely on professional creators, 56% use creator input during the final buying stage to validate or confirm recommendations.
- 81% of marketers using creators said reducing creator investment would leave revenue on the table.
- Millennials and Gen Z now account for 71% of B2B buyer-group members, shifting more purchasing influence toward younger professionals.
- AI-powered Buyer Groups have delivered a 20% improvement in pipeline conversion in current campaign benchmarks.
- The same Buyer Groups approach produced 25% better cost efficiency, giving marketers a measurable performance benefit from professional-data targeting.
- Sales professionals using Account IQ to research prospects achieved a 17% higher connection rate, while personalized outreach based on the tool produced a 46% higher InMail acceptance rate.
- Sales Navigator users who completed at least five tracked actions closed 31% more deals and generated 45% more revenue in 2025 product-performance data.
LinkedIn Revenue and Business Model Statistics
- LinkedIn generated $19.8 billion in revenue in fiscal 2026, its highest reported annual total to date.
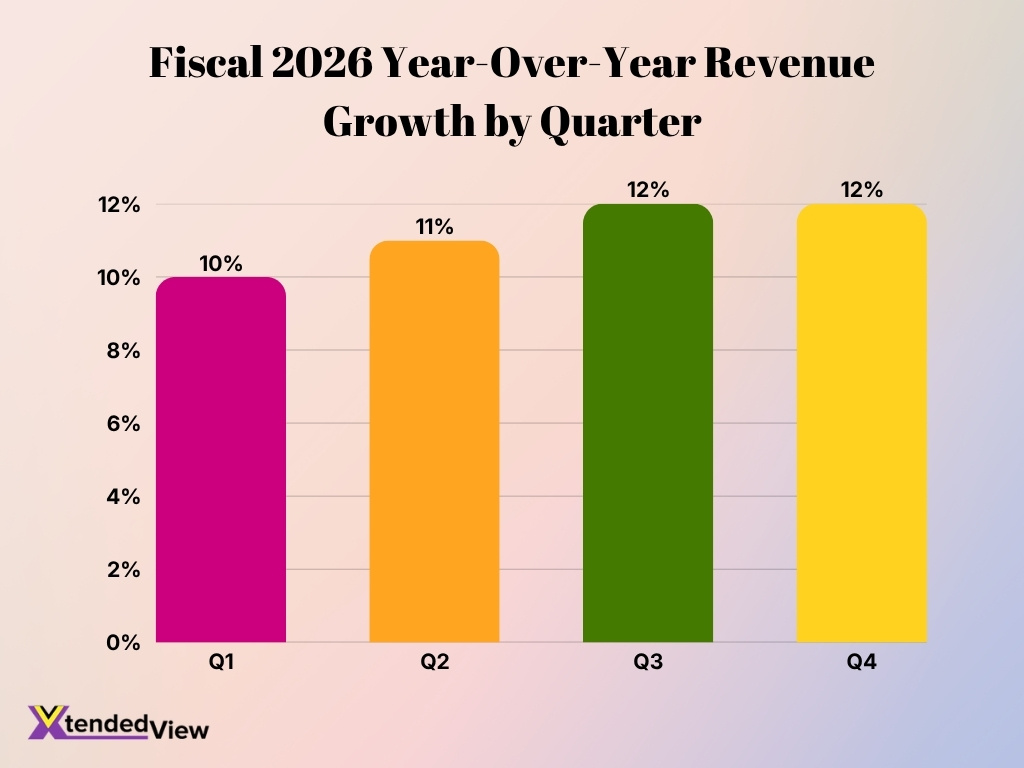
- By fiscal Q1 2026, trailing 12-month revenue had already reached approximately $18 billion, representing 10% year-over-year growth.
- Revenue increased 11% year over year in fiscal Q2 2026, or 10% after adjusting for currency movements.
- Growth accelerated to 12% in fiscal Q3 2026, compared with 9% on a constant-currency basis.
- Fiscal Q4 2026 revenue also increased 12% year over year, helping lift the full-year business to $19.8 billion.
- For comparison, fiscal Q3 2025 revenue had grown 7% year over year, showing a clear acceleration in reported growth during the following year.
- Marketing Solutions revenue increased 16% year over year in fiscal Q4 2026 and recorded its seventh consecutive quarter of double-digit growth.
- AI-powered agentic hiring products within Talent Solutions exceeded a $450 million annual revenue run rate by fiscal Q3 2026.
- LinkedIn’s commercial model spans four core revenue categories: Talent Solutions, Marketing Solutions, Premium Subscriptions and Sales Solutions.
LinkedIn AI and Economic Graph Statistics
- The Economic Graph in 2026 draws on data from more than 1.3 billion members, 71 million companies, 145,000 schools and 42,000 skills.
- More than 1.3 million AI-enabled jobs emerged globally between 2023 and 2025 as companies adopted new technology and created new categories of work.
- Data annotator roles accounted for approximately 774,000 of those new jobs, while Head of AI positions represented another 298,000.
- AI Engineer roles contributed approximately 177,000 new jobs, and the occupation expanded about 13-fold from its 2023 level.
- Forward-deployed engineering and related product roles grew about 42 times from 2023, although their estimated absolute increase was smaller at roughly 9,000 jobs.
- AI engineering hiring grew more than 25% year over year in 2025, while AI engineering vacancies represented nearly 7% of all technical job postings.
- Members added AI Agents as a skill more than 70 times faster in 2025 than during the comparable period a year earlier.
- Job postings requiring AI-literacy skills grew more than 70% year over year, with demand spreading into sales, marketing, design and other nontechnical roles.
- By fiscal Q4 2026, recruiters at more than 20,000 companies were using AI-powered hiring products, while seats across enterprise AI hiring products increased 140% quarter over quarter.
- U.S. AI job postings had roughly doubled since 2023 by August 2026. Typical listed compensation was about $177,000 for an AI role versus $80,000 for a non-AI position.
Frequently Asked Questions (FAQs)
LinkedIn has more than 1.3 billion members worldwide in 2026, spanning more than 200 countries and territories.
LinkedIn generated $19.8 billion in fiscal 2026 revenue, with Q4 revenue increasing 12% year over year.
LinkedIn Ads was growing approximately 14% year over year in May 2026, with video ads up more than 20% and event ads up more than 50%.
Recruiters at more than 20,000 companies were using LinkedIn’s AI-powered hiring solutions by Q4 FY2026, while enterprise AI hiring product seats increased 140% quarter over quarter.
Typical U.S. AI job postings listed about $177,000 in compensation, compared with $80,000 for non-AI roles, while U.S. AI job postings roughly doubled between 2023 and 2026.
Conclusion
LinkedIn’s data shows continued growth across audience size, revenue and business use. With more than 1.3 billion members and about $19.8 billion in annual revenue, the platform plays a major role in hiring, professional learning, B2B marketing and sales.
AI, video and skills-based hiring are also becoming more important across the platform. Overall, LinkedIn continues to evolve into a broader professional ecosystem connecting people, jobs, companies, skills and business opportunities.
