


Nintendo remains one of the world’s most influential gaming companies, with its hardware, software, and digital services shaping how millions of people play games. Its performance affects game developers, retailers, investors, and the broader entertainment industry, while franchises like Mario, Zelda, and Pokémon continue to drive consumer spending across multiple platforms. This article explores the latest Nintendo statistics, including revenue, profits, console performance, and recent business developments to help you understand where the company stands today.
Editor’s Choice
- Nintendo generated ¥2.313 trillion (about $14.8 billion) in net sales during fiscal year 2026, nearly doubling from the previous fiscal year following the successful launch of Nintendo Switch 2.
- The company reported ¥424 billion (approximately $2.7 billion) in net profit for FY2026, representing a 52% year-over-year increase.
- Nintendo’s operating income reached ¥360.1 billion in FY2026, reflecting strong hardware and software demand.
- Nintendo Switch 2 sold 19.86 million units during its first fiscal year after launching in June 2025.
- The original Nintendo Switch lifetime sales climbed to 155.92 million units, making it Nintendo’s best-selling console ever.
- Mario Kart World sold 14.7 million copies during FY2026, becoming the company’s biggest Switch 2 launch title.
- Nintendo expects to sell 16.5 million Switch 2 consoles during fiscal year 2027 despite higher hardware prices in several markets.
Recent Developments
- Nintendo officially launched Nintendo Switch 2 worldwide on June 5, 2025, marking its first new console generation in more than eight years.
- The company reported 19.86 million Switch 2 units shipped by the end of FY2026, well above its initial launch expectations.
- Nintendo revised its initial Switch 2 sales forecast upward during FY2026 before finishing the year with record hardware shipments.
- Mario Kart World reached 14.7 million copies sold, including bundled editions, making it the flagship title for the new platform.
- Donkey Kong Bananza sold 4.52 million copies during FY2026, ranking among Nintendo’s strongest new releases.
- Nintendo announced price increases for Switch 2 hardware in several regions due to rising production and logistics costs.
- The company forecast ¥2.05 trillion in net sales and ¥370 billion in operating income for FY2027, reflecting a more normalized sales cycle after the launch year.
- Nintendo scheduled its FY2027 first-quarter earnings release for August 6, 2026, continuing its regular investor reporting cycle.
Nintendo Annual Net Sales Statistics
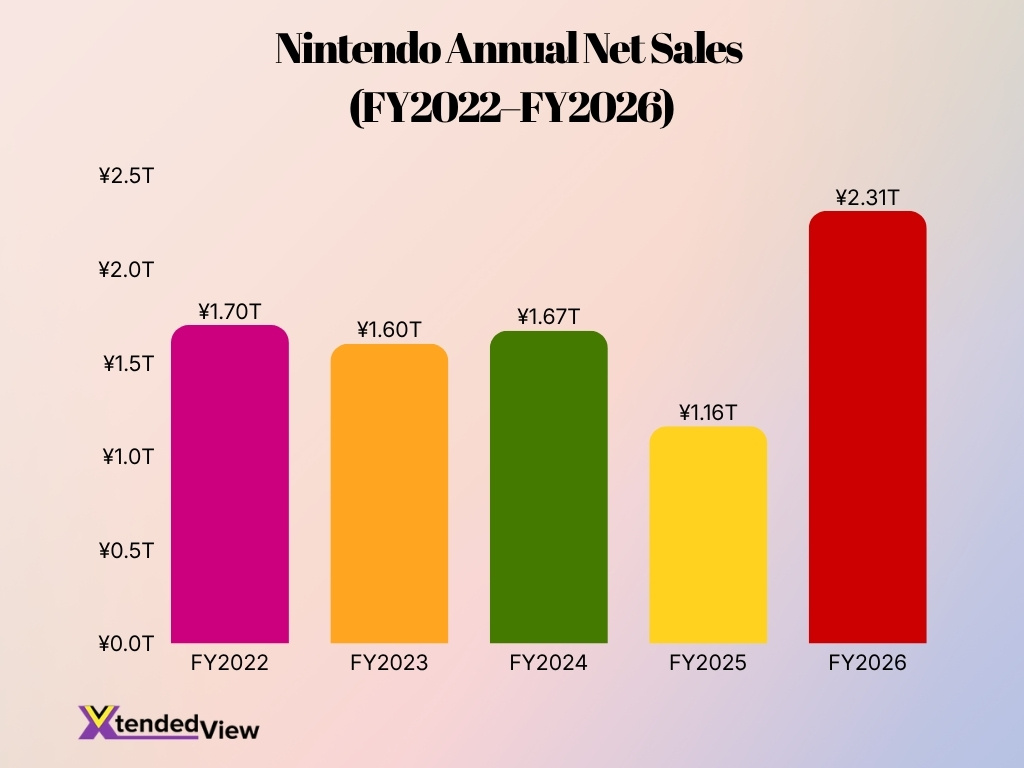
- Nintendo’s net sales reached JPY 2.31 trillion in FY2026, the highest figure recorded during the five-year period.
- Net sales increased by approximately 99.1% from JPY 1.16 trillion in FY2025 to JPY 2.31 trillion in FY2026.
- FY2025 recorded the lowest annual net sales at JPY 1.16 trillion.
- Nintendo generated JPY 1.70 trillion in net sales during FY2022.
- Net sales declined by approximately 5.9% to JPY 1.60 trillion in FY2023.
- The company recorded a modest recovery in FY2024, with net sales rising by around 4.4% to JPY 1.67 trillion.
- From FY2022 to FY2026, Nintendo’s annual net sales increased by approximately 35.9%.
- The sharp FY2026 growth indicates a significant improvement in Nintendo’s overall sales performance compared with the previous fiscal year.
Nintendo Revenue Statistics
- Nintendo generated ¥2.313 trillion in net sales during FY2026, its strongest annual revenue performance in company history.
- Annual revenue increased by nearly 98% compared with FY2025, largely because of Switch 2 hardware demand.
- During the fourth quarter of FY2026 alone, Nintendo produced ¥407.1 billion in revenue.
- Digital revenue reached ¥407.6 billion in FY2026, supported by downloadable games, DLC, and Nintendo Switch Online.
- Mobile and IP-related revenue totaled ¥73.5 billion during FY2026.
- Nintendo projects ¥2.05 trillion in revenue for FY2027, representing a modest decline after the exceptional launch year.
- During the first nine months of FY2026, Nintendo generated ¥1.906 trillion in revenue before finishing the fiscal year above ¥2.3 trillion.
- Hardware sales remained the largest revenue contributor during FY2026, while software and digital services also posted strong growth.
Nintendo Operating Income Statistics
- Nintendo reported ¥360.1 billion in operating income for FY2026.
- Fourth-quarter operating income totaled ¥59.7 billion.
- Operating profit benefited from strong first-party software sales and higher Switch 2 hardware volumes.
- Nintendo forecasts ¥370 billion in operating income for FY2027 despite expected lower hardware shipments.
- During the first nine months of FY2026, operating income reached ¥309.9 billion before ending the year at ¥360.1 billion.
- Higher digital software sales continued to support operating margins throughout FY2026.
- Nintendo maintained profitability despite increased manufacturing, logistics, and marketing expenses associated with Switch 2.
- First-party software remained the company’s highest-margin revenue category during FY2026.
Nintendo Monthly Active Users Statistics
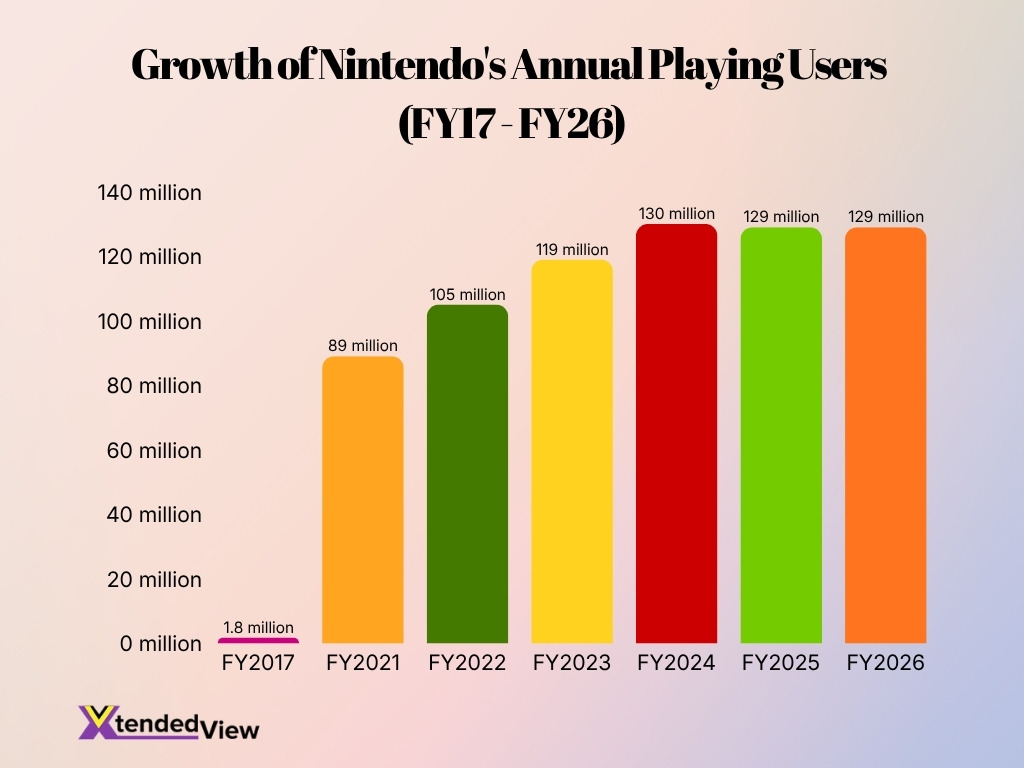
- Nintendo does not regularly publish a conventional monthly active-user figure for its console ecosystem, so its closest official engagement measure is annual playing users.
- Nintendo reported more than 100 million annual playing users for the 12 months ending March 2026.
- Its published chart placed the fiscal 2026 figure at approximately 129 million users.
- Annual playing users also totaled about 129 million during fiscal 2025, indicating stable engagement during the hardware transition.
- The metric reached a high of roughly 130 million users in fiscal 2024.
- Nintendo recorded approximately 119 million annual players during fiscal 2023.
- Annual playing users stood near 105 million in fiscal 2022, showing that the active audience continued expanding late in the original Switch cycle.
- The metric counted 89 million users during fiscal 2021, when gaming activity rose sharply worldwide.
- Nintendo’s annual player count rose from roughly 1.8 million in fiscal 2017 to 129 million in fiscal 2026.
- Nintendo counts a playing user when a Nintendo Account registered to Switch or Switch 2 launches compatible software at least once during the 12-month measurement period.
Nintendo Profit Statistics
- Nintendo earned ¥424 billion in net profit during FY2026.
- Net profit increased 52% year over year, supported by the successful Switch 2 launch.
- Ordinary income reached ¥542.1 billion during FY2026.
- Fourth-quarter ordinary income totaled ¥86.3 billion.
- Nintendo expects FY2027 operating profit to remain around ¥370 billion, although net profit is projected to moderate as launch momentum normalizes.
- Strong sales of first-party franchises continued to generate high profit margins compared with third-party publishing.
- Growth in digital software, downloadable content, and subscription services improved overall profitability during FY2026.
- Nintendo remained one of the gaming industry’s most profitable companies by combining hardware, software, and digital ecosystem revenue under a single platform strategy.
Nintendo Market Capitalization Statistics
- Nintendo’s market capitalization stood at approximately ¥10.5 trillion on July 30, 2026, based on its Tokyo-listed share price and reported market data.
- Another market-data estimate placed Nintendo’s value near ¥9.2 trillion on the same date, showing how share-count methodology and intraday pricing can produce different totals.
- Nintendo shares traded between ¥7,935 and ¥8,245 during the July 30 session.
- The stock opened at ¥8,123, compared with a previous close of ¥7,986.
- Nintendo’s 52-week share-price range extended from ¥6,544 to ¥14,795, indicating a wide valuation swing across the year.
- The company had 1.287 billion issued shares as of March 31, 2026, although treasury stock reduces the number used by some market-cap calculations.
- Nintendo had 484,413 shareholders at the end of fiscal 2026.
- The company remained listed on the Prime Market under stock code 7974, with each standard trading unit containing 100 shares.
- Nintendo’s share price had fallen by roughly one-third during 2026 by June, as investors weighed its software pipeline, component costs, and Switch 2 pricing.
- Nintendo’s U.S. ADR closed at $12.11 on July 29, 2026, after gaining 3.5% during that session.
Nintendo Console Sales Statistics
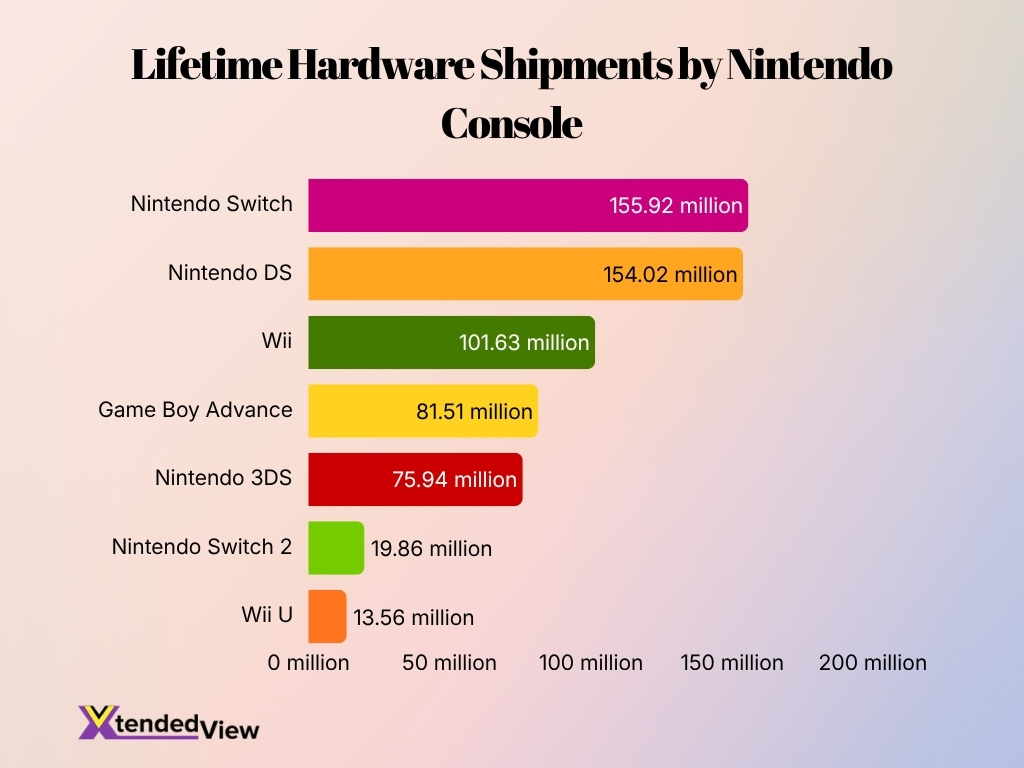
- Nintendo Switch had reached 155.92 million lifetime hardware shipments by March 31, 2026.
- Nintendo Switch 2 shipped 19.86 million units from its June 2025 launch through the end of fiscal 2026.
- Combined Switch and Switch 2 shipments totaled 175.78 million systems by March 2026.
- Nintendo DS remains one of the company’s largest platforms, with 154.02 million units sold worldwide.
- Wii sold 101.63 million units, making it Nintendo’s most successful home console before the Switch generation.
- Nintendo 3DS reached 75.94 million hardware units over its commercial life.
- Game Boy Advance accumulated 81.51 million unit sales worldwide.
- Wii U finished with 13.56 million units, far below Wii and the two Switch platforms.
- Nintendo Switch surpassed Nintendo DS during fiscal 2026 to become the company’s best-selling hardware platform by reported shipment volume.
- Switch 2’s first-year shipments exceeded Nintendo’s original 15 million-unit forecast and its later 19 million-unit forecast.
Nintendo Software Sales Statistics
- Nintendo Switch software had generated 1.528 billion lifetime unit sales by March 31, 2026.
- Switch 2 software reached 48.71 million units during the platform’s first fiscal year.
- Nintendo sold 136.91 million Switch software units during fiscal 2026, down 11.9% from the previous year.
- Combined Switch-generation software sales reached 185.62 million units in fiscal 2026 when Switch and Switch 2 results are added together.
- Nintendo Switch 2’s fiscal 2026 software total included approximately 12.6 million bundled units.
- Approximately 960,000 Switch software units sold in fiscal 2026 came bundled with other products.
- Nintendo DS software reached 948.76 million units across the system’s lifetime.
- Wii software sales totaled 921.85 million units, equal to more than nine games for every Wii console sold.
- Nintendo 3DS produced 392.30 million software sales, while Game Boy Advance generated 377.42 million.
- Wii U software reached 103.60 million units, giving the platform a software-to-hardware ratio of about 7.6 games per console.
Nintendo Switch Sales Statistics
- Nintendo Switch reached 155.92 million lifetime shipments by March 31, 2026.
- The platform added 3.80 million hardware units during fiscal 2026 despite entering its 10th year on the market.
- Switch shipments stood at 155.37 million units after the first nine months of fiscal 2026.
- Therefore, Nintendo shipped roughly 550,000 additional Switch systems during the fiscal fourth quarter.
- Switch lifetime sales exceeded Nintendo DS sales by 1.90 million units as of March 2026.
- Nintendo Switch software sales reached 136.91 million units during fiscal 2026.
- The platform’s lifetime software total rose to 1.528 billion units, or about 9.8 games for every console shipped.
- Switch hardware sales declined 66% year over year during the first nine months of fiscal 2026 as demand shifted toward Switch 2.
- First-nine-month Switch software sales fell 12.1% to 108.93 million units.
- Backward compatibility helped sustain older software because Switch 2 owners could continue playing many original Switch titles.
Nintendo Switch 2 Sales Statistics
- Nintendo Switch 2 shipped 19.86 million consoles by March 31, 2026, less than 10 months after launch.
- The system generated 48.71 million software sales during the same period.
- The resulting software-to-hardware ratio stood at approximately 2.45 games per console.
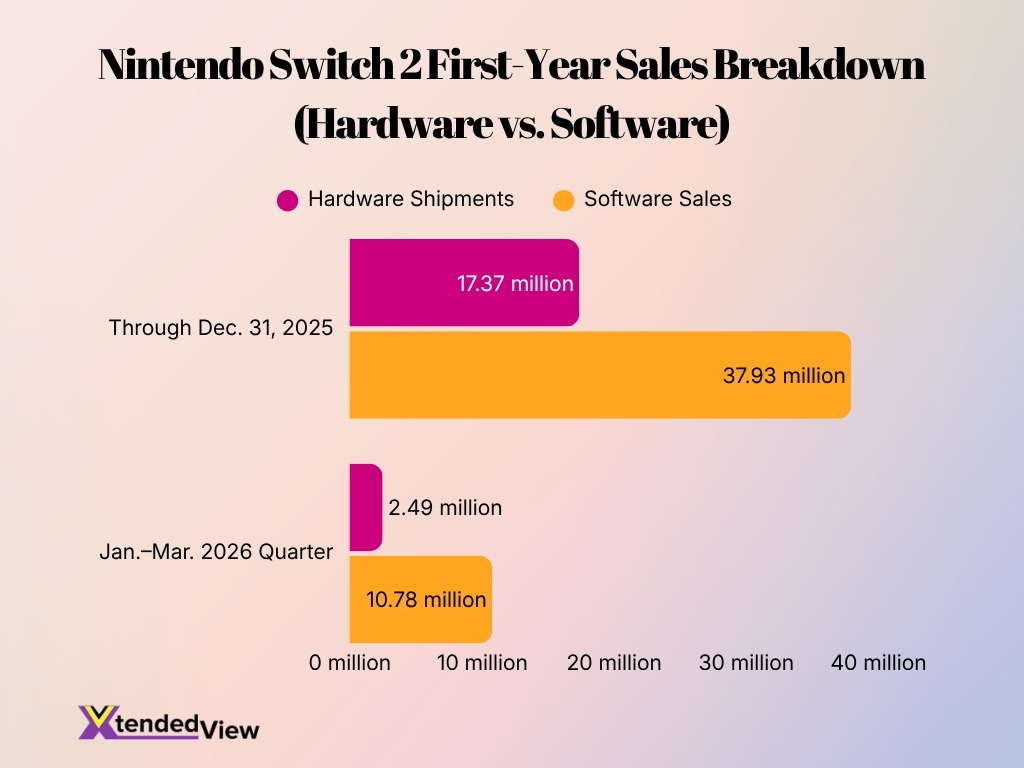
- Switch 2 had shipped 17.37 million systems through December 31, 2025.
- Nintendo consequently shipped another 2.49 million units during the January-to-March 2026 quarter.
- Switch 2 software sales rose from 37.93 million units after nine months to 48.71 million by year-end.
- That means Nintendo added 10.78 million software units during the final fiscal quarter.
- First-year hardware shipments beat the original 15 million-unit target by 4.86 million units, or 32.4%.
- Nintendo also exceeded its revised 19 million-unit forecast by 860,000 units.
- Nintendo described Switch 2 as its fastest-selling dedicated video game platform, with global consumer sell-through passing 15 million units during 2025.
Nintendo Accounts Statistics
- More than 400 million Nintendo Accounts had been created worldwide by November 2025.
- The account base was more than three times the approximately 129 million annual playing users recorded around the Switch 2 transition.
- Nintendo Accounts connect users across consoles, mobile applications, digital purchases, online services, and other entertainment experiences.
- Approximately 128 million annual playing users were reported during Nintendo’s November 2025 corporate-management briefing.
- About 84% of early Switch 2 players had moved from the original Switch ecosystem, according to data shared during that briefing.
- Nintendo reported around 34 million Nintendo Switch Online memberships in connection with its 2025 account update.
- Nintendo Accounts let the company preserve customer relationships when users migrate from Switch to Switch 2 instead of requiring an entirely separate identity system.
- Nintendo’s annual playing-user metric excludes accounts that only access services such as Nintendo eShop without launching software.
- One person may create or operate more than one account, so the 400 million account total does not equal 400 million individual consumers.
- The account system gives Nintendo a persistent global audience for digital games, subscriptions, mobile services, retail stores, films, and future hardware generations.
Nintendo Digital Sales Statistics
- Nintendo generated ¥407.6 billion in digital sales during fiscal 2026, up 25% from ¥326 billion in fiscal 2025.
- Digital sales increased by approximately ¥81.6 billion year over year, primarily because customers bought more downloadable versions of packaged games.
- Digital revenue accounted for 54.6% of Nintendo’s total dedicated video game software sales in fiscal 2026, compared with 53.5% one year earlier.
- Downloadable versions of packaged software represented 52.2% of fiscal 2026 digital sales, up from 46.9% in fiscal 2025.
- Nintendo recorded ¥69.8 billion in digital sales during the first fiscal quarter, followed by ¥85.6 billion in the second quarter.
- Third-quarter digital sales climbed to ¥126.5 billion, supported by holiday demand and major software releases.
- Fourth-quarter digital sales remained high at ¥125.6 billion, or nearly 31% of the fiscal-year total.
- The second half of fiscal 2026 produced ¥252.1 billion in digital sales, equal to about 61.9% of annual digital revenue.
- Nintendo’s digital sales include downloadable packaged games, download-only titles, add-on content, and revenue from Nintendo Switch Online.
- Although digital revenue rose sharply, Nintendo continued to generate substantial physical sales through retail software, console bundles, and collector-focused releases.
Nintendo Best-Selling Games Statistics
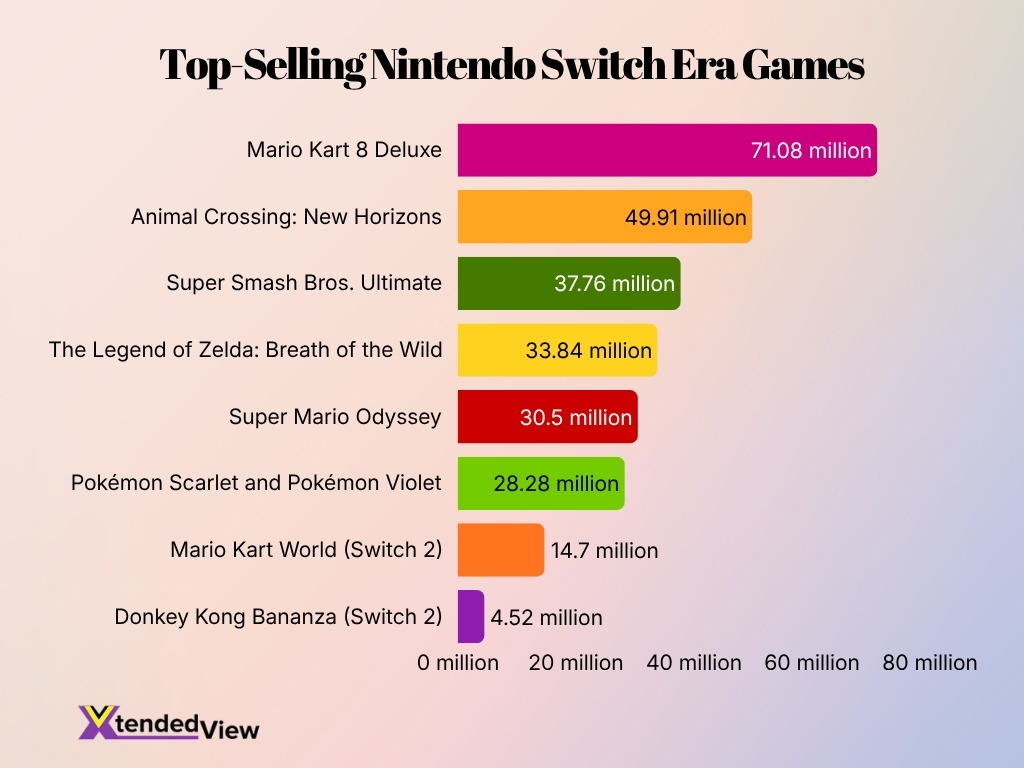
- Mario Kart 8 Deluxe remained Nintendo Switch’s best-selling game, with 71.08 million lifetime copies sold by March 31, 2026.
- Animal Crossing: New Horizons ranked second with 49.91 million copies, placing it nearly 21.2 million units behind Mario Kart 8 Deluxe.
- Super Smash Bros. Ultimate reached 37.76 million sales, making it the platform’s third-best-selling title.
- The Legend of Zelda: Breath of the Wild sold 33.84 million copies on Nintendo Switch alone.
- Super Mario Odyssey accumulated 30.50 million sales, becoming the highest-selling 3D Mario title on the platform.
- Pokémon Scarlet and Pokémon Violet reached 28.28 million combined copies, exceeding Pokémon Sword and Pokémon Shield’s 27.16 million.
- Mario Kart World led Nintendo Switch 2 software with 14.70 million copies sold during its first fiscal year, including bundled units.
- Donkey Kong Bananza sold 4.52 million copies by March 2026, making it the second-best-selling listed Switch 2 title.
- Pokémon Legends: Z-A – Nintendo Switch 2 Edition reached 3.94 million packaged sales by the end of fiscal 2026.
- Pokémon Pokopia sold 2.41 million copies, while Kirby Air Riders reached 1.87 million by March 31, 2026.
Nintendo Best-Selling Consoles Statistics
- Nintendo Switch became Nintendo’s best-selling hardware platform, reaching 155.92 million units by March 31, 2026.
- Nintendo DS ranked second with 154.02 million units, leaving it 1.90 million units behind Nintendo Switch.
- Wii sold 101.63 million systems, making it Nintendo’s third hardware family to surpass 100 million units.
- Game Boy and Game Boy Color generated 118.69 million combined sales, placing the hardware family among Nintendo’s largest historical platforms.
- Game Boy Advance reached 81.51 million units over its lifetime, despite remaining on the market for a shorter period than several other Nintendo systems.
- Nintendo 3DS sold 75.94 million units, or roughly half the lifetime volume of Nintendo DS.
- Nintendo Entertainment System reached 61.91 million units, helping establish Nintendo’s global home-console business.
- Super Nintendo Entertainment System sold 49.10 million units, approximately 12.8 million fewer than its predecessor.
- Nintendo 64 finished with 32.93 million units, while Nintendo GameCube reached 21.74 million.
- Nintendo Switch 2 had already shipped 19.86 million units by March 2026, surpassing Wii U’s lifetime total of 13.56 million within its first fiscal year.
Nintendo Regional Sales Statistics
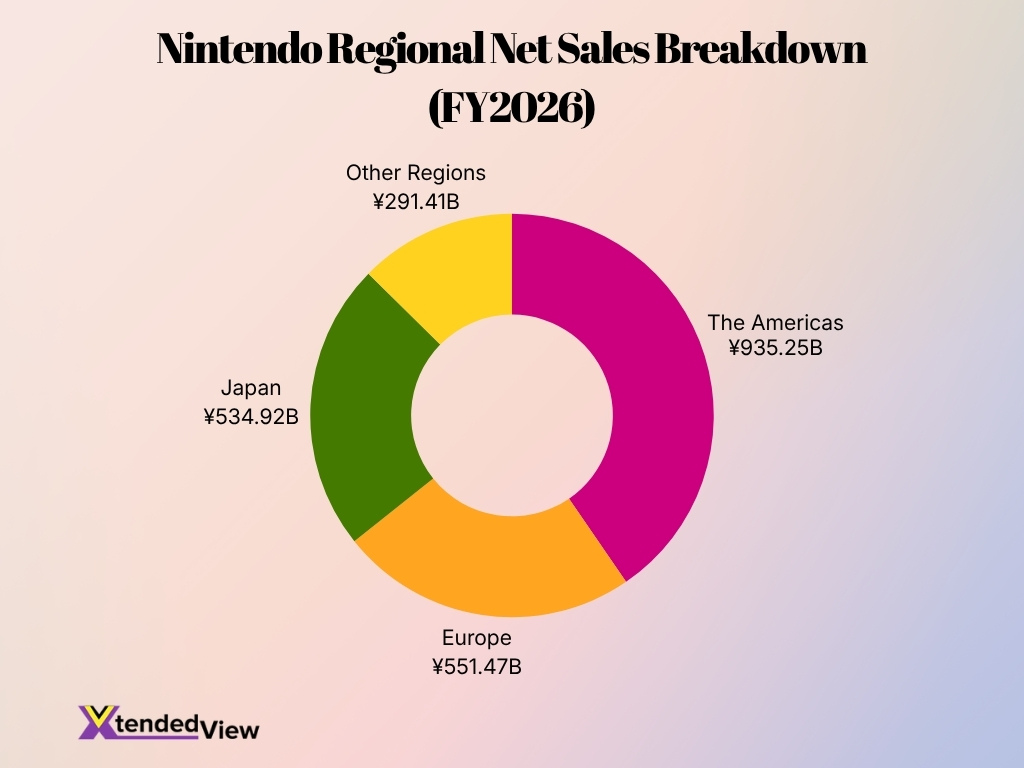
- Nintendo generated ¥2.313 trillion in worldwide net sales during fiscal 2026, up 98.6% from the prior year.
- Sales outside Japan reached ¥1.778 trillion, accounting for 76.9% of Nintendo’s annual net sales.
- The Americas remained Nintendo’s largest regional market, producing ¥935.25 billion in fiscal 2026 sales.
- Sales from U.S. customers totaled ¥790.11 billion, representing about 84.5% of revenue from the Americas.
- Europe generated ¥551.47 billion, equal to approximately 23.8% of Nintendo’s worldwide sales.
- Japan contributed ¥534.92 billion, or roughly 23.1% of consolidated net sales.
- Other regions produced ¥291.41 billion, more than triple the ¥89.17 billion recorded in fiscal 2025.
- Revenue from the Americas increased by 81.6% from ¥515.13 billion in fiscal 2025 to ¥935.25 billion in fiscal 2026.
- European revenue rose by approximately 93% year over year, while Japanese revenue increased by about 94.6%.
- Nintendo Switch 2 hardware shipments reached 13.17 million units in the Americas, 5.66 million in Europe, 4.40 million in Japan, and 3.06 million in other markets by March 2026.
Nintendo Research and Development Spending Statistics
- Nintendo spent ¥177.89 billion on research and development during fiscal 2026, equivalent to about $1.12 billion.
- Research and development spending rose 23.7% from ¥143.79 billion in fiscal 2025.
- The annual increase amounted to approximately ¥34.10 billion, reflecting investment in Switch 2, software, infrastructure, and future entertainment products.
- Research and development expenses represented about 7.7% of fiscal 2026 net sales, compared with roughly 12.3% in fiscal 2025 because revenue grew faster than development spending.
- Nintendo allocated an average of approximately ¥14.82 billion per month to research and development during fiscal 2026.
- The company’s development work covered hardware, software, semiconductor memory, displays, sensors, wireless communications, security, and cloud computing.
- Nintendo also researched virtual reality, augmented reality, mixed reality, deep learning, and large-scale data analysis.
- Software investment included game design, programming, graphics, music, scripts, online features, Nintendo eShop systems, and back-end infrastructure.
- Nintendo planned ¥58 billion in research and development facility investment from April 2025 through March 2028.
- The company funded its capital investments internally rather than relying on external financing, supporting long-term control over product development.
Frequently Asked Questions (FAQs)
Nintendo Switch 2 shipped 19.86 million units worldwide by March 31, 2026.
The original Nintendo Switch reached 155.92 million lifetime hardware units sold as of March 31, 2026.
Nintendo Switch software achieved 1.528 billion lifetime unit sales by March 31, 2026.
Up to 8 Nintendo Accounts can be linked to one Nintendo Switch or Nintendo Switch 2 console.
Nintendo forecasts selling 16.5 million Nintendo Switch 2 consoles during fiscal year 2027.
Conclusion
Nintendo delivered one of the strongest financial years in its history, driven by the successful launch of Nintendo Switch 2, continued demand for the original Switch, and strong first-party software sales. The company generated ¥2.313 trillion in net sales, expanded digital revenue to ¥407.6 billion, and increased research and development spending to support future hardware and software innovation. With more than 175 million combined Switch-family console shipments, over 400 million Nintendo Accounts, and a portfolio of globally recognized franchises, Nintendo remains one of the world’s leading video game companies and is well positioned for continued long-term growth.
