Mobile gaming continues to shape the global entertainment industry as smartphones become more powerful and internet access expands. Developers, advertisers, publishers, and investors rely on mobile gaming data to guide product launches, monetization strategies, and user acquisition campaigns. From casual puzzle games to competitive multiplayer titles, mobile games influence digital spending and consumer engagement across the US and worldwide. Explore the statistics below to understand how the mobile gaming market is evolving.
Editor’s Choice
- Mobile games generated approximately $113.3 billion in global revenue during 2025, representing 10.7% year-over-year growth, with forecasts pointing to continued expansion in 2026.
- Mobile gaming accounted for more than half of total global games revenue in 2025, remaining the industry’s largest gaming platform.
- The worldwide games industry surpassed $201.6 billion in total revenue during 2025, with mobile contributing the largest share.
- Around 52 billion game downloads occurred across mobile, PC, and console in 2025, while mobile remained responsible for the overwhelming majority of installs.
- Consumers downloaded roughly 95,000 mobile games every minute throughout 2025.
- Despite softer download growth, publishers increased revenue through stronger monetization, live operations, and direct-to-consumer sales.
- Analysts expect mobile gaming revenue to reach about $121.1 billion in 2026, supported by higher player spending rather than rapid download growth.
Recent Developments
- The global games market crossed the $200 billion milestone for the first time in 2025, driven largely by stronger-than-expected mobile and PC performance.
- Mobile game revenue grew 10.7% during 2025, outperforming earlier analyst expectations because of improved direct-to-consumer sales and stronger monetization.
- Analysts forecast 6.8% additional growth for mobile gaming revenue in 2026, reaching approximately $121.1 billion globally.
- Direct-to-consumer payment channels expanded rapidly, with annualized transaction volume reaching $1 billion by early 2026 for one leading payment platform serving game publishers.
- Mobile game acquisition costs increased significantly, with the average global cost per install rising 30% year over year during 2025.
- Publishers increasingly focused on live-service updates instead of launching entirely new franchises, aiming to improve long-term player retention.
- Strategy games emerged as one of the fastest-growing genres in revenue and engagement during 2025, led by successful live-service titles.
- AI-assisted development tools and creative automation gained wider adoption among mobile studios, helping reduce production time and optimize player acquisition campaigns.
Mobile Games Market Overview
- Mobile gaming remains the largest segment of the global gaming industry by revenue, ahead of both PC and console.
- The mobile games market generated approximately $113.3 billion during 2025.
- Industry forecasts estimate mobile gaming revenue will exceed $121 billion in 2026.
- Mobile represented roughly 56% of total global gaming revenue in 2025, reinforcing its position as the industry’s primary growth engine.
- Download volumes softened in 2025, yet publishers continued growing revenue through stronger player spending and live-event strategies.
- Hybrid monetization models combining advertising with in-app purchases became increasingly common across casual and hybrid-casual games.
- Chinese publishers continued leading several high-growth genres, including merge and 4X strategy games, while expanding internationally.
- Developers invested more heavily in player retention, seasonal events, and community engagement rather than relying solely on acquiring new users.
Mobile Game Revenue Growth Statistics
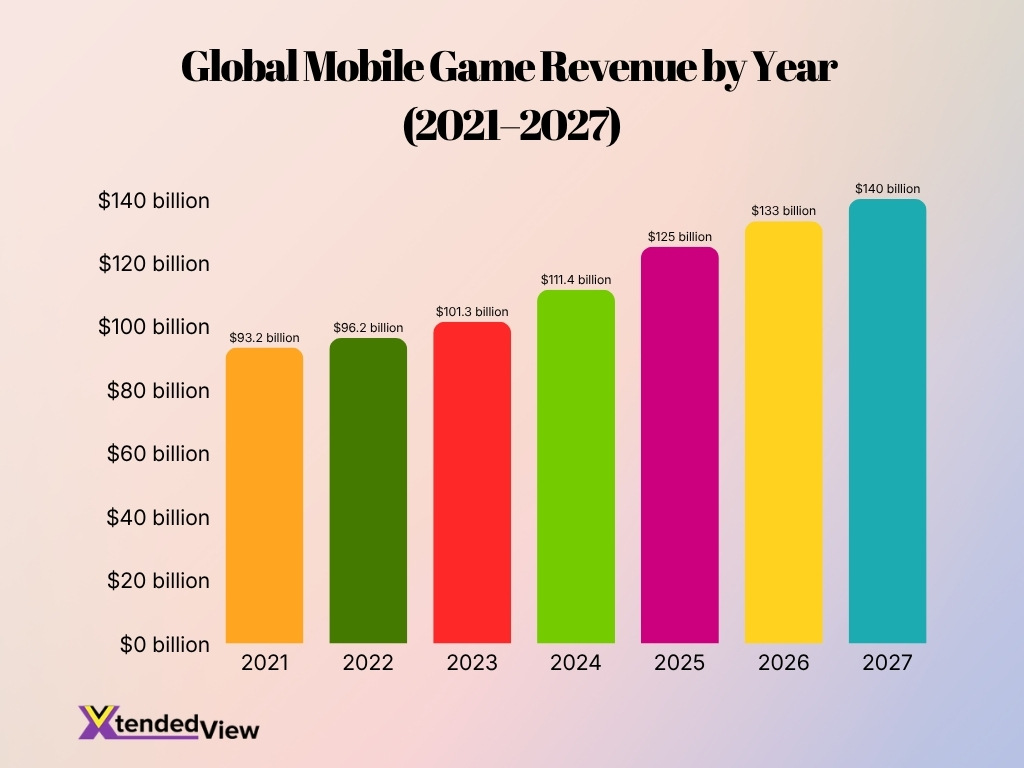
- Global mobile game revenue increased from $93.2 billion in 2021 to more than $125 billion in 2025.
- The market added approximately $32 billion in annual revenue between 2021 and 2025.
- Mobile game revenue grew by 3.2% from $93.2 billion in 2021 to $96.2 billion in 2022.
- Revenue surpassed $100 billion in 2023, reaching approximately $101.3 billion.
- The industry recorded stronger growth in 2024, with revenue rising to $111.4 billion.
- Revenue increased by more than $13.6 billion between 2024 and 2025, marking the largest annual gain in the dataset.
- Global mobile game revenue is projected to reach $133 billion in 2026.
- By 2027, the market is expected to generate approximately $140 billion in annual revenue.
- The projected increase from 2025 to 2027 is approximately $15 billion, based on the reported 2025 estimate.
- Overall, mobile game revenue is expected to grow by roughly 50% between 2021 and 2027.
Mobile Game Downloads Statistics
- Mobile games accounted for the overwhelming majority of the 52 billion game downloads recorded across all gaming platforms in 2025.
- Consumers downloaded approximately 95,000 mobile games every minute during 2025.
- Global mobile game downloads declined for a second consecutive year, reflecting a more mature marketplace rather than weakening player demand.
- Download growth slowed while player spending continued increasing, showing publishers generated greater value from existing audiences.
- Google Play continued contributing a larger share of worldwide downloads than Apple’s App Store because of Android’s broader global footprint.
- Casual, puzzle, and hybrid-casual games remained among the most frequently downloaded categories worldwide.
- User acquisition became more expensive as organic discovery declined and paid installs represented a larger portion of new downloads.
- Developers increasingly optimized app store listings, live events, and influencer campaigns to improve download conversion rates.
Top Mobile Games by Downloads
- Block Blast! ranked among the world’s most downloaded mobile games during 2025 with roughly 368 million downloads.
- Roblox recorded approximately 295 million downloads globally during 2025.
- Free Fire attracted roughly 287 million downloads, maintaining strong popularity across emerging markets.
- Subway Surfers remained one of the most downloaded mobile games with more than 190 million installs during 2025.
- Pizza Ready! surpassed 166 million downloads, reflecting continued demand for idle simulation games.
- Ludo King exceeded 150 million downloads, supported by strong engagement across South Asia.
- Vita Mahjong recorded more than 125 million downloads, highlighting sustained interest in casual puzzle titles.
- PUBG MOBILE remained among the global download leaders with over 115 million installs during 2025.
Top Mobile Games by Revenue
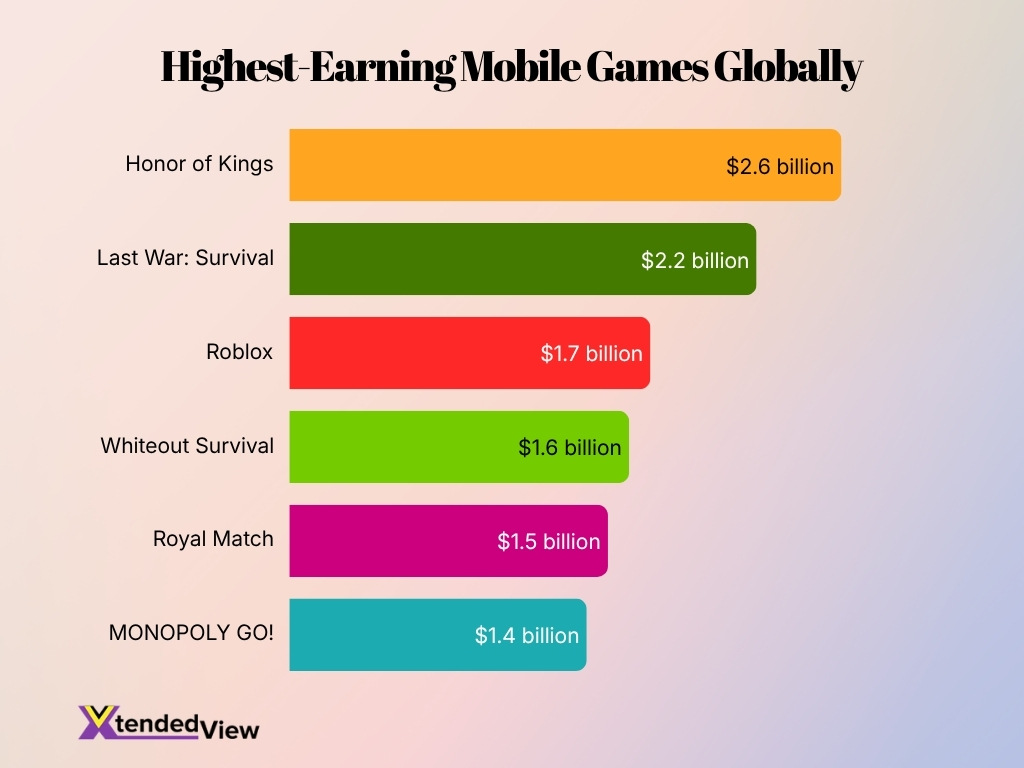
- Honor of Kings led worldwide mobile game spending in 2025, generating about $2.6 billion in estimated in-app purchase revenue.
- Last War: Survival earned roughly $2.2 billion in 2025, placing it close to the top of the annual rankings after rapid growth in the strategy category.
- Roblox generated approximately $1.7 billion in mobile in-app purchase revenue during 2025.
- Whiteout Survival produced about $1.6 billion in annual mobile spending, showing the continued revenue strength of survival-themed 4X strategy games.
- Royal Match collected approximately $1.5 billion from players in 2025, keeping it among the highest-earning puzzle games worldwide.
- MONOPOLY GO! generated roughly $1.4 billion during the year, supported by recurring events, collectible albums and social competition mechanics.
- PUBG MOBILE remained a billion-dollar mobile title in 2025, even though estimates exclude spending from several third-party Android channels.
- Eight mobile games surpassed $1 billion in annual in-app purchase revenue in 2025, setting a new high for the number of billion-dollar titles in one year.
- Together, the leading titles show that strategy, multiplayer platforms and puzzle games now occupy most positions at the top of the mobile revenue rankings.
Mobile Gaming User Base
- The worldwide mobile games market is projected to reach approximately 2.5 billion users by 2030, indicating that mobile will remain the most accessible gaming platform through the decade.
- Global mobile game user penetration is expected to reach about 27.6% in 2026, equal to more than one in four people worldwide.
- The broader global gaming audience exceeds 3.3 billion players, and smartphones give much of this audience a low-cost way to access games.
- In the US, 212.3 million people ages 5 to 90 played video games for at least one hour per week in 2026. That represented about 67% of the population within the surveyed age range.
- The 2026 US player population increased by approximately 7.2 million people, or 3%, compared with 2025.
- More than 80% of Gen Alpha and Gen Z consumers in the US played video games weekly in 2026, providing a large addressable audience for mobile-first titles.
- Weekly participation reached 71% among millennials, making adults ages 30 to 45 a core gaming audience rather than a secondary segment.
- Gaming also reached 56% of Gen X, 50% of baby boomers, and 32% of adults ages 81 to 90 in the US, showing that the potential mobile audience spans several generations.
- As smartphone ownership grows, publishers can reach users who do not own a console or gaming PC, particularly in markets where mobile devices serve as the primary internet connection.
Mobile Gamer Demographics
- The 2026 US gaming population had a nearly even gender distribution, with approximately 53% men and 46% women reporting weekly play.
- A 2025 international survey also found a balanced audience, with 48% women and 51% men among respondents who played video games.
- Players ages 18 to 24 represented about 38% of mobile gamers in one cross-market demographic analysis, making young adults the largest mobile age segment.
- More than 80% of US consumers ages 5 to 29 played games weekly in 2026, illustrating the high reach of gaming among children, teenagers and young adults.
- 75% of US parents played video games weekly in 2026, while 81% reported playing games with their children.
- Among gaming parents, 52% played with their children at least once per week, creating demand for family-friendly and shared mobile experiences.
- Spending on in-game content remained common among younger Americans; 69% of Gen Alpha, 78% of Gen Z, and 67% of millennials reported making such purchases.
- 54% of gaming parents purchased in-game content for their children, although many required approval before completing a transaction.
- Globally, 66% of players cited fun as a main reason for gaming, while 58% used games for relaxation or stress relief. These motivations support casual mobile play throughout the day.
- A study involving 32 blind or low-vision mobile gamers found that participants played to relieve boredom, experience achievement, and maintain social connections, highlighting the value of accessible mobile design.
Mobile Gamer Demographics by Age Group
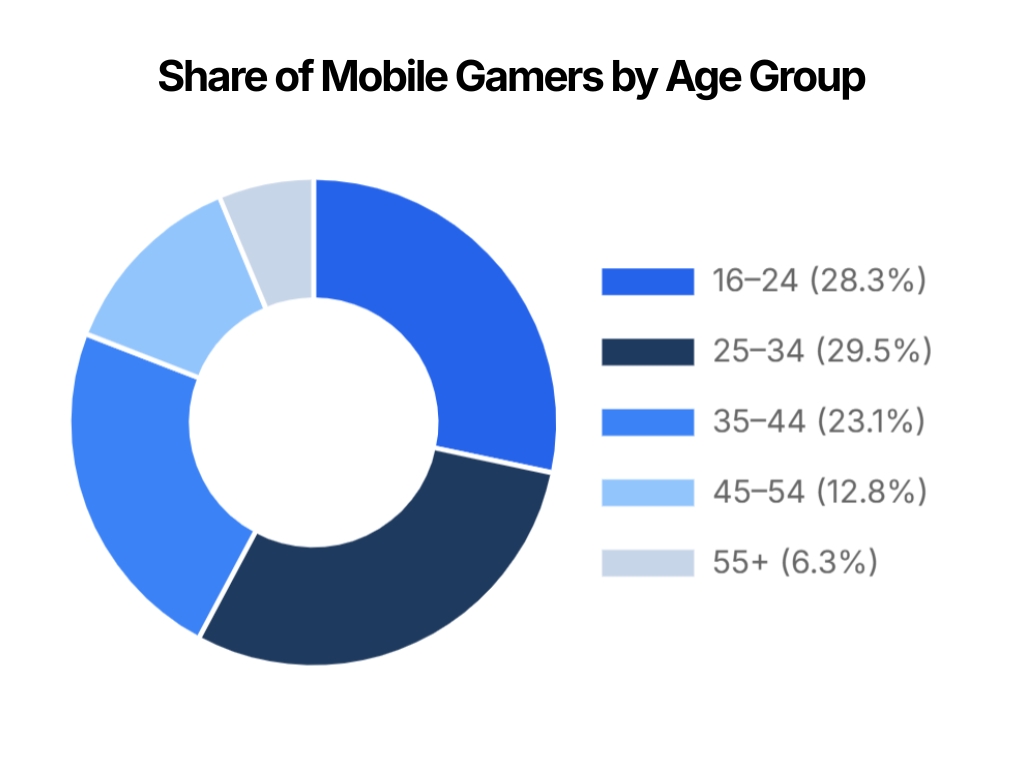
- Adults aged 25–34 form the largest mobile gaming segment, representing 29.5% of all mobile gamers.
- The 16–24 age group follows closely with a 28.3% share, highlighting the strong popularity of mobile games among younger users.
- Gamers aged 35–44 account for 23.1% of the audience, showing that mobile gaming remains highly popular among mature adults.
- Together, people aged 16–34 represent 57.8% of mobile gamers, making younger adults the industry’s most important demographic group.
- When users aged 35–44 are included, the combined 16–44 audience reaches 80.9% of the total mobile gaming population.
- Adults aged 45–54 make up 12.8% of mobile gamers, indicating that mobile gaming appeals well beyond younger generations.
- Players aged 55 and older represent the smallest segment at 6.3%, but they still provide a notable audience for accessible and casual games.
- Overall, the figures show that mobile gaming has a broad demographic reach, although demand is heavily concentrated among users aged 16–44.
Mobile Gaming App Store vs Google Play
- Google Play generated 81% of worldwide mobile game downloads in 2025, reflecting Android’s large device base across emerging and mature markets.
- Apple’s App Store accounted for approximately 15% of game downloads, while alternative stores and other channels supplied the remaining share.
- Therefore, Google Play produced more than five times as many mobile game downloads as the App Store during 2025.
- Despite its smaller download share, the App Store generated about $52.5 billion in mobile game revenue in 2025, exceeding the combined gaming revenue attributed to Google Play and a major PC storefront.
- Across all app categories, App Store consumer spending reached approximately $117 billion in 2025, compared with $49 billion on Google Play.
- The App Store therefore generated about 2.4 times more consumer revenue than Google Play across apps, even though Google Play led downloads by a wide margin.
- Free-to-play games represented 96% of mobile game downloads across stores in 2025, confirming that most publishers monetize after installation rather than charging an upfront price.
- On Google Play, free-to-play titles accounted for 99% of game downloads, leaving paid downloads with only a small share of Android installs.
- The platform split gives publishers two distinct priorities: Android offers broader download scale, while iOS users generally produce more revenue per installation.
Mobile Game Genres Statistics
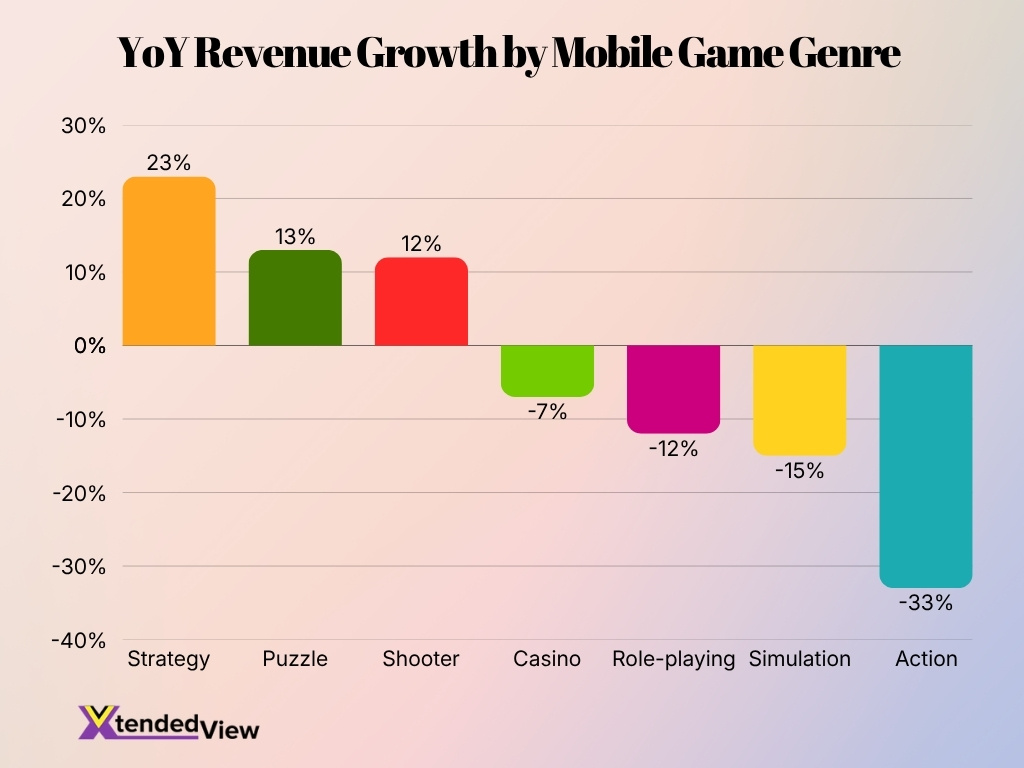
- Strategy games recorded the strongest revenue momentum in the second quarter of 2025, with in-app purchase revenue increasing 23% year over year.
- Puzzle game revenue rose 13% during the same period, supported by established titles and newer sorting, block, and screw-puzzle formats.
- Shooter games increased their mobile in-app purchase revenue by 12% year over year, showing continued demand for competitive multiplayer play.
- In contrast, role-playing game revenue fell 12%, indicating stronger competition for players in a genre that traditionally depends on high-value spenders.
- Casino game revenue decreased 7%, although the category continued to generate recurring income through slots, card and social casino mechanics.
- Simulation game revenue declined 15%, despite simulation titles remaining among the leading categories for overall download volume.
- Action games posted the steepest measured decline, with revenue falling 33% year over year during the second quarter of 2025.
- Puzzle games led global download activity, while puzzle and simulation titles together supplied a large share of high-volume casual installs.
- Strategy and role-playing games continued to produce a disproportionately large share of revenue compared with their download totals because of deeper progression systems and higher payer spending.
- Match games achieved an average 6.6% day-30 retention rate in a 2025 loyalty analysis, the highest result among the measured genres.
Mobile Gaming Engagement Statistics
- Players downloaded more than 95,000 mobile games per minute in 2025, demonstrating the continuing scale of global game discovery despite an annual decline in total installs.
- Mobile games produced approximately 50.4 billion downloads during 2025, equal to about 138 million installations per day.
- Total downloads decreased 7.2% year over year, suggesting that publishers increasingly depend on engagement and monetization from existing users.
- Mobile game in-app purchase revenue still grew about 1.3% to 1.4% in 2025, even as installation volume declined.
- Average in-app purchase revenue reached approximately $1.62 per download, showing that each acquired user carried greater revenue potential than raw download totals alone suggest.
- Match games recorded the second-highest average number of sessions per user in a 2025 genre analysis, alongside the highest measured day-30 retention.
- In a global player survey, 58% of respondents said they played games for relaxation or stress relief, a motivation that supports frequent, short mobile sessions.
- 66% of global respondents played primarily to have fun, while 45% also identified another social or personal benefit from gaming.
- US parents formed a highly engaged group in 2026; 75% played weekly, and 81% played with their children, creating repeated opportunities for co-play and shared content.
Mobile Game Monetization Statistics
- Mobile games generated $81.75 billion from in-app purchases in 2025, up about 1.3% from the previous year.
- Advertising added more than $12 billion to mobile game revenue in 2025, bringing combined in-app purchase and advertising income to nearly $94 billion.
- In-app purchases contributed approximately 87% of measured mobile game revenue in 2025, while advertising supplied the remaining 13%.
- Games that used advertising generated about 30% of their revenue from ads on average, although the share varied considerably by genre and platform.
- The percentage of mobile games using advertising rose from 45.1% in July 2021 to 55.6% in May 2026.
- Only 1.83% of mobile gamers made an in-app purchase in one large monetization analysis, showing why publishers often combine purchases with advertising.
- Among players who completed an initial purchase, just 28.81% purchased again, making repeat-payer conversion a key revenue challenge.
- Free-to-play games represented 96% of mobile game downloads in 2025, confirming that most publishers monetize after installation rather than charging an upfront price.
- Direct-to-consumer stores gained momentum in 2025 and 2026 as publishers sought to lower payment fees, strengthen customer relationships and retain a larger share of each transaction.
- Hybrid monetization continued to expand because it lets nonpaying users generate advertising revenue while preserving in-app purchase options for higher-value players.
Mobile Game Retention Rates
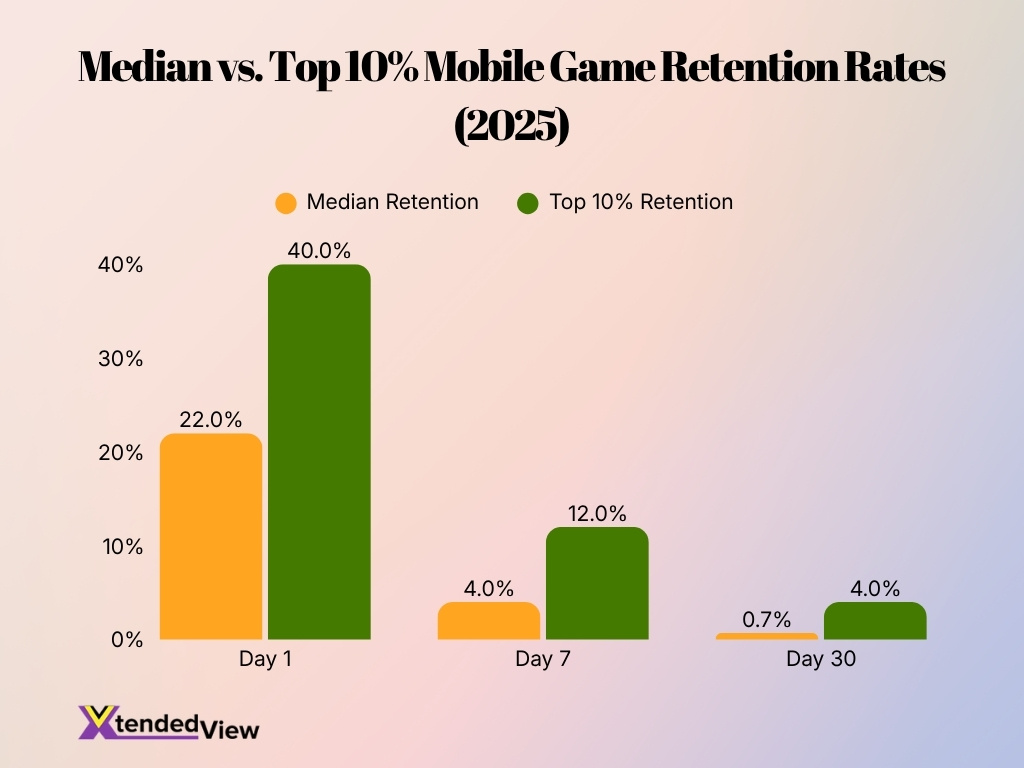
- Median global day-one retention fell to about 22% in 2025, meaning close to four in five newly acquired players did not return the following day.
- The top 10% of mobile games achieved nearly 40% day-one retention, almost twice the global median.
- Median day-seven retention reached roughly 4%, illustrating how sharply mobile audiences contract during the first week.
- Leading games retained approximately 12% of users on day seven, or about three times the median benchmark.
- Median day-30 retention stood near 0.7%, equal to about seven returning players for every 1,000 original installs.
- Top-decile games reached approximately 4% day-30 retention, retaining almost six times the median share of new users.
- Match games produced an average 6.6% day-30 retention rate across measured platforms, outperforming the broader market benchmark.
- Day-one, day-seven and day-30 median retention all declined during 2025, widening the performance gap between average releases and category leaders.
- Early behavior provides meaningful retention signals; research shows that activity during a player’s first session, first day and first week can help predict whether that user will continue playing.
- Because global installs fell while revenue increased in 2025, stronger retention became more valuable for publishers facing higher acquisition costs and fewer new downloads.
In-App Purchase Statistics
- Mobile game in-app purchase revenue reached approximately $81.75 billion in 2025, compared with about $80.7 billion in 2024.
- The market recorded its third consecutive year of revenue growth across the two leading app stores in 2025, even as worldwide game downloads declined.
- Gaming represented an estimated 53.7% of global in-app purchase revenue in 2025, although spending on subscriptions and generative AI apps continued to narrow the gap.
- Average mobile game in-app purchase revenue equaled approximately $1.62 per download in 2025. The measure compares total store revenue with annual installation volume rather than actual payer spending.
- In March 2025 alone, players spent roughly $6.79 billion through the two largest mobile app stores worldwide.
- Japan contributed about 14.3% of global mobile store spending in March 2025, despite representing a much smaller portion of the world’s population.
- In a 2025 survey of 1,000 Japanese adults ages 20 to 29, almost 19% said in-game spending had interfered with essential expenses such as food or rent.
- The same survey found a gender difference: 22.8% of men and 14.8% of women reported that game purchases had affected their ability to cover essential costs.
- More than two-thirds of younger US players reported buying in-game content in 2026, including 69% of Gen Alpha, 78% of Gen Z and 67% of millennials.
- Successful games increasingly use subscriptions, battle passes, limited-time bundles, collectible systems and direct web payments to spread revenue across several purchase types.
Mobile Game Advertising Statistics
- Advertising within mobile games generated more than $12 billion in 2025, providing a significant revenue stream beyond player purchases.
- Players received approximately 2.4 trillion mobile game ad impressions during 2025, equal to more than 6.5 billion impressions per day.
- Games containing advertising generated 24.6 billion downloads in 2025, or nearly half of all mobile game installations.
- January recorded about 2.33 billion downloads of ad-supported mobile games, the highest monthly total of 2025.
- Advertising revenue from gaming apps grew 7% year over year in 2024, providing the base for further monetization growth during 2025 and 2026.
- The US generated 56% of worldwide iOS mobile game ad revenue in the first quarter of 2026, down from 59% in the fourth quarter of 2025.
- Japan’s share of iOS mobile game ad revenue increased from 9% to 11% between the fourth quarter of 2025 and the first quarter of 2026.
- Average mobile game acquisition costs reached about $4.22 per iOS install and $2.97 per Android install in 2026.
- Casual games recorded an average $0.77 cost per install, giving advertisers a lower entry cost than many strategy, role-playing and casino campaigns.
- One large-scale experiment found that every $100 in mobile advertising generated 37 paid installs and three additional organic installs, making advertising about 7.5% more effective than paid-install metrics alone indicated.
Mobile Game Revenue Statistics by Country
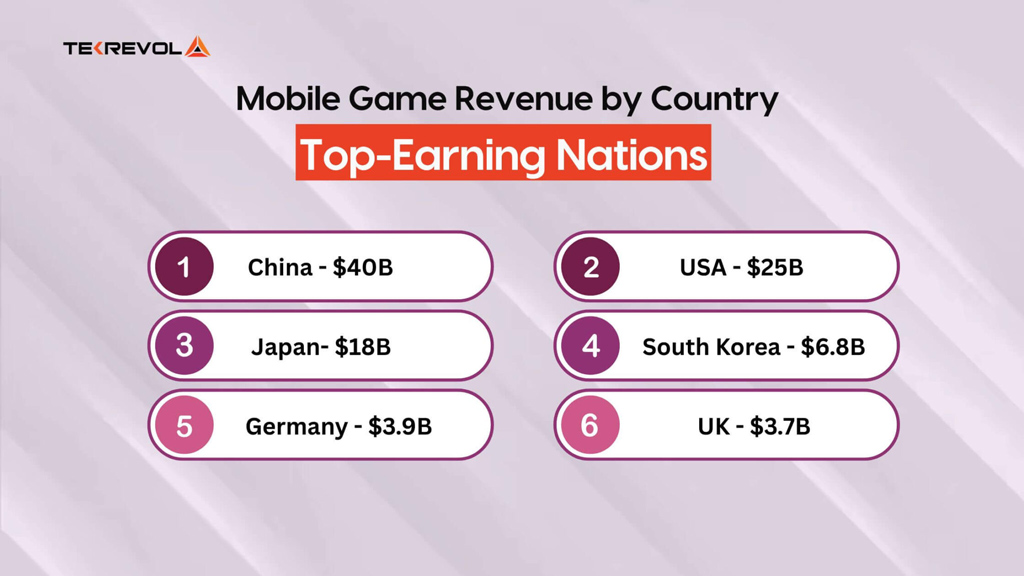
- China leads the global mobile gaming market with approximately $40 billion in revenue.
- The United States ranks second, generating around $25 billion from mobile games.
- Japan holds third place with mobile game revenue of nearly $18 billion.
- China earns $15 billion more than the United States and over twice as much as Japan.
- South Korea ranks fourth with $6.8 billion, significantly below the top three markets.
- Germany generates approximately $3.9 billion, making it Europe’s highest-earning country in the chart.
- The United Kingdom follows closely with $3.7 billion, only $200 million less than Germany.
- The six listed countries collectively generate around $97.4 billion in mobile game revenue.
- The top three markets, China, the United States, and Japan, account for approximately 85.2% of the combined revenue shown.
Mobile Gaming Growth Trends
- Global mobile game revenue reached $113.3 billion in 2025, following stronger-than-expected spending and direct-to-consumer sales.
- Mobile gaming revenue is forecast to rise 6.8% to $121.1 billion in 2026.
- Mobile accounted for more than half of global games revenue in 2025 and remained larger than the PC and console segments individually.
- The global mobile audience included approximately 3 billion players in 2025, equal to 83% of the wider gaming population.
- Worldwide mobile game downloads fell in 2025, while time spent increased slightly, showing a shift from installation growth toward deeper engagement and higher lifetime value.
- Mobile game in-app purchase revenue increased for a third straight year in 2025, despite market saturation and higher user acquisition costs.
- The broader games market is projected to reach $206.5 billion by 2028, with mobile expected to retain the largest platform share.
- The worldwide gaming audience could approach 3.9 billion people by 2028, although the percentage of internet users who play games is beginning to stabilize.
- Advertising adoption increased to 55.6% of mobile games by May 2026, signaling continued growth in hybrid monetization.
- Through 2026, publishers will focus more heavily on live operations, established intellectual property, cross-platform access, direct payments, and retention rather than relying on download volume alone.
Frequently Asked Questions (FAQs)
The global mobile gaming market is forecast to generate approximately $121.1 billion in revenue in 2026.
The global mobile gaming market is projected to grow by about 6.8% in 2026 compared with 2025.
The global mobile gaming market is expected to reach a user penetration rate of approximately 27.6% in 2026, representing over 2 billion users worldwide.
Mobile gaming is projected to contribute more than 55% of total global games revenue in 2026, maintaining its position as the largest gaming platform.
The global mobile gaming market is projected to reach approximately $160.9 billion by 2030, growing at a compound annual growth rate (CAGR) of about 7% from 2026 onward.
Conclusion
Mobile gaming continues to grow and remains the biggest part of the gaming industry. Although game downloads have slowed, players are spending more time and money on their favorite games through in-app purchases, subscriptions, and ads. The US and China are still the largest markets, while regions like Southeast Asia, Latin America, and the Middle East are growing quickly. As developers focus on better player experiences and long-term engagement, the mobile gaming market is expected to keep expanding in the coming years.