



Mobile advertising continues to shape how brands connect with consumers across smartphones, tablets, and connected mobile experiences. Retailers rely on mobile campaigns to drive online purchases, while streaming platforms, gaming companies, and financial services use mobile ads to increase app installs and customer engagement. As advertisers shift more budgets toward mobile-first strategies and AI-powered campaign optimization, understanding the latest statistics becomes essential. Explore the data below to see how the mobile advertising market is evolving.
Editor’s Choice
- Global mobile advertising spending is projected to reach nearly $500 billion in 2026, continuing its steady upward trajectory from 2025.
- The U.S. remains the largest mobile advertising market worldwide by total ad spending.
- Mobile continues to account for the majority of digital advertising investment across most major markets.
- The U.S. digital advertising industry generated $294.6 billion in revenue during 2025, representing 13.9% year-over-year growth. Mobile advertising remained one of the largest contributors to this expansion.
- AI-powered campaign automation has become a major factor behind increased advertiser spending and improved campaign efficiency in 2026.
- Mobile video, social media, commerce media, and search continue to capture the largest share of mobile advertising budgets worldwide.
- Industry forecasts indicate that global mobile advertising will maintain strong growth through 2030, supported by rising smartphone usage and expanding digital commerce.
- Major technology platforms are expected to account for the majority of worldwide digital advertising revenue in 2026, with mobile inventory driving much of that growth.
Recent Developments
- In 2026, industry analysts expect overall U.S. advertising spending to grow 9.5%, reflecting stronger investment in digital and mobile channels.
- AI has become one of the highest investment priorities for advertisers, influencing campaign planning, creative production, targeting, and optimization.
- Digital advertising revenue reached a record $294.6 billion in the U.S. during 2025 despite the absence of major election or Olympic advertising cycles.
- Video advertising continues to outpace many traditional digital formats as advertisers prioritize short-form and mobile-first content.
- Commerce media has emerged as one of the fastest-growing advertising categories, attracting larger portions of retail media budgets.
- Advertisers increasingly automate campaign management using AI-based optimization tools that improve return on ad spend.
- Social media platforms continue expanding monetization through new ad placements across messaging apps and short-video experiences.
- Industry forecasts suggest that the three largest digital advertising companies will represent more than 62% of global digital advertising spending in 2026.
Mobile Advertising Market Growth
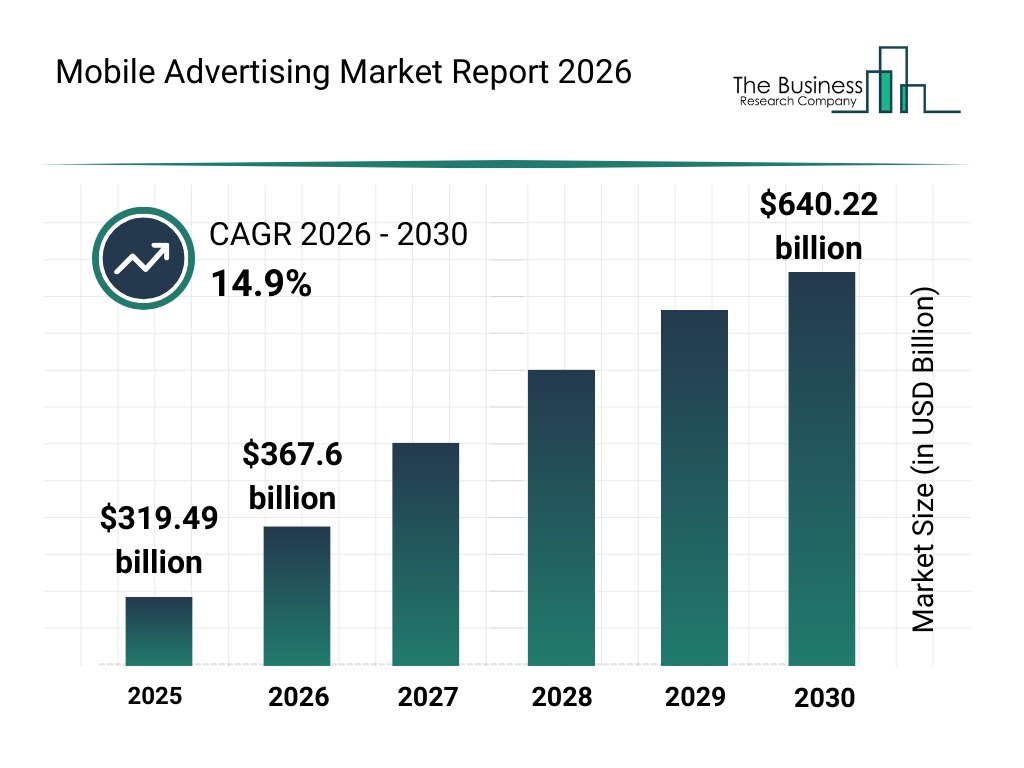
- The global mobile advertising market was valued at $319.49 billion in 2025.
- The market is expected to reach $367.60 billion in 2026, representing an annual increase of about 15.1%.
- Mobile advertising revenue is projected to rise to approximately $422.29 billion in 2027.
- By 2028, the market could expand further to nearly $485.12 billion.
- The industry is forecast to surpass $557.30 billion in 2029 as mobile ad adoption continues to accelerate.
- Mobile advertising market size is projected to reach $640.22 billion by 2030.
- Between 2026 and 2030, the market is expected to grow at a 14.9% CAGR.
- The market is forecast to add approximately $272.62 billion in value from 2026 to 2030.
- Compared with 2025, the mobile advertising market is expected to more than double by 2030.
- The figures indicate sustained demand for mobile search, social media, video, and in-app advertising worldwide.
Mobile Advertising Growth Trends
- The global mobile advertising market is projected to reach $322.67 billion in 2026, demonstrating strong sustained momentum.
- Global mobile ad spend will capture 74% of total worldwide digital advertising investment while exceeding $430 billion by 2026.
- The industry is expected to maintain an impressive 18.60% compound annual growth rate from 2026 through 2034.
- North America maintained market dominance by securing a substantial 33.20% revenue share of all global mobile advertising.
- Short-form video advertising continues its rapid expansion with an expected 11.8% annual growth rate driven by high user engagement.
- Advertisers are heavily leveraging the search format type, which is anticipated to capture 36.95% of the market in 2026.
- Mobile commerce currently accounts for 75% of eCommerce traffic but only 61% of total revenue, highlighting a major conversion opportunity.
- The media and entertainment segment is forecast to contribute 21.04% of global advertising revenue throughout 2026.
- The Asia Pacific market is projected to grow to $95.99 billion in 2026, establishing itself as the fastest-growing global region.
Mobile Advertising Revenue
- U.S. internet advertising revenue reached a record-breaking $294.6 billion in 2025.
- Total digital advertising revenue experienced a 13.9% year-over-year increase between 2024 and 2025.
- Mobile advertising expanded its dominance by capturing 66.77% of the total digital marketing share in 2025.
- Video advertising climbed to roughly $78 billion in 2025, representing a massive 25.4% revenue increase.
- Social media advertising surged by 32.6% to generate $117.7 billion in revenue driven by mobile-first platforms.
- Global in-app ad spend remained a dominant force and was projected to reach about $390 billion in 2025.
- Retail media and commerce advertising grew to account for 20% of all digital spending, reaching a $200 billion market size by 2025.
- Leading tech giants continue to dominate mobile inventory, capturing 94.35% of the global mobile search market in late 2025.
- The mobile messaging industry reached a valuation of $136.2 billion in 2025 with an expected compound annual growth rate of 15.9%.
Mobile Ad Budget Breakdown
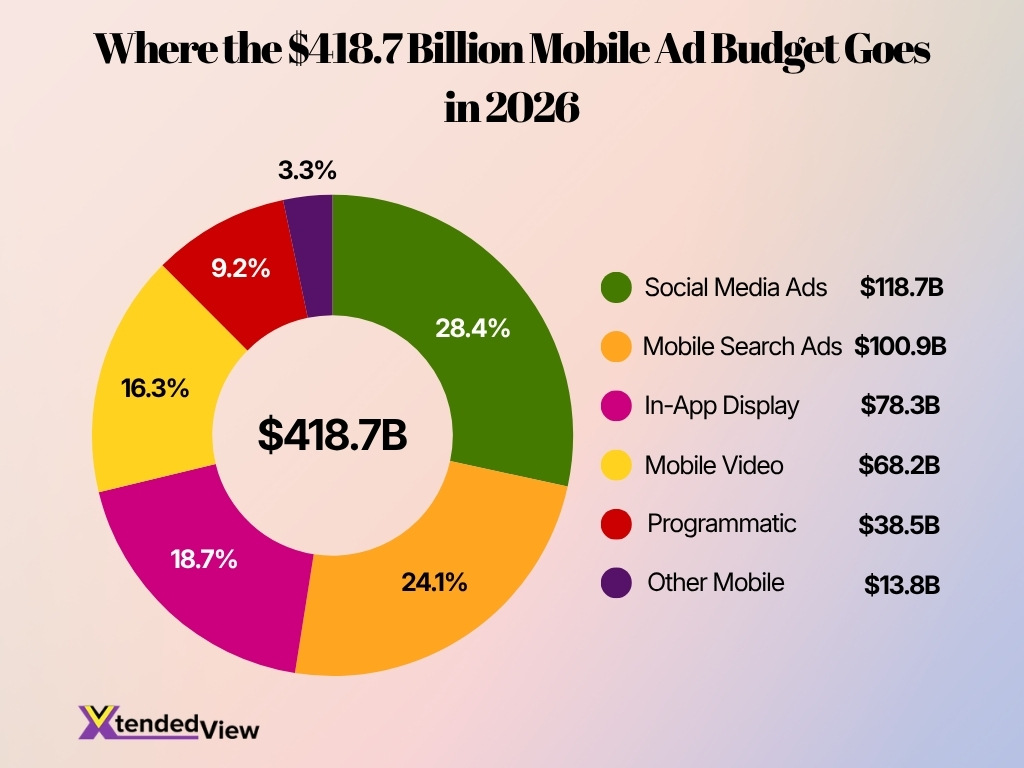
- Global mobile advertising spending is projected to reach $418.7 billion in the first half of 2026.
- Social media ads receive the largest allocation at $118.7 billion, representing 28.4% of total mobile ad spending.
- Mobile search ads rank second with $100.9 billion, accounting for 24.1% of the overall budget.
- Together, social media and mobile search capture 52.5% of total mobile advertising expenditure.
- In-app display advertising attracts $78.3 billion, equal to 18.7% of the mobile ad market.
- Mobile video advertising accounts for $68.2 billion, or 16.3% of total spending.
- In-app display and mobile video collectively represent 35% of the global mobile advertising budget.
- Programmatic mobile advertising receives $38.5 billion, contributing 9.2% of total expenditure.
- Other mobile advertising formats account for the smallest share at $13.8 billion, or 3.3%.
- The top four formats collectively command 87.5% of the total mobile ad budget, highlighting strong market concentration.
Mobile Advertising Market Share
- Mobile advertising represents about 68% of U.S. digital ad spending, showing that smartphones now receive more ad investment than desktop-first channels.
- Mobile devices account for roughly 96% of U.S. digital display spending, reflecting the shift toward app, social, video, and mobile web inventory.
- North America held 33.2% of the global mobile advertising market in 2025, supported by high smartphone adoption and large digital media budgets.
- Asia-Pacific accounted for an estimated 35% of global mobile advertising revenue in 2025, giving it the largest regional share under one market assessment.
- Social media represented about 31% of the mobile advertising market in 2025, making it the largest format segment in that analysis.
- Digital channels are forecast to capture 68.7% of total global advertising expenditure in 2026, up as mobile-first placements take a greater share of campaign budgets.
- Digital advertising held 46% of India’s total advertising expenditure in fiscal 2025, illustrating how mobile-led markets continue to narrow the spending gap with the U.S.
- Three major advertising groups are projected to control 62.3% of global digital ad spending in 2026, compared with 59.9% one year earlier. Much of their reach comes from mobile search, commerce and social inventory.
Mobile Advertising Formats
- The main mobile ad formats include banners, native placements, interstitials, in-stream video, rewarded video and playable ads. Each format supports a different stage of the customer journey.
- Banner ads generated an average mobile eCPM of approximately $2.80 in 2024, making them one of the lowest-cost formats for broad reach.
- Native mobile ads produced an average eCPM of about $3.30, reflecting their closer fit with surrounding app content.
- Interstitial ads recorded an average eCPM near $4.80, placing them above banners and native units because they occupy the full screen.
- In-stream mobile video ads generated an estimated average eCPM of $6.50, more than twice the benchmark reported for banners.
- Rewarded video delivered an average eCPM of approximately $10.50, the highest figure among the five major mobile formats in the comparison.
- Interstitial ads commonly achieve click-through rates between 2% and 5%, although placement quality and accidental taps can materially affect the result.
- Interstitial campaigns have produced about 20% more mobile installs than other ad formats in some performance comparisons.
Mobile Advertising Statistics by Country
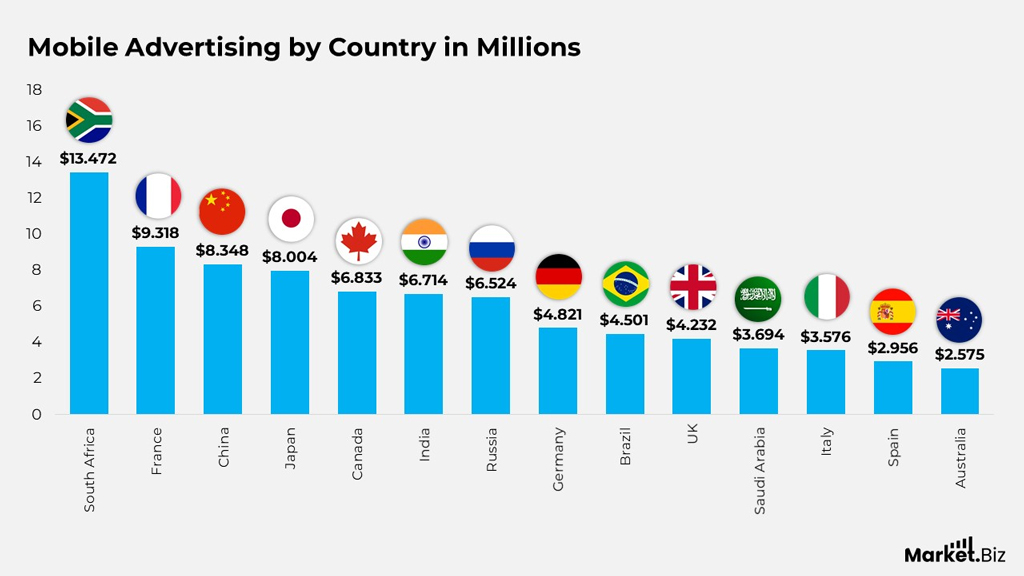
- South Africa leads the ranking with $13.472 million in mobile advertising, significantly ahead of every other country shown.
- France ranks second at $9.318 million, approximately $4.154 million below South Africa.
- China records $8.348 million, making it the third-largest mobile advertising market in the chart.
- Japan follows closely with $8.004 million, trailing China by only $344,000.
- Canada, India, and Russia form a tightly grouped segment, with values of $6.833 million, $6.714 million, and $6.524 million, respectively.
- Germany reaches $4.821 million, placing it ahead of Brazil and the United Kingdom.
- Brazil accounts for $4.501 million, while the United Kingdom records $4.232 million.
- Saudi Arabia and Italy report similar mobile advertising values at $3.694 million and $3.576 million, respectively.
- Spain generates $2.956 million, making it the second-smallest market among the countries listed.
- Australia records the lowest value at $2.575 million, nearly 81% lower than South Africa.
- The combined mobile advertising value across all 14 countries is approximately $91.568 million.
- The top four markets, South Africa, France, China, and Japan, collectively contribute about $39.142 million, or roughly 42.7% of the total shown.
Mobile Video Ad Statistics
- U.S. digital video advertising spending increased 18% in 2024, reaching approximately $64 billion.
- U.S. digital video spending was projected to rise to $72 billion in 2025, an increase of roughly $8 billion from the previous year.
- Digital video spending grew about two to three times faster than total media spending in the 2025 forecast.
- 86% of video advertisers were already using or planned to use generative AI for ad creation during 2025.
- Generative AI is expected to contribute to about 40% of video advertisements in 2026, as marketers automate editing, localization, and creative variations.
- In-stream mobile video produced an average eCPM of roughly $6.50, compared with $2.80 for standard mobile banners.
- Rewarded video generated an average eCPM of approximately $10.50, or about 62% more than the benchmark for in-stream video.
- Vertical video now serves as the default viewing format across many leading mobile platforms, creating more full-screen inventory for advertisers and publishers.
Mobile Search Ad Statistics
- U.S. AI-powered search advertising spending exceeded $1 billion in 2025, representing 1% of the market.
- Forecasts predict U.S. AI search ad spending will surge to nearly $26 billion by 2029, rising by $25 billion.
- AI-powered placements are projected to account for 13.6% of U.S. search ad spending by 2029.
- AI search advertising is expected to grow by more than 20 times between the years 2025 and 2029.
- A leading provider’s U.S. search ad market share is expected to drop 50% below in 2026 after a decade.
- Global mobile advertising revenues reached $254.4 billion in 2025 due to increased smartphone adoption.
- Search advertisements are anticipated to hold a substantial 36.95% share of all mobile ad formats in 2026.
- Roughly 64% of all digital search traffic currently originates from mobile devices in 2026.
Mobile Social Media Ad Statistics
- Global social media advertising spending is projected to reach $317.33 billion in 2026.
- Social media ad spending is forecast to grow at an annual rate of 10.9% from 2026 through 2030.
- Mobile devices are projected to generate 82.9% of social media advertising spending by 2030.
- Social advertising is the leading source of brand awareness among global internet users ages 16 to 34.
- The world had more than 5 billion social media users in 2025, creating a mobile-scale audience for paid campaigns.
- The average social media user visits 6.5 platforms per month, increasing the need for cross-platform creative and frequency management.
- Users spend an average of 18 hours and 36 minutes per week on social platforms and social video services.
- 99.3% of users across one major social platform group access its services through mobile devices, making its advertising ecosystem almost entirely mobile-led.
- The U.S. had 253 million social media user identities at the start of 2025, equal to 73% of the population.
- U.S. social media usage reached 81.5% of adults, based on an estimated advertising audience of 223 million users ages 18 and older.
Mobile Advertising Revenue by Industry
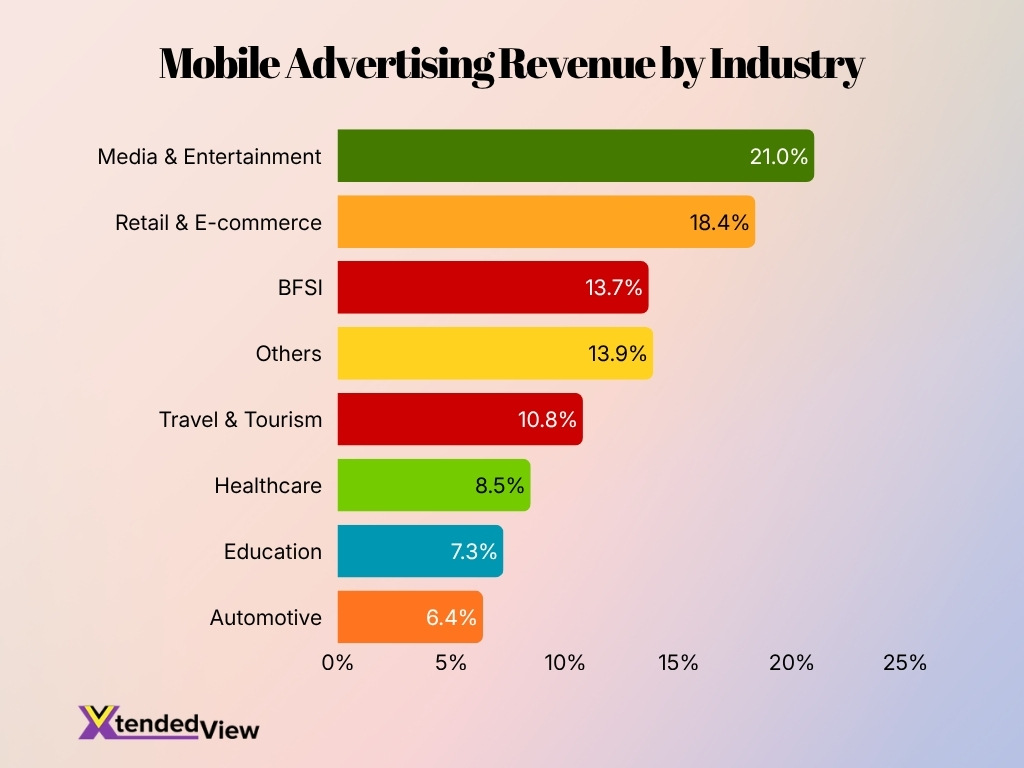
- Media & Entertainment leads the mobile advertising market with a 21.0% revenue share, reflecting strong spending from streaming platforms, gaming companies, digital publishers, and entertainment brands.
- Retail & E-commerce ranks second with an 18.4% share, supported by mobile shopping apps, personalized promotions, product discovery campaigns, and performance-based advertising.
- Together, Media & Entertainment and Retail & E-commerce account for 39.4% of total mobile advertising revenue, making them the two most dominant industries.
- The BFSI sector contributes 13.7%, showing that banks, fintech companies, insurers, and investment platforms are increasingly using mobile ads to attract and retain customers.
- Travel & Tourism holds a 10.8% share, driven by mobile campaigns promoting flight bookings, hotel reservations, vacation packages, and destination-based offers.
- Healthcare accounts for 8.5% of mobile advertising revenue, as healthcare providers, telemedicine platforms, pharmaceutical firms, and wellness brands expand their digital outreach.
- The Education industry represents 7.3%, reflecting growing mobile advertising activity from online learning platforms, universities, training providers, and educational technology companies.
- Automotive records a 6.4% share, the lowest among the listed industries, but mobile campaigns remain important for vehicle launches, dealership promotions, and customer lead generation.
- The Others category contributes 13.9%, indicating that several smaller industries collectively maintain a substantial presence in the mobile advertising market.
In-App Advertising Statistics
- The global in-app advertising market was valued at approximately $229.2 billion in 2025 under one industry estimate.
- In-app advertising revenue is expected to increase to about $268.2 billion in 2026, representing a one-year gain of $39 billion.
- The same forecast expects the market to reach $461.4 billion by 2033, with an 8.1% compound annual growth rate from 2026 onward.
- A separate estimate placed 2026 in-app advertising spending at $418.73 billion, highlighting substantial variation in how market researchers define the category.
- That broader estimate projects in-app advertising revenue of $614.74 billion by 2031, representing a 7.99% annual growth rate.
- Global app installs increased 11% in 2024, while app sessions grew 4%, expanding the available audience for in-app advertising.
- E-commerce app installs rose 17% year over year, while shopping sessions increased 13% in 2024.
- Finance app installs grew 27% in 2024, accompanied by a 24% increase in sessions and average monthly revenue per active user of $4.10.
- Global App Tracking Transparency opt-in rates reached 35% by the first quarter of 2025, leaving most tracked iOS users unavailable for conventional cross-app targeting.
- A large mobile gaming experiment found that every $100 in ad spending generated 37 paid installs and three additional organic installs.
Mobile Programmatic Advertising Statistics
- The global programmatic advertising market was estimated at $650 billion in 2025 under one broad market forecast.
- Programmatic advertising spending is estimated to reach $720 billion in 2026, an increase of roughly $70 billion year over year.
- The global programmatic market is projected to reach $1.17 trillion by 2031, with a 10.34% compound annual growth rate.
- Worldwide programmatic display ad spending grew an estimated 14.6% in 2025.
- Programmatic placements represent more than 90% of digital display spending in mature markets such as the U.S. and parts of Europe.
- The Asia-Pacific programmatic advertising market increased from $210.22 billion in 2025 to $258.17 billion in 2026.
- Asia-Pacific programmatic spending is projected to reach $720.31 billion by 2031, reflecting a 22.8% compound annual growth rate.
- Programmatic buying now extends beyond mobile banners into video, retail media, connected television and digital out-of-home inventory.
- A study of 218 million mobile in-app impressions found that impression prices fell an average of 23% when user tracking was unavailable.
- More than 90% of app publishers in that study received lower prices for impressions served to users who could not be tracked.
Mobile Ad Click-Through Rate
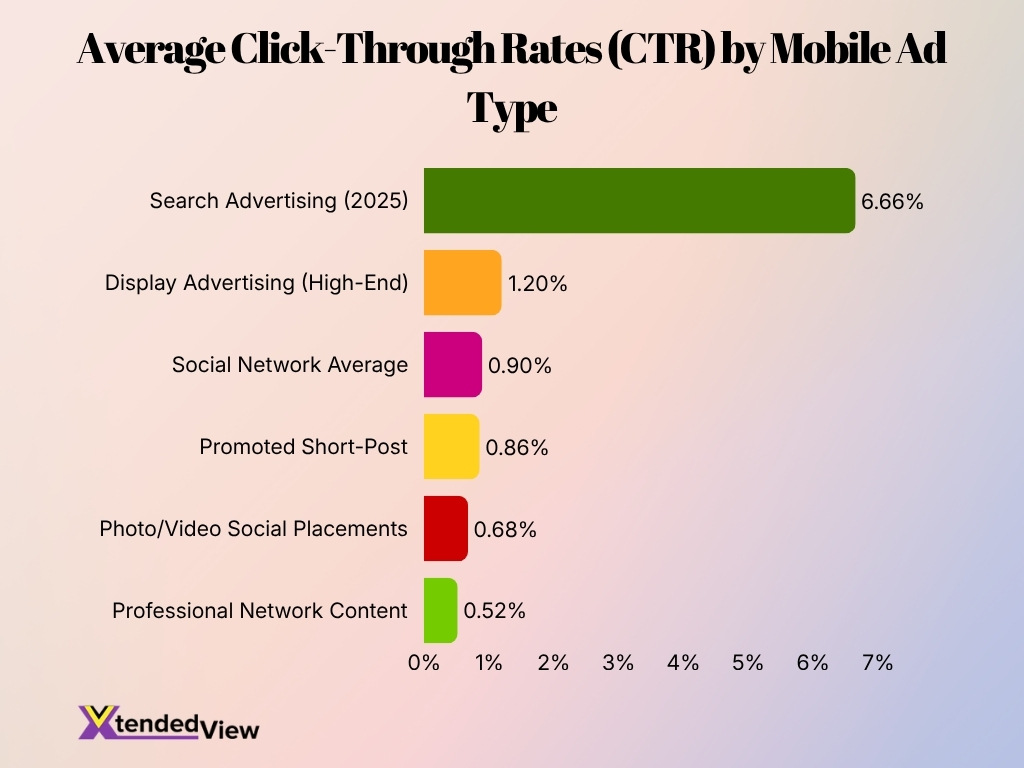
- Search advertising recorded an average click-through rate of 6.66% in 2025 across the measured U.S. industries, up 3.74% from the previous benchmark period.
- A click-through rate above 3% generally signals strong search campaign performance, although results vary by keyword intent, competition, and industry.
- Display advertising commonly produces click-through rates between 0.5% and 1.2%, which remains lower than search because users do not actively request the advertised information.
- Search ads can exceed a 5% CTR in high-intent categories where users actively compare products, services, or local providers.
- Social advertising benchmarks covering late 2024 through 2025 placed one major network’s average CTR at 0.90% across campaign objectives.
- Photo- and video-led social placements averaged a 0.68% CTR, while professional-network sponsored content averaged 0.52% during the same benchmark period.
- Promoted short-post placements generated an estimated 0.86% CTR, showing that performance can differ materially by platform and audience behavior.
- Researchers found that excluding probable accidental mobile clicks from model training increased predicted click-through performance by 3.9% and ad revenue by 0.2% in a large mobile advertising test.
- Advanced CTR models can achieve results comparable with conventional approaches while using only 2% of the training data, according to a 2025 benchmark study.
Mobile Ad Conversion Rate
- Most mobile apps convert about 1% to 2% of installers into purchasers, although conversion rates vary by product category, price, and onboarding quality.
- Retail apps recorded an estimated 1.38% install-to-purchase conversion rate in a 2026 benchmark.
- Travel apps generated a higher 2.41% install-to-purchase rate, reflecting the stronger intent behind many travel searches and downloads.
- Non-gaming apps converted 9.84% of installers into one-time buyers in a global 2026 monetization analysis.
- North American non-gaming apps converted 11.14% of installs into first-time buyers and 5.08% into repeat buyers.
- Latin American apps converted 6.51% of installers into one-time buyers and 3.09% into repeat purchasers.
- Casino games led the measured gaming categories with a 4.95% one-time payer conversion rate and a 3.01% repeat-payer rate.
- Fewer than 10% of e-commerce app installers typically complete a purchase, but more than 75% of those first purchases occur within the opening week.
- Once an e-commerce app user makes an initial purchase, 60% make at least one additional purchase, making the first conversion a critical retention milestone.
- A production search advertising model trained on 2.5 times more data delivered a combined 2.6% improvement in search conversion rate during online testing.
Mobile Advertising ROI Statistics
- E-commerce app users can generate 3.5 to seven times more revenue per user than mobile website visitors, making app acquisition valuable when retention remains strong.
- Mobile shopping apps can convert users at rates up to seven times higher than mobile websites.
- Average order values inside commerce apps can run 10% to 50% higher than orders completed through mobile websites.
- Automated mobile push campaigns can recover as much as 22% of abandoned carts, providing an owned-media complement to paid advertising.
- Web-to-app campaigns increased owned-media conversions by 77% in 2024 compared with 2023, highlighting the value of connecting mobile landing pages with app experiences.
- Android e-commerce re-engagement campaigns produced a 231% conversion uplift in the U.S., while comparable iOS activity generated a 118% uplift.
- Many e-commerce apps capture less than one-third of their app-influenced revenue in standard campaign reports, which can cause marketers to underestimate mobile ROI.
- Performance-focused automated shopping campaigns recorded 5% higher sales per click than standard shopping campaigns in the first quarter of 2025. However, higher costs and lower conversion produced a 7% weaker return on ad spend.
- Balancing brand and performance advertising can increase marketing ROI by 25% to 100%, with one analysis placing the average gain near 90%.
- Overinvesting in short-term performance advertising can reduce ROI by 20% to 50%, especially when brands neglect awareness and future demand.
Key Mobile Consumer Behavior Trends: 2024 vs. 2026
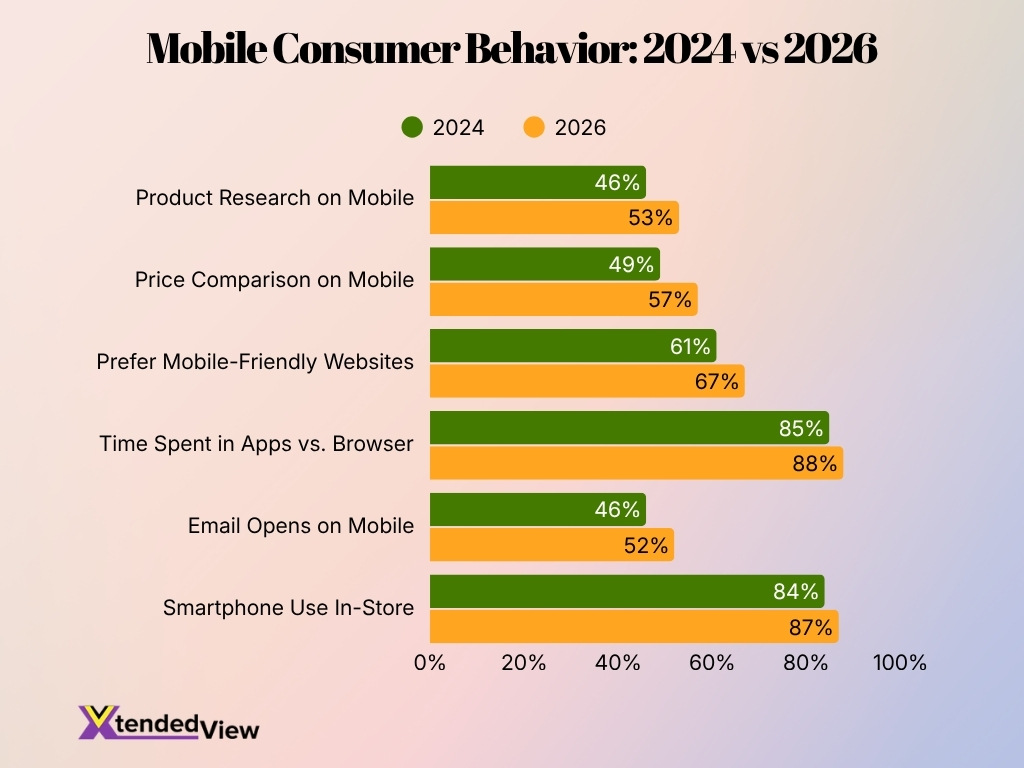
- Time spent in mobile apps remained the leading behavior, increasing from 85% in 2024 to 88% in 2026.
- Smartphone use in stores rose from 84% to 87%, showing stronger reliance on mobile devices during shopping.
- The share of consumers who prefer mobile-friendly websites increased by 6 percentage points, reaching 67% in 2026.
- Mobile price comparison recorded the largest increase, climbing 8 percentage points from 49% to 57%.
- Consumers conducting product research on mobile grew from 46% in 2024 to 53% in 2026.
- Mobile email opens increased by 6 percentage points, rising from 46% to 52%.
- All six measured behaviors recorded growth, indicating a broad shift toward greater mobile engagement.
- App usage and in-store smartphone activity both exceeded 87% in 2026, making them the most widespread mobile behaviors.
- Mobile product research, price comparison, and email engagement each surpassed 50% of consumers by 2026.
- The data suggests that businesses must prioritize mobile-first websites, apps, email campaigns, and shopping experiences.
Future of Mobile Advertising
- One market forecast values mobile advertising at $303.9 billion in 2026 and projects growth to $798.59 billion by 2033.
- That forecast represents a 14.8% compound annual growth rate from 2026 through 2033.
- A broader market definition estimates mobile advertising could expand from $259 billion in 2025 to $1.49 trillion by 2034, illustrating how forecasts differ by included formats and revenue categories.
- AI-powered search advertising could rise from slightly more than $1 billion in 2025 to almost $26 billion by 2029 in the U.S.
- AI placements may capture 13.6% of U.S. search advertising spending by 2029, compared with approximately 1% in 2025.
- Global social media user identities reached 5.66 billion in late 2025, up 259 million, or 4.8%, in one year. This audience growth will continue expanding mobile ad reach in 2026.
- Smartphones accounted for nearly 87% of mobile handsets in use worldwide in early 2025, creating a larger addressable market for app, video, commerce and search ads.
- When user-level tracking remains unavailable, mobile in-app impression prices fall by an average of 23%, increasing pressure on contextual targeting and first-party data strategies.
- More than 90% of mobile app publishers received lower impression prices for users without tracking identifiers, although premium and niche publishers experienced smaller losses.
- Generative AI may support about 40% of video advertisements in 2026, helping advertisers produce more creative variations, languages, and audience-specific versions.
Frequently Asked Questions (FAQs)
The global mobile advertising market is projected to reach $322.67 billion in 2026, growing at a 18.6% CAGR through 2034.
North America accounted for 33.2% of the global mobile advertising market in 2025, making it the largest regional market.
U.S. internet advertising revenue reached a record $294.6 billion in 2025, representing 13.9% year-over-year growth.
Search advertising accounted for 38.8% of total U.S. digital advertising revenue in 2025.
Global consumers spent $167 billion on in-app purchases in 2025, an increase of 10% from the previous year.
Conclusion
Mobile advertising continues to dominate the digital marketing landscape as brands invest more heavily in smartphones, mobile apps, video, social media, and AI-powered advertising. The latest statistics show that mobile ad spending, programmatic buying, and in-app advertising are all expanding rapidly, while improvements in targeting, measurement, and automation continue to improve campaign performance. At the same time, privacy regulations and changing consumer behavior are encouraging advertisers to rely more on first-party data, contextual targeting, and AI-driven optimization.
Looking ahead, mobile advertising is expected to remain one of the fastest-growing segments of the global advertising industry. Continued growth in smartphone adoption, mobile commerce, social media engagement, and AI-powered advertising technologies will create new opportunities for businesses across retail, finance, gaming, entertainment, healthcare, and other industries. Organizations that combine data-driven strategies with engaging mobile experiences will be best positioned to maximize advertising performance and long-term return on investment.
