



Google Analytics continues to play a central role in how businesses measure digital performance. From tracking website traffic to analyzing user journeys across devices, it helps organizations make data-driven decisions that directly impact revenue and growth. Marketing teams rely on it to refine ad campaigns, while ecommerce brands use it to reduce cart abandonment and improve conversions. At the same time, GA4’s event-based model and AI-powered insights have reshaped how companies interpret user behavior in a privacy-first environment.
As digital ecosystems become more complex, understanding the latest Google Analytics statistics offers a clear advantage. Explore the data below to uncover how businesses are using analytics today and where the platform is heading next.
Editor’s Choice
- Google Analytics is used by 44.3% of all websites and by 79.4% of websites whose analytics technology can be identified, making it the world’s most widely used web analytics platform.
- Around 14.2 million websites actively use Google Analytics 4 (GA4) worldwide in 2026.
- Google Analytics remains the No. 1 web analytics technology, with approximately 24.46% technology market share across more than 24 million tracked domains.
- More than 6 million companies currently use Google Analytics to monitor website performance and customer behavior.
- The United States accounts for over 3.2 million GA4-enabled websites, making it the largest regional user base globally.
- Google Analytics now includes AI Assistant traffic reporting, enabling organizations to measure visits originating from AI platforms such as ChatGPT, Gemini, and Claude.
- The global web analytics market reached $6.26 billion in 2025 and is projected to grow to $7.36 billion in 2026, reflecting continued demand for analytics platforms.
Recent Developments
- In 2026, Google Analytics 4 is the only supported Analytics platform, following the retirement of Universal Analytics and historical UA reporting.
- Google introduced AI Assistant traffic as a dedicated reporting channel, making it easier to identify visits generated through conversational AI tools.
- GA4 continues to rely on an event-based data model, replacing the session-first architecture used by Universal Analytics.
- Built-in predictive metrics remain a key feature, helping marketers estimate purchase probability, churn probability, and future revenue.
- Privacy controls such as behavioral modeling and cookieless measurement continue to support reporting when consented data is unavailable.
- Google continues expanding integrations between GA4 and advertising products, allowing businesses to activate audiences directly from analytics insights.
- Industry tracking indicates that millions of legacy Universal Analytics tags still remain on websites even though they no longer collect data, highlighting incomplete cleanup after migration.
- Organizations increasingly combine GA4 with privacy-first analytics and server-side tagging as regulations continue to evolve worldwide.
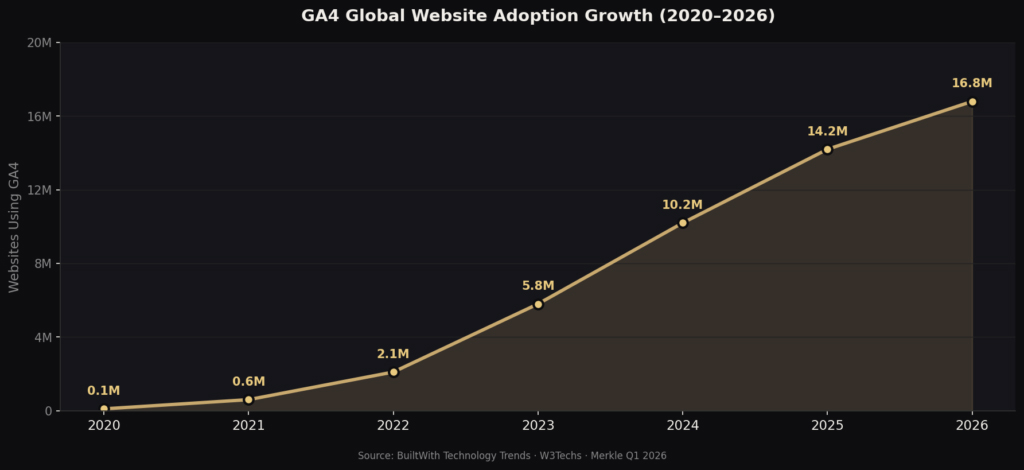
GA4 Adoption Grew Rapidly From 2020 to 2026
- GA4 adoption grew from 0.1 million websites in 2020 to 16.8 million websites in 2026.
- The biggest growth phase started after 2022, when adoption crossed 2.1 million websites.
- In 2023, GA4 usage reached 5.8 million websites, showing strong migration momentum.
- By 2024, GA4 adoption nearly doubled to 10.2 million websites.
- In 2025, the number of websites using GA4 increased to 14.2 million.
- By 2026, GA4 reached 16.8 million websites globally, marking its highest adoption level.
- From 2020 to 2026, GA4 adoption increased by 16.7 million websites.
- The data shows a clear upward trend as more businesses shifted from Universal Analytics to GA4.
Usage Statistics of Google Analytics
- Approximately 44.3% of all websites use Google Analytics today.
- Among websites with a detectable analytics solution, 79.4% rely on Google Analytics.
- More than 14.2 million active websites operate with GA4 in 2026.
- Roughly 98% of Google Tag Manager implementations also integrate Google Analytics, demonstrating strong ecosystem adoption.
- Millions of organizations, from startups to Fortune 500 enterprises, continue using Google Analytics for customer journey measurement.
- Google Analytics supports both websites and mobile apps within a single GA4 property, reducing reporting fragmentation.
- Small businesses remain the largest adoption segment, although enterprises increasingly combine GA4 with customer data platforms and BI tools.
- The platform continues serving organizations across ecommerce, SaaS, media, healthcare, education, finance, and government sectors.
Traffic Insights from Google Analytics
- Over 14.7 million active websites currently rely on the GA4 event-driven data model for measuring traffic.
- Google Analytics dominates the global web analytics industry with a massive 85.3% market share.
- Early adopters utilizing predictive audiences experience 34% to 42% higher conversion rates.
- The platform processes over 10 billion daily events to provide deep insights into user interactions.
- Approximately 62% of Fortune 500 companies use GA4 as their primary tool for cross-device reporting.
- Proper event-level reporting and documented event plans improve overall data quality by 2.4x.
- Roughly 34% of marketers actively use predictive metrics to identify purchase and churn probabilities.
- Firms integrating GA4 with CRM and advertising data report a 34% improvement in marketing ROI.
- Businesses leveraging real-time analytics and insights achieve measurable revenue growth in 80% of cases.
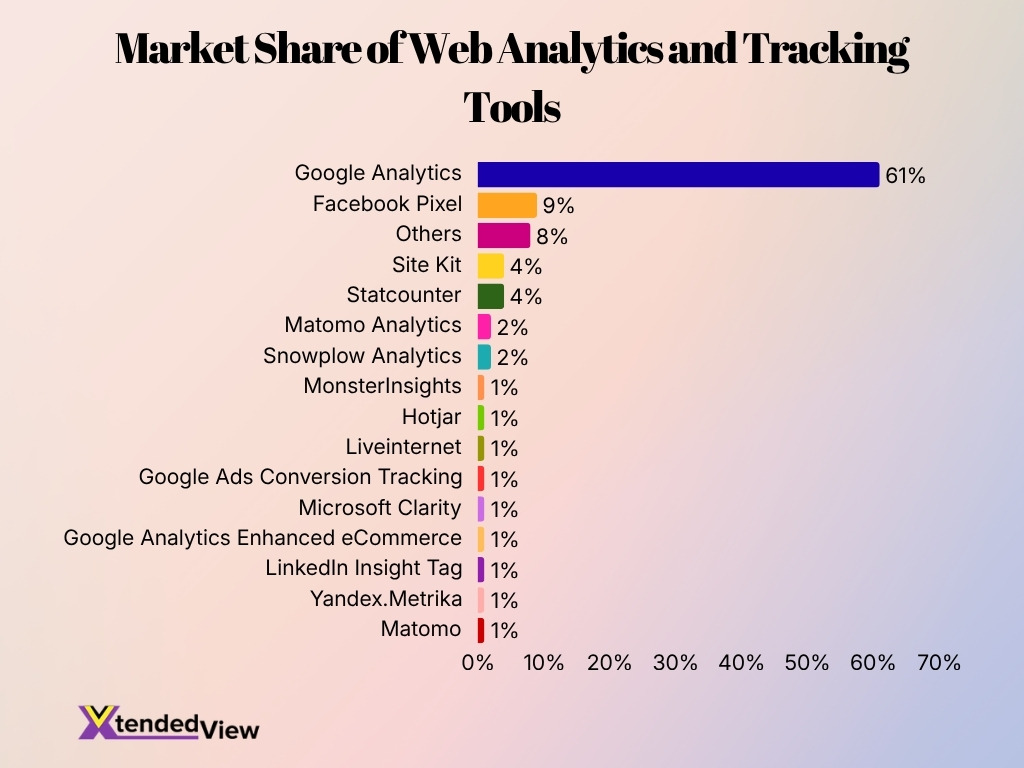
Web Analytics Tool Market Share Insights
- Google Analytics dominates the market with a massive 61% share, making it the leading web analytics tool.
- Facebook Pixel ranks second with 9%, showing its strong role in ad tracking and audience retargeting.
- The Others category holds 8%, indicating a fragmented market beyond the top analytics platforms.
- Site Kit and Statcounter each account for 4%, placing them among the top five tools.
- Matomo Analytics and Snowplow Analytics each capture 2%, showing limited but notable adoption.
- Several tools, including MonsterInsights, Hotjar, Microsoft Clarity, and LinkedIn Insight Tag, each hold 1% market share.
- Google-related tools appear multiple times, including Google Analytics, Google Ads Conversion Tracking, and Enhanced eCommerce.
- The data shows that Google’s analytics ecosystem has a clear advantage over competing tracking platforms.
User Demographics in Google Analytics
- The United States has 3.2 million websites using GA4.
- Japan has 384,181 websites using GA4.
- The United Kingdom ranks third with 358,348 active GA4 users.
- Around 55.7% of all active websites globally have Google Analytics installed.
- The 25–34 age group leads demographic traffic with a 26.85% share.
- Mobile devices account for 64.35% of all global web traffic.
- English-speaking countries make up 54% of the total GA4 user base.
- Approximately 73% of the top 10,000 websites rely on Google Analytics.
Audience Behavior Statistics in Google Analytics
- GA4 reports show that engaged sessions average 55% to 65% across most industries, reflecting stronger focus on meaningful interactions over raw traffic.
- The average engagement rate for ecommerce sites ranges between 50% and 60%, depending on traffic source quality.
- Users who engage with at least one event are 2.5x more likely to convert than those who bounce quickly.
- GA4 tracks scroll depth, outbound clicks, and video engagement, giving marketers a deeper understanding of user behavior.
- Websites using personalized content based on behavior see up to 20% higher engagement rates.
- Mobile users typically show 10% to 15% lower engagement rates compared to desktop users due to shorter session durations.
- Returning visitors generate 2x more interactions per session compared to new users.
- Sites with faster load times under 2 seconds report higher engagement rates by up to 30%.
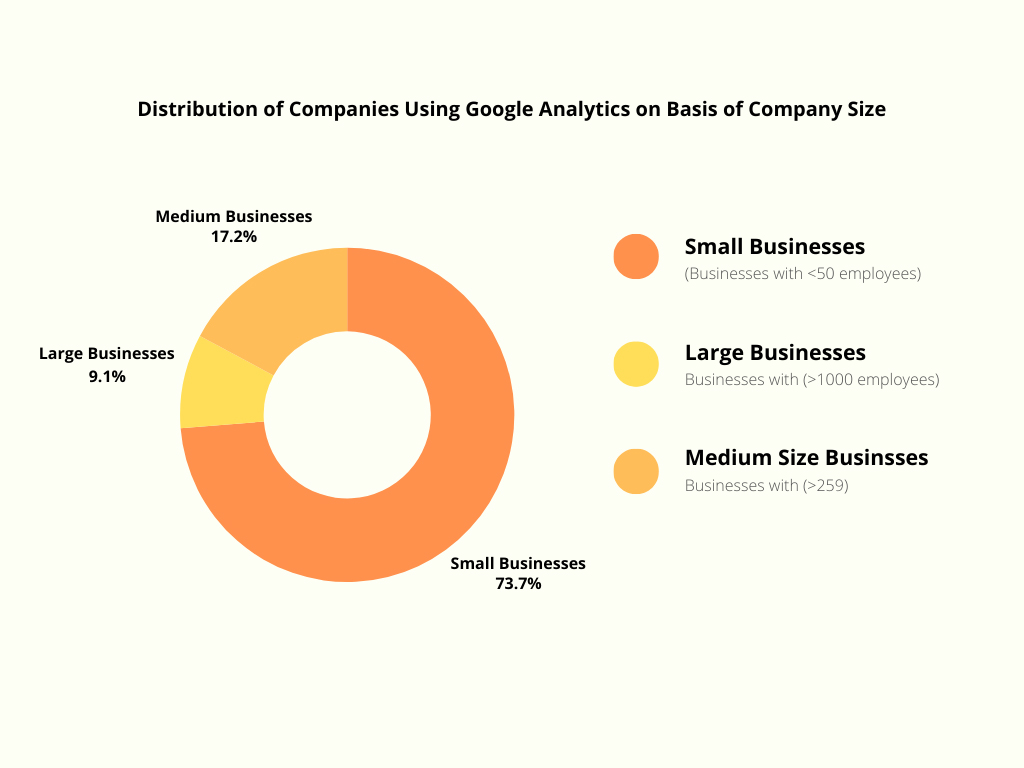
Company Size Distribution of Google Analytics Users
- Small businesses dominate Google Analytics usage, accounting for 73.7% of companies.
- Medium businesses represent 17.2% of Google Analytics users.
- Large businesses make up the smallest share, at just 9.1%.
- Companies with fewer than 50 employees are the biggest user group for Google Analytics.
- The data shows Google Analytics is especially popular among small-scale companies.
- Small businesses use Google Analytics over 4x more than medium businesses.
- Large businesses account for less than 10% of companies using Google Analytics.
- The chart suggests Google Analytics is widely adopted by businesses seeking affordable web analytics tools.
- Small and medium businesses together account for 90.9% of total Google Analytics usage.
- The low share of large businesses may indicate that many enterprises use more advanced or customized analytics systems.
Conversion Statistics in Google Analytics
- The average website conversion rate across industries ranges between 2% and 5% in 2025 to 2026.
- Ecommerce conversion rates typically average 2.5% globally, with top-performing stores exceeding 5%.
- Businesses using GA4 predictive audiences see conversion improvements of up to 20%.
- Mobile conversion rates are 30% to 50% lower than desktop conversions, despite higher traffic volume.
- Websites with optimized landing pages can increase conversions by up to 25%.
- Returning users convert at rates 2x higher than first-time visitors.
- Sites implementing event tracking for micro-conversions see better attribution accuracy by over 30%.
- Email-driven traffic delivers conversion rates up to 3x higher than social media traffic.
Session Statistics in Google Analytics
- The average sessions per user is approximately 1.4 to 1.8 sessions, depending on industry.
- GA4 defines sessions based on user activity rather than time-based resets, improving accuracy.
- Average session duration across industries remains around 120 to 180 seconds.
- Returning users contribute over 40% of total sessions for most websites.
- High-performing sites achieve sessions per user above 2.0, indicating strong retention.
- Session counts from mobile devices exceed 60% of total sessions globally.
- Sites with strong content strategies see session growth rates of 10% to 20% annually.
- Session-based metrics are increasingly supplemented by event-based insights in GA4.
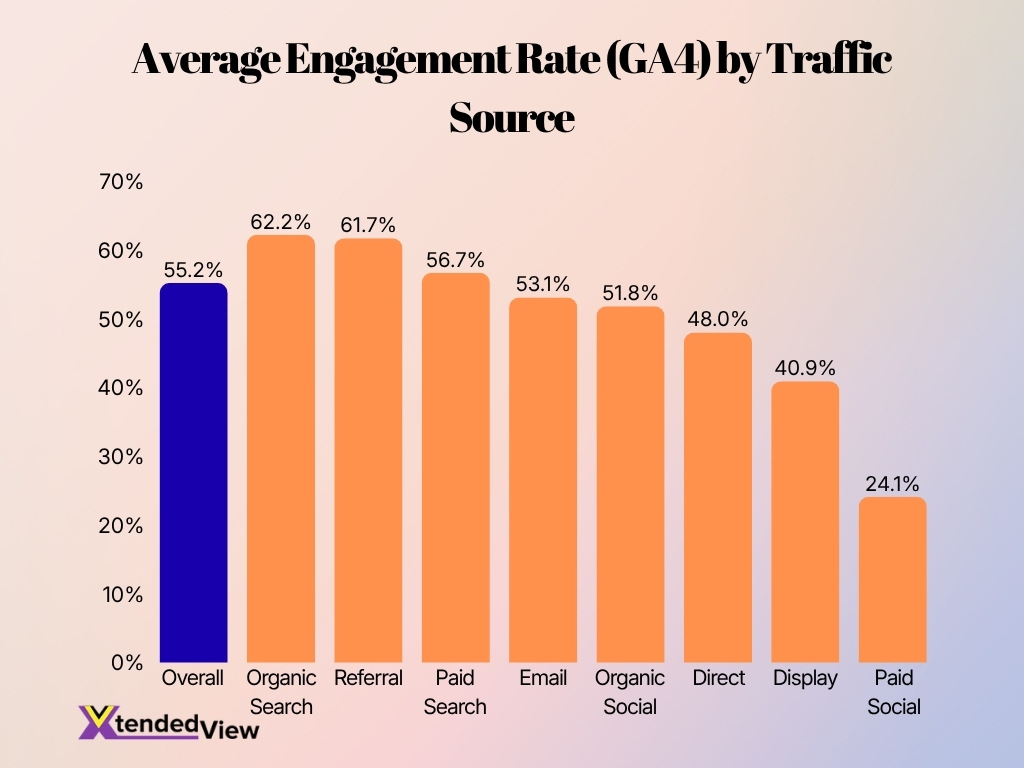
GA4 Engagement Rate by Traffic Source
- Organic Search recorded the highest GA4 engagement rate at 62.2%, showing strong visitor intent from search traffic.
- Referral traffic followed closely with a 61.7% engagement rate, indicating high-quality visitors from external websites.
- Paid Search performed above the overall benchmark with an engagement rate of 56.7%.
- The overall average engagement rate across all sources was 55.2%.
- Email traffic generated a 53.1% engagement rate, slightly below the overall average.
- Organic Social delivered a moderate engagement rate of 51.8%.
- Direct traffic had a lower engagement rate of 48.0%, suggesting mixed user intent.
- Display traffic showed weaker engagement at 40.9% compared with search and referral sources.
- Paid Social had the lowest engagement rate at 24.1%, making it the weakest-performing traffic source in this dataset.
- The gap between Organic Search and Paid Social was 38.1 percentage points, showing a major difference in audience quality.
Pageviews Statistics in Google Analytics
- The average pages per session ranges between 2 and 4 pages across most industries.
- Content-heavy websites such as blogs and media platforms often exceed 4+ pages per session.
- Ecommerce websites typically average 3 to 5 pageviews per session.
- Sites with strong internal linking increase pageviews by up to 30%.
- Mobile users generate fewer pageviews per session compared to desktop users.
- High bounce scenarios often result in single-page sessions, reducing average pageview metrics.
- Pageviews remain a key metric for content performance and ad revenue optimization.
- Faster-loading pages can increase pageviews per session by up to 20%.
Event Tracking Statistics in Google Analytics
- Businesses implementing event tracking gain 30% better visibility into user actions.
- Advanced event tracking improves conversion attribution accuracy by up to 35%.
- Automated event tracking reduces implementation time by up to 50% versus manual tagging.
- Over 10 billion daily events are processed across all GA4 properties globally.
- Approximately 82% of users rely on enhanced measurement for automatic event tracking.
- Properties tracking custom events report a 26% improvement in campaign-level ROAS accuracy.
- Around 48% of eCommerce platforms have implemented full enhanced eCommerce event tracking.
- GA4 properties track an average of 18.7 distinct conversion events, compared to 4.2 goals in Universal Analytics.
GA4 Event Implementation
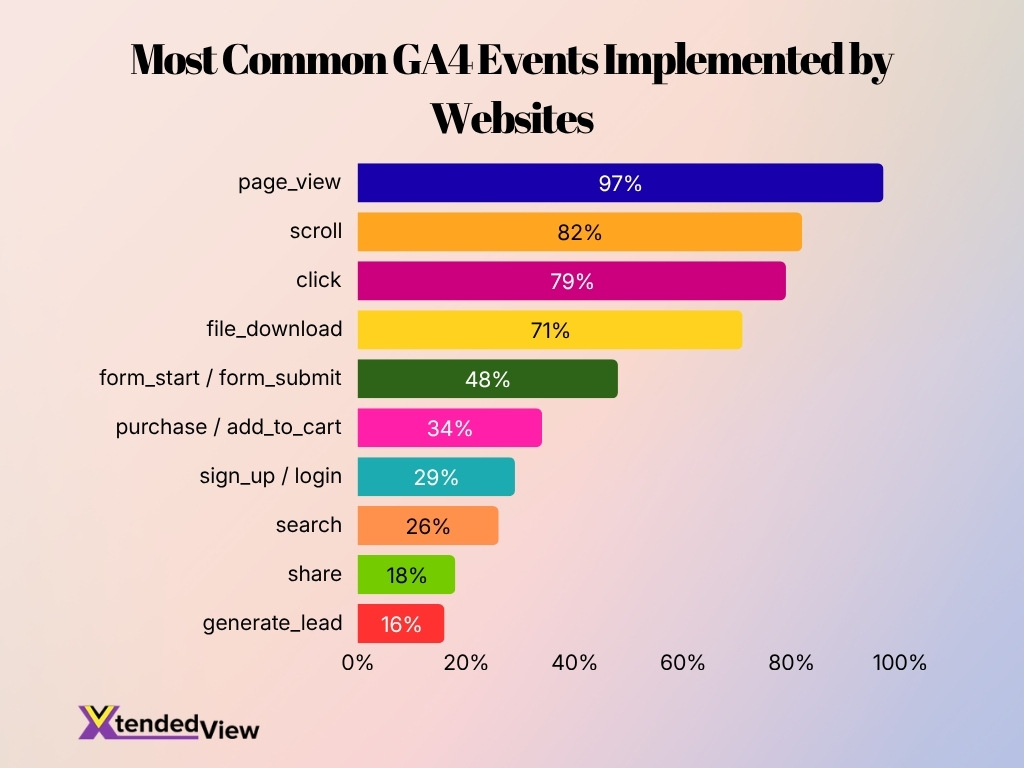
- page_view is the most widely implemented GA4 event, used by 97% of websites.
- scroll tracking ranks second, with an 82% implementation rate through enhanced measurement.
- Outbound click tracking is used by 79% of websites, showing strong adoption of click-based engagement tracking.
- file_download events are implemented by 71% of websites, making download behavior a major GA4 tracking metric.
- form_start / form_submit events are tracked by 48% of websites, showing moderate form interaction monitoring.
- eCommerce events such as purchase / add_to_cart are implemented by 34% of websites.
- sign_up / login events are tracked by 29% of websites, helping measure account-based user activity.
- site search tracking is used by 26% of websites to understand what users look for internally.
- share events have a lower implementation rate at 18%, suggesting social interaction tracking is less common.
- generate_lead is the least implemented event in this dataset, with only 16% adoption.
- The data shows GA4 adoption is strongest for automatic and enhanced measurement events, while conversion-focused events are less widely used.
Ecommerce Statistics in Google Analytics
- Ecommerce tracking in GA4 enables businesses to monitor product views, cart actions, and purchases in real time.
- Global ecommerce conversion rates average 2.5% to 3%, with top performers exceeding 5%.
- Cart abandonment rates remain high at around 70% globally.
- Businesses using GA4 ecommerce insights report better revenue attribution accuracy by 25%.
- Mobile ecommerce accounts for over 60% of total online sales traffic.
- Personalized product recommendations can increase revenue by up to 15%.
- Average order value increases by 10% to 20% when cross-selling strategies are implemented.
- Ecommerce businesses using GA4 predictive metrics see improved customer lifetime value forecasting.
Device Usage Statistics in Google Analytics
- Mobile devices account for over 58% to 62% of global web traffic, making them the dominant source of sessions tracked in GA4.
- Desktop users still generate higher conversion rates by 30% to 50% compared to mobile users.
- Tablet traffic contributes a smaller share, typically around 2% to 4% of total sessions.
- Cross-device tracking in GA4 helps unify user journeys across mobile, desktop, and app environments.
- Mobile-first indexing and browsing behavior continue to influence how analytics data is interpreted across industries.
- Websites optimized for mobile performance can improve engagement rates by 15% to 25%.
- Mobile users tend to have shorter session durations, often under 2 minutes, compared to desktop sessions.
- Businesses using cross-device reporting see more accurate attribution models, especially in ecommerce funnels.
Search Traffic Statistics in Google Analytics
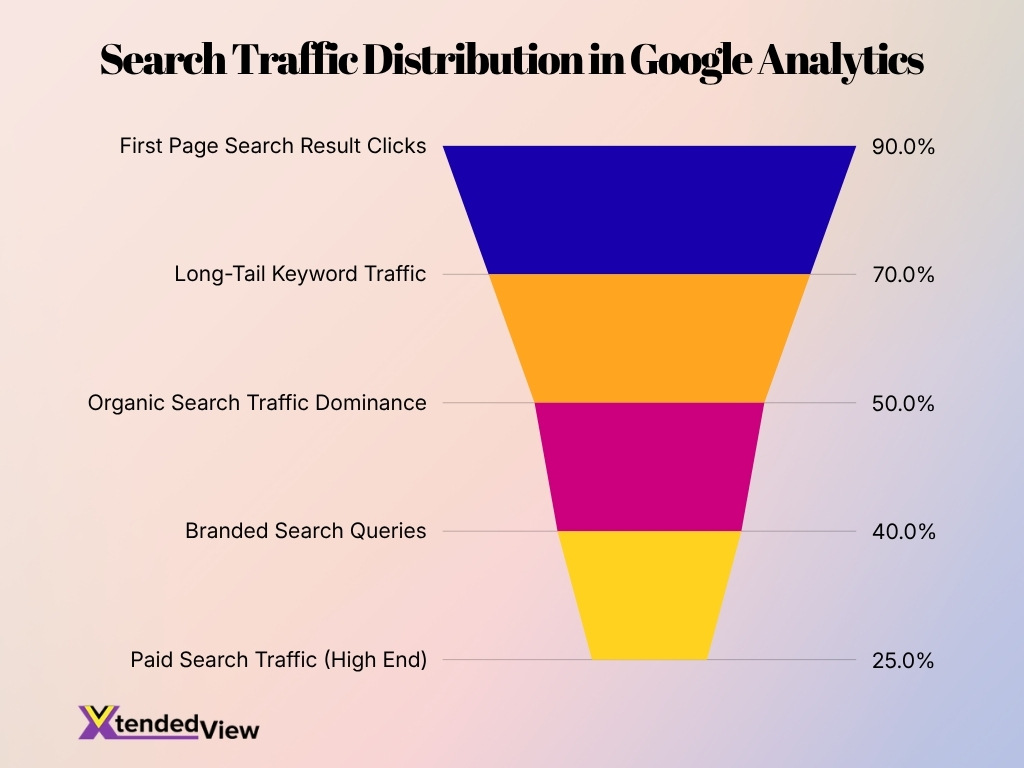
- Organic search drives over 50% of website traffic for most industries, making it the largest acquisition channel.
- Paid search contributes 15% to 25% of traffic, depending on ad spend and campaign strategy.
- Websites ranking on the first page of search results capture over 90% of clicks.
- Search traffic typically shows higher intent, resulting in better conversion rates compared to social traffic.
- Branded search queries account for 30% to 40% of organic traffic for established businesses.
- Long-tail keywords drive more than 70% of search traffic across most industries.
- GA4 integrates with search console data to provide deeper insights into query-level performance.
- AI-driven search and conversational queries are influencing traffic patterns, requiring new tracking approaches.
Referral Traffic Statistics in Google Analytics
- Referral traffic typically accounts for 5% to 15% of total website traffic, depending on industry and backlink strategy.
- Websites with strong backlink profiles generate higher referral engagement rates, often exceeding organic traffic engagement in niche industries.
- High-authority referrals can increase conversion rates by up to 25% due to stronger user intent.
- Social media platforms contribute significantly to referral traffic, especially for content-driven websites.
- Referral traffic from trusted domains often results in lower bounce rates compared to paid traffic sources.
- Businesses that invest in partnerships and guest content see steady referral growth of 10% to 20% annually.
- GA4 tracks referral exclusions and domain filtering to ensure accurate attribution of traffic sources.
- Referral traffic remains critical for brand visibility and authority building across digital channels.
Reporting Statistics in Google Analytics
- Businesses using custom reports achieve faster decision-making by up to 30%.
- Advanced reporting tools improve ROI tracking accuracy by 20% to 30%.
- Approximately 47% of users leverage automated insights for anomaly detection.
- Over 74% of businesses actively monitor data using real-time reporting.
- Around 43% of users rely on custom report building for tailored data views.
- Nearly 28% of analysts utilize exploration reports for deep data modeling.
- About 34% of marketers adopt predictive metrics for future trend analysis.
- A staggering 87% of previous users have completed their GA4 migration.
- Proper event planning yields 2.4x better data quality for accurate reporting.
Frequently Asked Questions (FAQs)
Google Analytics is used by approximately 46.0% of all websites and 81.3% of websites with an identifiable traffic analysis tool.
More than 14.2 million websites actively use Google Analytics 4 worldwide, with some industry estimates placing adoption at over 16.8 million websites in early 2026.
Google Analytics holds approximately 80.4% of the web analytics market among websites using a detectable analytics solution.
Around 7.96 million companies worldwide use Google Analytics as their web analytics platform.
The global web analytics market is projected to reach approximately $7.36 billion in 2026, with an expected 16.93% CAGR through 2034.
Conclusion
Google Analytics remains a dominant force in the analytics ecosystem, supported by its massive adoption, evolving capabilities, and deep integration with marketing tools. The transition to GA4 has introduced a more flexible, event-driven approach that gives businesses better visibility into customer journeys across platforms and devices. At the same time, features like predictive metrics, AI-driven insights, and privacy-focused tracking reflect the growing need for smarter and more responsible data usage.
These statistics highlight not only how widely Google Analytics is used, but also how critical it has become for optimizing performance, improving user experiences, and driving measurable outcomes. As competition intensifies and user behavior continues to evolve, organizations that actively leverage analytics insights will stay better positioned to adapt, grow, and make confident decisions.
