



Mobile shopping has become the default way millions of consumers discover, compare, and purchase products. Retailers now optimize every stage of the buying journey for smartphones, from personalized recommendations to one-tap payments. This shift influences industries ranging from retail and grocery delivery to travel and financial services. Explore the latest mobile shopping statistics to understand how consumer behavior, market growth, and mobile commerce continue to reshape online retail.
Editor’s Choice
- Global mobile commerce revenue is projected to reach approximately $2.5 trillion in 2025, with mobile accounting for 63% of total retail e-commerce by 2028.
- Mobile devices generated the majority of global online retail website visits in Q1 2026, reinforcing the shift toward smartphone-first shopping.
- Digital wallets became the leading online payment method worldwide in 2025, and their share is forecast to reach 63% of global e-commerce transaction value by 2030.
- During the 2024 U.S. holiday shopping season, 54.5% of online purchases were completed on smartphones, up from 51.1% in 2023.
- Global online shopping cart abandonment reached 70.22% in 2026, slightly above 70.19% in 2025, highlighting persistent checkout friction.
- Mobile commerce has evolved from a niche channel into the primary growth driver for online retail as desktop shopping continues to lose share worldwide.
- Consumer spending on mobile apps exceeded $35 billion in Q4 2024, reflecting continued engagement with shopping and marketplace apps.
Recent Developments
- Retailers increasingly adopted AI-powered shopping assistants throughout 2025 to improve product discovery and personalized recommendations.
- Adobe reported that U.S. online holiday sales reached $241.4 billion in 2024, growing 8.7% year over year.
- Smartphone transactions represented 54.5% of U.S. online holiday purchases in 2024, the highest share reported by Adobe Analytics.
- AI-driven shopping assistants generated a 1,300% increase in traffic to retail websites during the 2024 U.S. holiday shopping season.
- Buy Now, Pay Later (BNPL) spending reached $18.2 billion during the 2024 U.S. holiday season, an increase of 9.6% from the previous year.
- Mobile-first marketplaces such as Temu and Shein continued to rank among the world’s most downloaded shopping apps during 2025.
- Digital wallets strengthened their leadership as the preferred online payment method across most major regions in 2025.
- Retailers increasingly combined AI recommendations with mobile checkout experiences to improve conversion rates and customer engagement.
Mobile Shopping Statistics Overview
- Smartphones have become the primary device for online shopping in most developed and emerging markets.
- Mobile commerce revenue is expected to total around $2.5 trillion in 2025, with steady growth projected through 2028.
- Mobile commerce is projected to represent 63% of total retail e-commerce worldwide by 2028.
- Digital wallets remained the most widely used online payment method globally in 2025.
- Mobile devices generated most global retail website visits during the first quarter of 2026.
- Mobile shoppers frequently add products to carts but still convert at lower rates than desktop shoppers.
- Global cart abandonment remained above 70% in both 2025 and 2026.
- Consumer spending across mobile applications exceeded $35 billion in the fourth quarter of 2024, supporting continued investment in app-based commerce.
- Retailers continue investing in faster mobile websites, streamlined checkout flows, and app-exclusive offers to increase conversions.
US Mobile Retail Commerce Sales
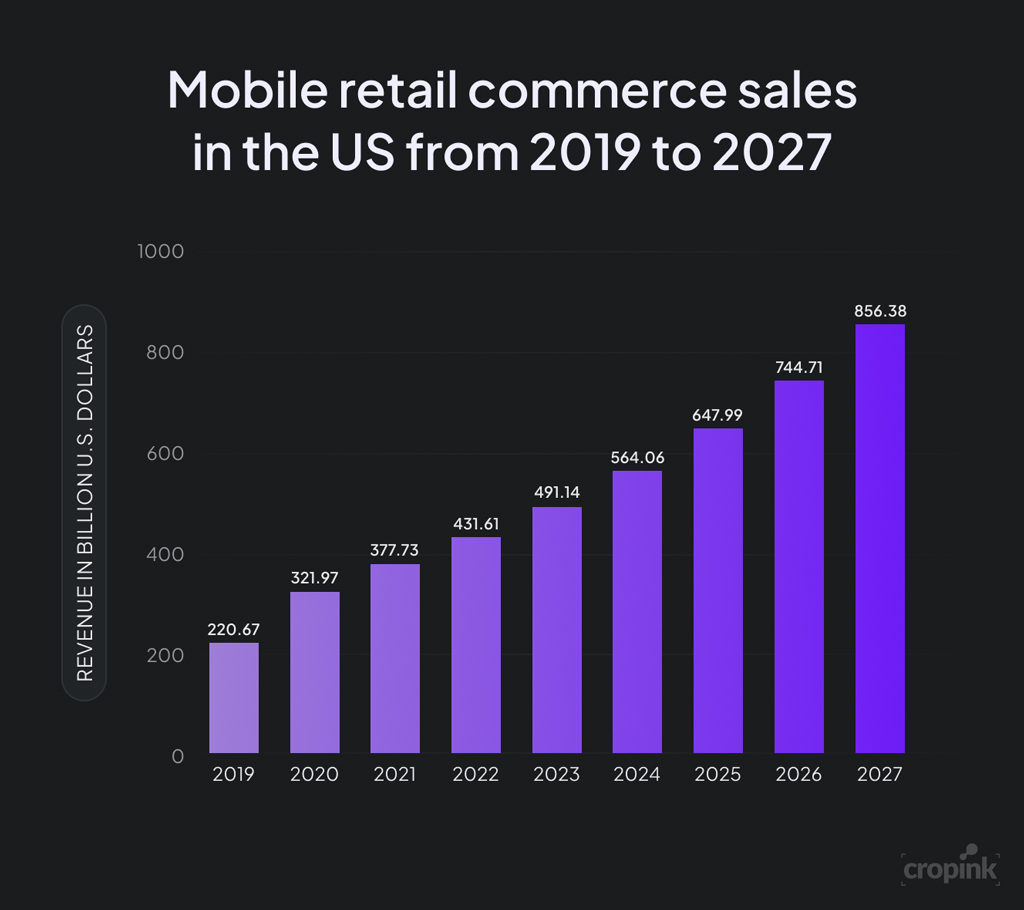
- US mobile retail commerce sales increased from $220.67 billion in 2019 to $856.38 billion in 2027, representing nearly a fourfold expansion over eight years.
- Sales recorded their largest early jump between 2019 and 2020, rising by $101.30 billion, or approximately 45.9%.
- Mobile commerce revenue surpassed $400 billion in 2022, reaching $431.61 billion as smartphone-based shopping gained wider adoption.
- By 2023, US mobile retail sales had climbed to $491.14 billion, placing the market close to the $500 billion milestone.
- The market is projected to exceed $600 billion in 2025, with mobile retail commerce sales reaching $647.99 billion.
- Between 2025 and 2026, sales are expected to rise by $96.72 billion, increasing from $647.99 billion to $744.71 billion.
- The strongest annual dollar increase is projected for 2027, when sales rise by $111.67 billion to reach $856.38 billion.
- From 2024 to 2027, US mobile retail commerce sales are forecast to grow by $292.32 billion, highlighting sustained momentum in mobile shopping.
- Across the full 2019 to 2027 period, mobile retail commerce sales are expected to increase by $635.71 billion, equivalent to approximately 288% growth.
Global Mobile Shopping Market Size
- Global mobile commerce revenue is estimated at approximately $2.5 trillion in 2025.
- Analysts expect mobile commerce revenue to nearly double within four years, reflecting sustained smartphone adoption.
- Mobile commerce is forecast to account for 63% of retail e-commerce sales by 2028.
- The continued decline in desktop shopping has accelerated investments in mobile-first retail strategies.
- Consumer demand for faster checkout, app personalization, and digital wallets continues to expand the mobile shopping market.
- Asia-Pacific remains the largest contributor to global mobile commerce growth, driven by high smartphone penetration and super apps.
- North America continues to record strong mobile shopping growth through higher smartphone transaction values and wider BNPL adoption.
- Emerging markets continue to drive new mobile commerce users through affordable smartphones and expanding mobile internet access.
Mobile Shopping Traffic Share
- Mobile devices generated 64.3% of global retail website visits in Q1 2026.
- Smartphones captured 65% of all online retail traffic, compared to 35% for desktop computers.
- Mobile web traffic grew by 75% over the past decade while desktop traffic share dropped below 36%.
- Over 70% of product discovery searches start on mobile devices, though desktop conversion rates remain 1.7 times higher.
- Traffic from generative AI shopping assistants to retail sites surged 1,300% year-over-year during the 2024 holiday season.
- More than 75% of consumers watch short-form digital video on smartphones, significantly boosting mobile social commerce traffic.
- Global mobile data traffic reached 152 exabytes per month, driven by expanding 5G network speeds.
- Improving mobile page load speed by 1 second boosts retail conversion rates by up to 27%.
Mobile Commerce Ecosystem
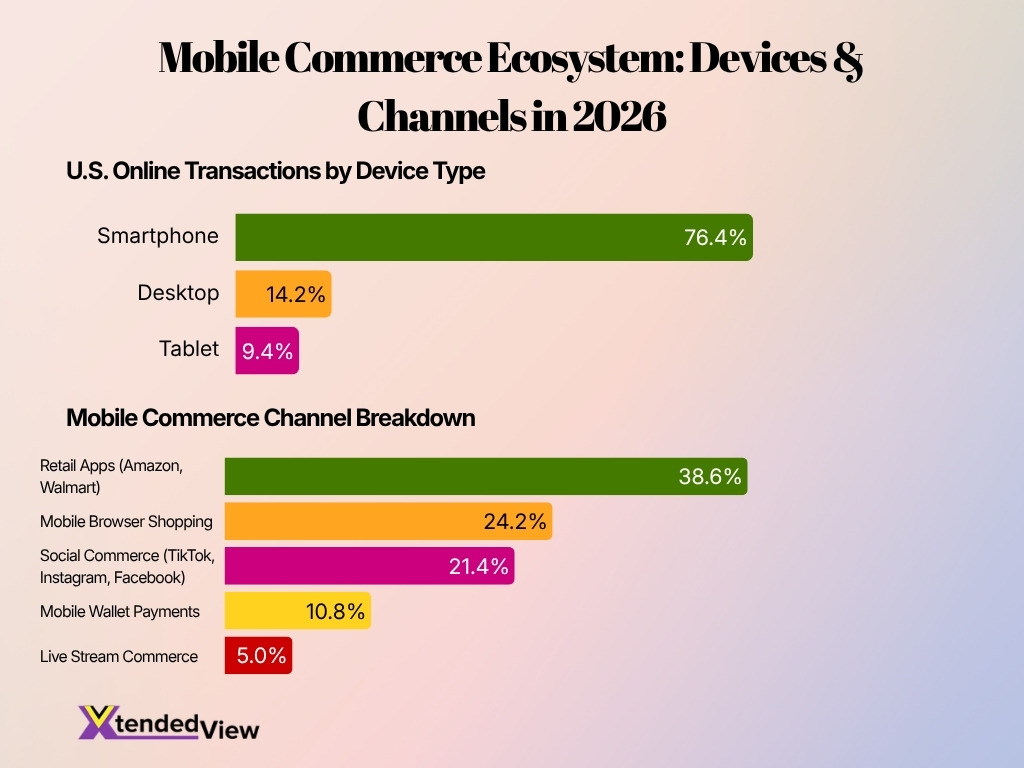
- Smartphones dominate U.S. online transactions, accounting for 76.4% of purchases, far ahead of desktops and tablets.
- Desktop transactions represent 14.2%, showing that computers still retain a modest role in online shopping despite the shift toward mobile devices.
- Tablets account for only 9.4% of U.S. online transactions, making them the least-used device category for digital purchases.
- Retail apps lead mobile commerce channels with a 38.6% share, highlighting the growing importance of platforms such as Amazon and Walmart.
- Mobile browser shopping captures 24.2% of the market, indicating that nearly one-quarter of mobile commerce still occurs outside dedicated apps.
- Social commerce contributes 21.4%, demonstrating the strong purchasing influence of platforms such as TikTok, Instagram, and Facebook.
- Mobile wallet payments hold a 10.8% share, reflecting increasing consumer adoption of faster and more convenient digital payment methods.
- Live stream commerce accounts for 5.0%, making it the smallest channel but an emerging format with potential for future growth.
- Combined, retail apps and mobile browsers generate 62.8% of mobile commerce activity, confirming that app-based and web-based shopping remain the core purchasing channels.
- The data shows that businesses should prioritize smartphone-first experiences, retail app optimization, and social commerce strategies to reach mobile shoppers effectively.
Mobile App Shopping Statistics
- Retail shopping apps generate 3 times higher conversion rates than traditional mobile websites.
- Consumer spending across mobile shopping apps exceeded $35 billion during Q4 2024.
- Mobile app cart abandonment averaged just 62.4%, compared with 78.2% for mobile browsers.
- Dedicated app users consistently produce an average order value that is 140% higher than mobile web shoppers.
- Targeted push notifications increase app engagement and boost sales conversions by up to 40%.
- More than 70% of global digital transactions currently occur directly through mobile shopping applications.
- Integrating biometric authentication reduces checkout times by nearly 30% for native app users.
- AI-powered personalized mobile app experiences increase overall customer retention rates by approximately 50%.
Mobile Web Shopping Statistics
- Mobile commerce is projected to account for over 60% of all e-commerce transactions by 2026.
- Smartphones generate nearly 78% of retail website traffic across the global market.
- The average mobile conversion rate falls between 1.5% and 3%, remaining roughly half of desktop performance.
- Mobile shopping carts suffer from an exceptionally high abandonment rate of up to 85.65%.
- Approximately 1.65 billion people worldwide are expected to shop via a smartphone in 2026.
- Nearly 70% of mobile shoppers prefer making purchases through dedicated e-commerce apps rather than websites.
- Global mobile commerce sales are forecasted to exceed $2.51 trillion by the end of 2025.
- Optimizing checkout design can lead to a massive 35.26% increase in overall conversion rates.
How Mobile Shoppers Use Their Smartphones
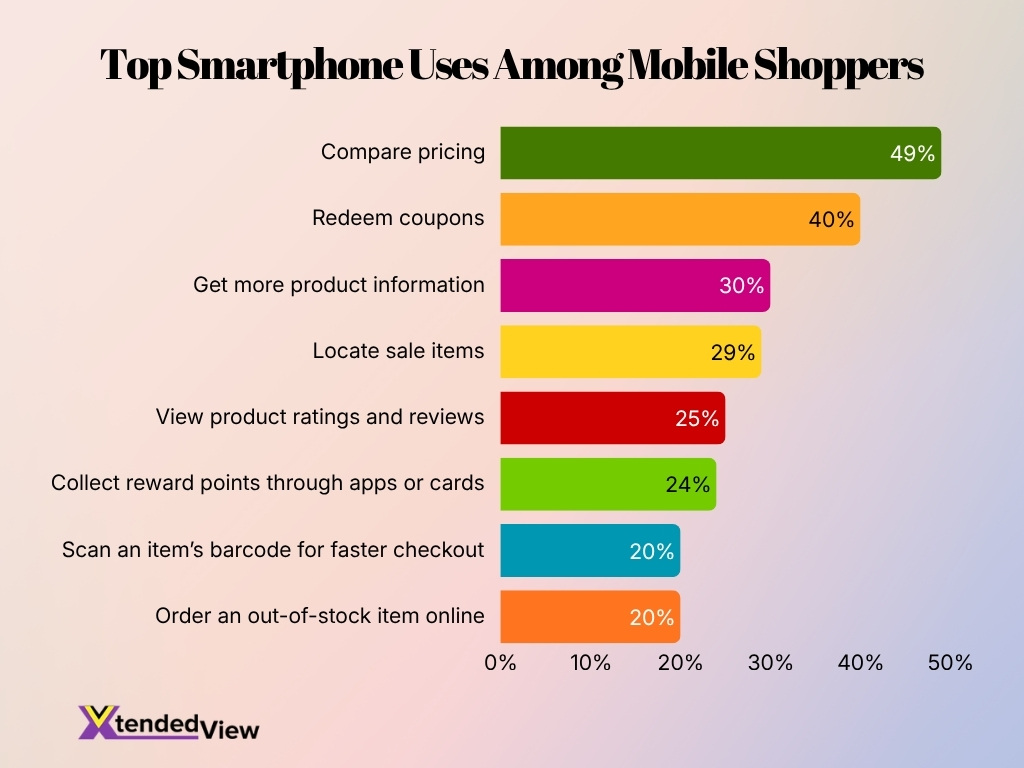
- Price comparison is the leading smartphone shopping activity, with 49% of mobile shoppers using their devices to compare prices before making a purchase.
- Coupon redemption ranks second at 40%, showing that mobile shoppers actively use smartphones to find discounts and reduce their total spending.
- Around 30% of shoppers use their smartphones to access additional product information, helping them make more informed buying decisions.
- Nearly 29% of mobile shoppers rely on their phones to locate sale items, highlighting the importance of mobile-friendly promotions and store information.
- Product ratings and reviews influence 25% of shoppers, as consumers increasingly check customer feedback while browsing in stores or online.
- About 24% of shoppers use smartphone apps or digital cards to collect reward points, reflecting growing engagement with mobile loyalty programs.
- Barcode scanning is used by 20% of shoppers to check product details and complete purchases more quickly.
- Another 20% of consumers use smartphones to order out-of-stock products online, allowing retailers to recover sales that might otherwise be lost.
Mobile Shopping Conversion Rates
- The average mobile e-commerce conversion rate reached approximately 2.41% in early 2026, slightly exceeding desktop in some recent benchmarks.
- Other industry benchmarks still show desktop converting at roughly 4.8% compared with 2.1% on mobile, depending on retailer and market segment.
- Mobile-first checkout experiences reduce abandonment by around 21% compared with desktop-first checkout designs.
- Autofill functionality lowers mobile abandonment by approximately 14% by minimizing manual typing.
- Digital wallets such as Apple Pay and Google Pay reduce mobile checkout abandonment by an average of 18%.
- Retail apps generally deliver stronger conversion rates than mobile websites because returning customers can complete purchases faster.
- AI-powered personalization increasingly improves conversion by presenting more relevant products throughout the shopping journey.
- Faster page speed, simplified forms, and trust signals remain among the most effective ways to improve mobile conversion rates.
Mobile Checkout Behavior
- Over 85% of mobile shoppers abandon their carts due to complex checkout forms.
- Offering guest checkout increases mobile conversion rates by up to 45%.
- Implementing one-click payments reduces average checkout time by over 60%.
- Nearly 70% of consumers prefer using biometric authentication for mobile purchases.
- Reducing checkout forms from 15 to 8 fields boosts mobile completions by 20%.
- About 65% of online shoppers start purchases on mobile devices before finishing on desktops.
- A 1-second delay in mobile checkout load times decreases conversions by 7%.
- Optimizing mobile checkout design yields a 35% increase in overall sales revenue.
- Utilizing digital wallets accelerates mobile checkout speeds by up to 50%.
- Almost 55% of mobile buyers abandon carts if required to create a new account.
Mobile Cart Abandonment Statistics
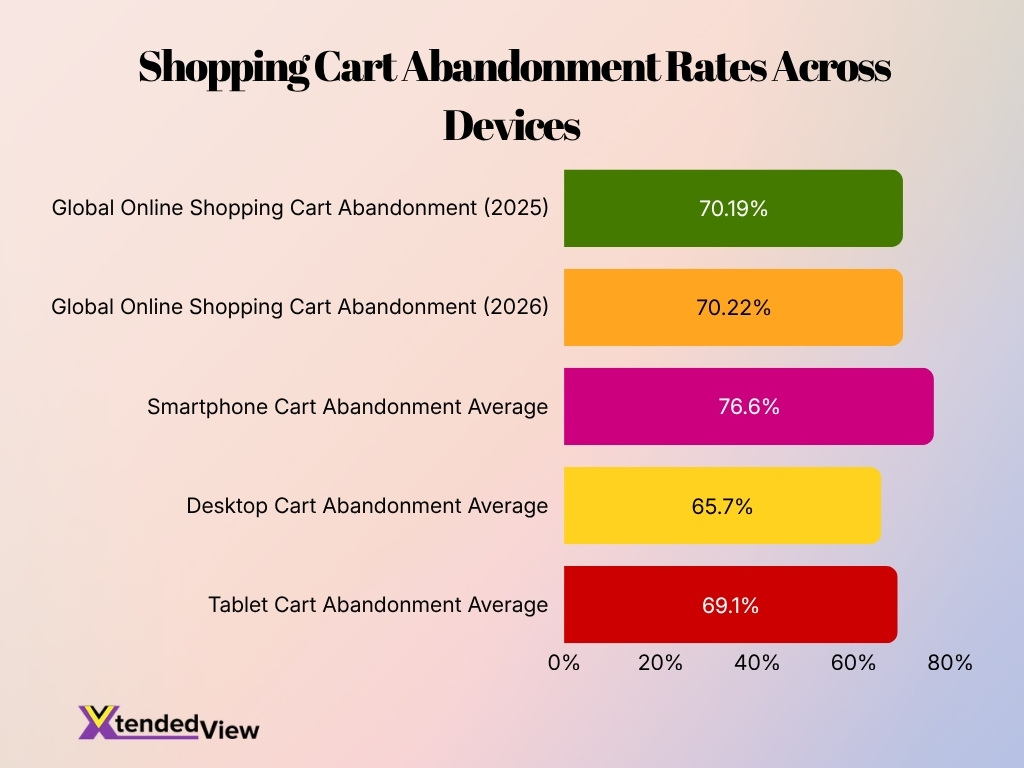
- The global online shopping cart abandonment rate reached 70.22% in 2026, compared with 70.19% in 2025.
- Smartphone cart abandonment averages approximately 76.6%, remaining substantially higher than desktop.
- Desktop cart abandonment averages around 65.7%, while tablets average 69.1%.
- Unexpected costs, lengthy checkout forms, and mandatory account creation remain the leading reasons shoppers abandon carts.
- Mobile websites experience significantly higher abandonment than native shopping apps.
- Cart synchronization across devices helps recover purchases that begin on smartphones and finish on desktop.
- Digital wallets and autofill tools continue reducing abandonment by simplifying payment and shipping information entry.
- Retailers increasingly deploy abandoned cart emails, push notifications, and retargeting campaigns to recover lost sales.
Mobile Payment Statistics
- Digital wallets will reach 5 billion users globally by 2026.
- The global mobile wallet market is projected to hit $18.0 billion in 2026.
- Mobile wallet integration reduces average cart abandonment by roughly 18%.
- The remote contactless payment segment will command a 61.5% market share in 2026.
- Over 60% of consumers prefer biometric authentication for secure mobile payments.
- Adding multiple payment methods can increase checkout conversion rates by 35.26%.
- The retail and e-commerce sector holds a 32.0% revenue share in mobile payments.
- The global mobile payment market is valued at $6.46 trillion for 2026.
Mobile Wallet Usage
- Global mobile wallet users reached 5.2 billion by late 2025.
- Digital wallets capture 52.5% of global e-commerce transaction value in 2025.
- The global mobile wallet market reached $16.2 billion in 2025.
- Gen Z consumers exhibit the highest adoption rate at 78.9% to 91%.
- Over 84% of mobile wallet users conduct peer-to-peer (P2P) transfers.
- QR code payments will drive 40% of global digital wallet volume by 2026.
- The Asia Pacific region holds a dominant 32.0% revenue share in 2025.
- Adult adoption rates in China reached an unprecedented 96%.
- India currently processes 46% of the world’s real-time transactions.
- Retail and in-store payments represent 33.92% of global market revenue.
Mobile Commerce Share by Country
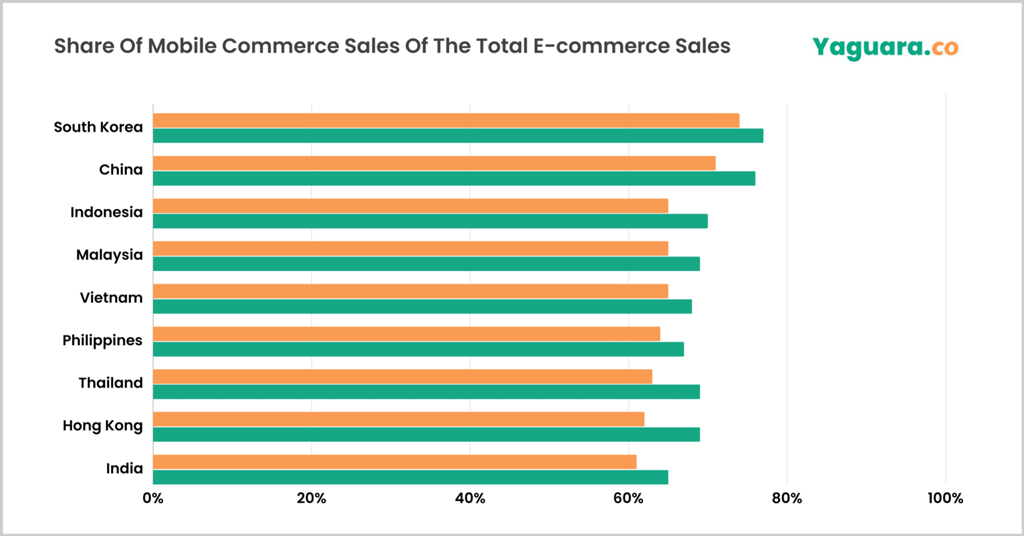
- South Korea leads the market, with mobile commerce accounting for 77% of online sales in 2026, up from 74% in 2022.
- China ranks second as its mobile commerce share rises by 5 percentage points, from 71% in 2022 to 76% in 2026.
- Indonesia records strong growth, increasing from 65% to 70%, which highlights the expanding role of smartphones in online shopping.
- Thailand and Hong Kong show the largest gains, with both markets increasing by 6 percentage points between 2022 and 2026.
- Malaysia’s mobile commerce share reaches 69% in 2026, compared with 65% in 2022, reflecting steady mobile shopping adoption.
- Vietnam and the Philippines both gain 3 percentage points, reaching 68% and 67%, respectively, in 2026.
- India remains the lowest-ranked market in the comparison, although its mobile commerce share still grows from 61% to 65%.
- By 2026, every country in the dataset is expected to generate at least 65% of its commerce through mobile devices, showing the dominance of mobile-first shopping across Asia.
Buy Now Pay Later Statistics
- During the 2024 U.S. holiday shopping season, consumers spent $18.2 billion through Buy Now, Pay Later (BNPL) services, an increase of 9.6% from the previous year.
- BNPL accounted for more than 7% of e-commerce sales during major holiday shopping events in late 2024.
- Retailers continue expanding BNPL availability because installment payment options generally increase average order values and purchase completion rates.
- Younger consumers remain the largest BNPL user group, although adoption among older shoppers continues to increase.
- Among UK consumers aged 55 to 64, BNPL usage increased from 10% in 2023 to 21% in 2024, representing one of the fastest-growing demographic segments.
- The Indian BNPL market is forecast to reach approximately $29.1 billion in 2026, reflecting continued double-digit annual growth.
- Industry forecasts expect India’s BNPL market to expand to nearly $53.9 billion by 2031.
- Growing integration with mobile wallets and one-click checkout continues making BNPL a standard payment option across online retail platforms.
Social Commerce and Mobile Shopping
- The global social commerce market is projected to reach $2.21 billion in 2026.
- This industry is anticipated to expand rapidly with a CAGR of 37.04% from 2026 to 2034.
- The global live commerce sector is forecast to grow to $230.3 billion in 2026.
- Social media platforms are predicted to command 45.7% of the live commerce market in 2026.
- The Asia Pacific region heavily dominated the live commerce industry with a 66.8% revenue share in 2025.
- The B2C segment primarily drives overall social commerce growth with a 52.00% market share.
- Personal and beauty care products accounted for a robust 24.00% share of social commerce sales in 2025.
- The fashion and apparel segment led live commerce product categories with a 20.6% revenue share in 2025.
Weekly Mobile Purchases by Age and Gender
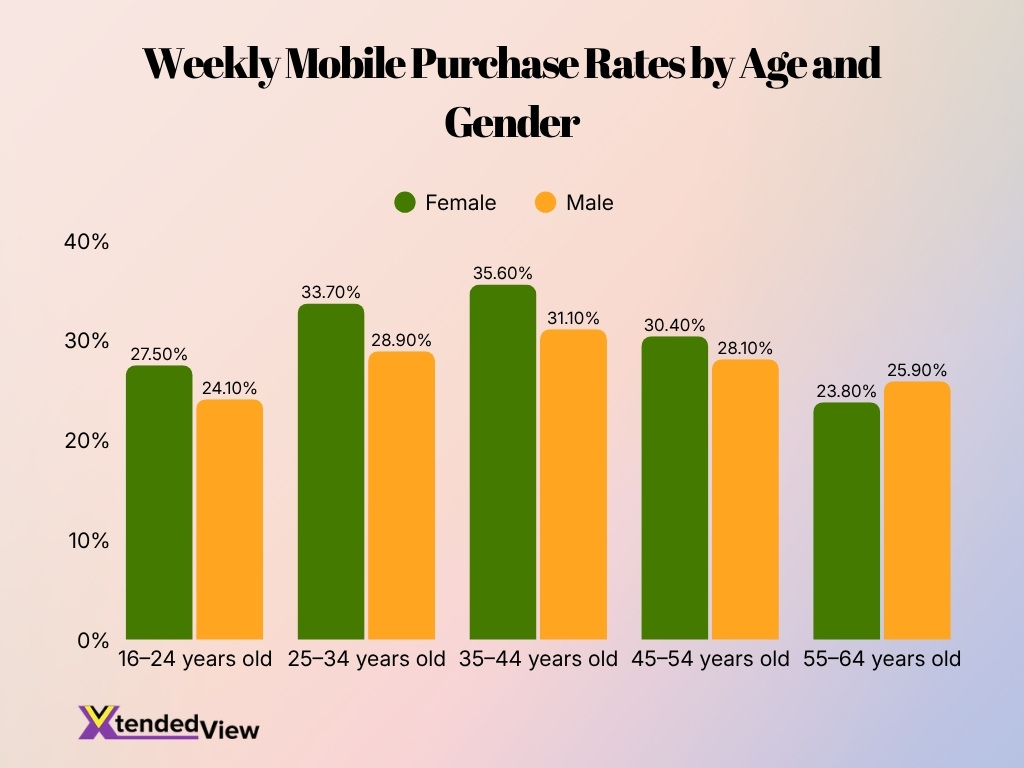
- Women aged 35–44 record the highest weekly mobile purchase rate at 35.60%, compared with 31.10% of men in the same age group.
- The 25–34 age group is also highly active, with 33.70% of women and 28.90% of men making mobile purchases every week.
- Among consumers aged 45–54, weekly mobile purchasing remains strong at 30.40% for women and 28.10% for men.
- Women lead men in weekly mobile purchases across the 16–24, 25–34, 35–44, and 45–54 age groups.
- The largest gender gap appears among 25–34-year-olds, where women lead men by 4.80 percentage points.
- The 55–64 age group is the only segment where men have a higher weekly purchase rate, at 25.90%, compared with 23.80% for women.
- Overall, the data suggests that middle-aged consumers, especially women aged 25–44, are the most frequent weekly mobile shoppers.
Mobile Shopping by Region
- Asia-Pacific dominated the mobile commerce sector with a 42.66% global market share in 2025.
- Digital wallets captured a massive 77% of e-commerce transaction value across the Asia-Pacific region in 2025.
- China led regional digital wallet usage with 82% of all e-commerce purchases completed via mobile apps.
- North America remained a key player by accounting for 37.21% of global mobile commerce spend in 2025.
- Global smartphone subscriptions reached 6.8 billion, covering 84% of the world’s population by 2025.
- Africa cemented its mobile money dominance by processing $1.4 trillion in transactions during 2025.
- The global mobile money ecosystem expanded to 593 million active 30-day accounts in 2025.
- Global mobile money platforms surpassed a record-breaking $2.1 trillion in transaction value in 2025.
Frequently Asked Questions (FAQs)
54.5% of U.S. online holiday purchases were completed on smartphones in 2024, up from 51.1% in 2023.
Global mobile commerce revenue was projected to reach approximately $2.5 trillion in 2025.
Digital wallets are forecast to account for 63% of global e-commerce transaction value by 2030.
U.S. consumers spent $18.2 billion through Buy Now, Pay Later services during the 2024 holiday shopping season, a 9.6% increase year over year.
The global online shopping cart abandonment rate reached approximately 70.22% in 2026.
Conclusion
Mobile shopping continues to transform the global retail landscape as smartphones become the preferred device for browsing, purchasing, and making digital payments. The continued growth of digital wallets, Buy Now, Pay Later services, AI-powered personalization, and social commerce is making mobile shopping more convenient while driving higher consumer engagement. As smartphone adoption and payment innovation continue to accelerate, mobile commerce is expected to account for an even larger share of global online retail spending in the years ahead.
