



Temu has become one of the fastest-growing global e-commerce marketplaces by combining low prices, cross-border fulfillment, and an app-first shopping experience. Its rapid expansion continues to influence online retail, digital advertising, and supply chain strategies across the US and international markets. Retailers use Temu’s pricing model to benchmark competitive offers, while brands and logistics providers monitor its growth to adapt their own strategies. Explore the statistics below to understand how Temu’s business, users, and market position continue to evolve.
Overview of Temu
- Temu launched in September 2022 and operates as the international marketplace owned by PDD Holdings.
- By the end of 2025, Temu served shoppers across major markets including the United States, Canada, the United Kingdom, Germany, France, Italy, and Japan, along with many additional countries and regions.
- Temu follows a marketplace model that primarily connects China-based merchants with overseas consumers through cross-border fulfillment.
- The platform partners with third-party logistics providers and fulfillment companies instead of operating a traditional retail inventory model.
- Temu focuses on categories including fashion, home goods, electronics, beauty, toys, pet supplies, and lifestyle products.
- PDD Holdings reported that Temu and Pinduoduo share a similar operating model centered on merchant services, interactive shopping experiences, and competitive pricing.
- Revenue across PDD Holdings reached RMB 431.85 billion (US$61.75 billion) in 2025, highlighting continued platform expansion, although the company does not disclose Temu as a separate revenue segment.
- During 2025, the company continued investing in branding, merchant growth, and consumer acquisition to strengthen Temu’s international presence.
Editor’s Choice
- Temu expanded into dozens of international markets within just three years after launching in 2022.
- PDD Holdings generated US$61.75 billion in total revenue during 2025, up from US$56.3 billion equivalent (RMB 393.84 billion) in 2024.
- Total company revenue increased 9.7% year over year between 2024 and 2025.
- Transaction services contributed 49.6% of total company revenue in 2025, while online marketing services accounted for 50.4%.
- The company increased transaction service revenue from RMB 195.9 billion in 2024 to RMB 214.1 billion in 2025.
- Merchant demand for value-added services continued to grow as the number of active merchants increased during 2025.
- Despite global expansion, Temu faced increasing regulatory reviews across multiple countries during 2025 and 2026, including investigations related to consumer protection, advertising, product safety, and data privacy.
Recent Developments
- During 2026, PDD Holdings reported that Temu continued operating in major international markets while investing heavily in long-term global growth.
- The company acknowledged that increasing competition and international regulatory scrutiny may affect future growth rates.
- Multiple governments continued reviewing Temu’s compliance with consumer protection, environmental, privacy, and product safety regulations.
- PDD Holdings reported 2025 revenue of RMB 431.85 billion, representing 9.7% annual growth over 2024.
- During early 2026, quarterly revenue reached RMB 123.9 billion, although results fell slightly below analyst expectations because of higher investment spending and competitive pressure.
- Company executives stated that additional investment in supply chain capabilities would continue despite near-term pressure on earnings.
- Trade policy changes in the United States and tighter rules affecting low-value imports have increased operating challenges for Temu’s cross-border business during 2025 and 2026.
- The company continues expanding merchant services while adapting fulfillment strategies to changing international regulations.
Temu Revenue and GMV Growth Highlights
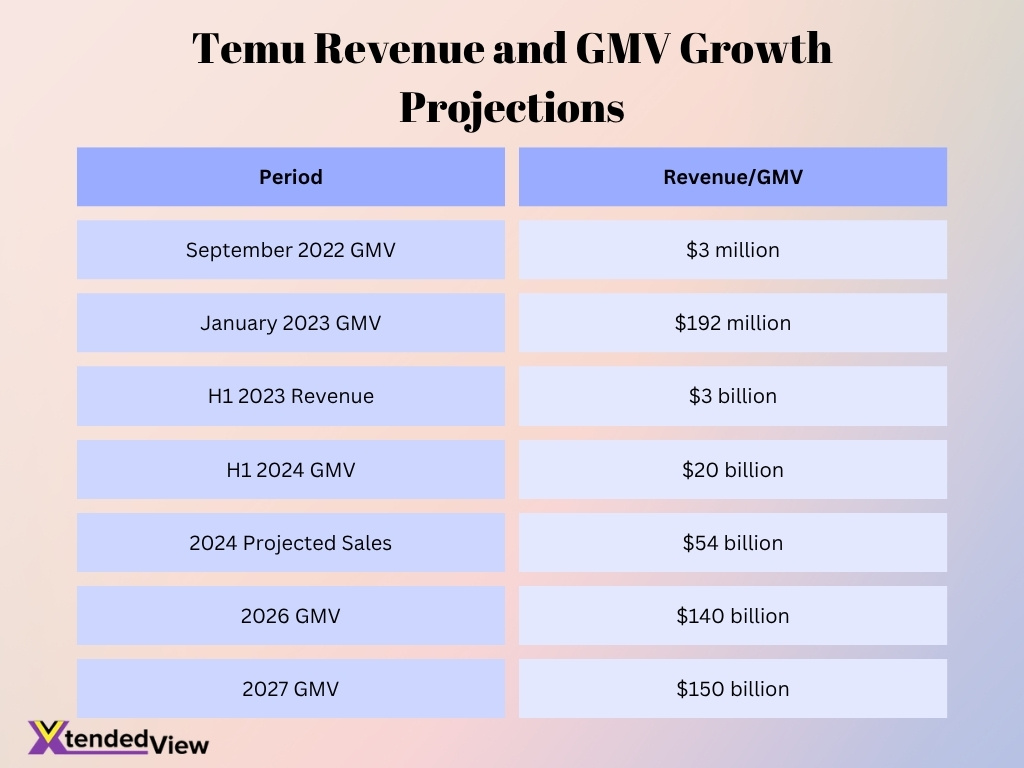
- Temu’s GMV increased dramatically from just $3 million in September 2022 to $192 million by January 2023, reflecting its rapid early expansion.
- In the first half of 2023, Temu generated approximately $3 billion in revenue, highlighting the platform’s fast-growing commercial scale.
- Temu’s GMV reached $20 billion in H1 2024, demonstrating substantial momentum within less than two years of its launch.
- For the full year 2024, Temu’s projected sales were estimated at around $54 billion, indicating continued expansion in global e-commerce.
- Temu’s GMV is projected to climb to approximately $140 billion by 2026, representing a major increase from its early operating years.
- By 2027, Temu’s GMV is projected to reach $150 billion, about 50,000 times its September 2022 GMV of $3 million.
Temu User and Download Statistics
- Temu reached over 1 billion cumulative downloads globally by the second quarter of 2025.
- The platform’s global monthly active users surged to 416.5 million in Q2 2025.
- Temu recorded a massive 2.11 billion website visits globally in just the month of June 2025.
- The United States accounts for approximately 31.6% of Temu’s total global web traffic.
- In early 2025, the application maintained 185.6 million monthly active users strictly within the US market.
- The marketplace expanded its inventory to offer roughly 10 million distinct SKUs to consumers worldwide.
- The company’s gross merchandise value (GMV) reached an estimated $70.8 billion globally in 2024.
- Temu successfully captured a 17% market share within the US discount e-commerce sector in 2025.
- The platform supports a growing merchant base of around 200,000 international sellers globally.
Temu Market Share and Growth Statistics
- The platform reached 416.5 million monthly active users globally by the second quarter of 2025.
- Annual gross merchandise volume for the marketplace surged to $70.8 billion throughout 2024.
- The shopping application surpassed 1 billion cumulative global downloads by the middle of 2025.
- Shoppers spend an average of 21 minutes per day actively engaging with the mobile app.
- The company rapidly secured a 17% market share within the U.S. discount e-commerce sector.
- The e-commerce website generated 2.11 billion total visits from global consumers in June 2025.
- The European Union currently represents 34% of the platform’s entire global user base.
- Operations have successfully expanded into more than 90 international markets across the world.
- The marketplace supports approximately 200,000 international merchants and 100,000 U.S. sellers.
Temu User Demographics
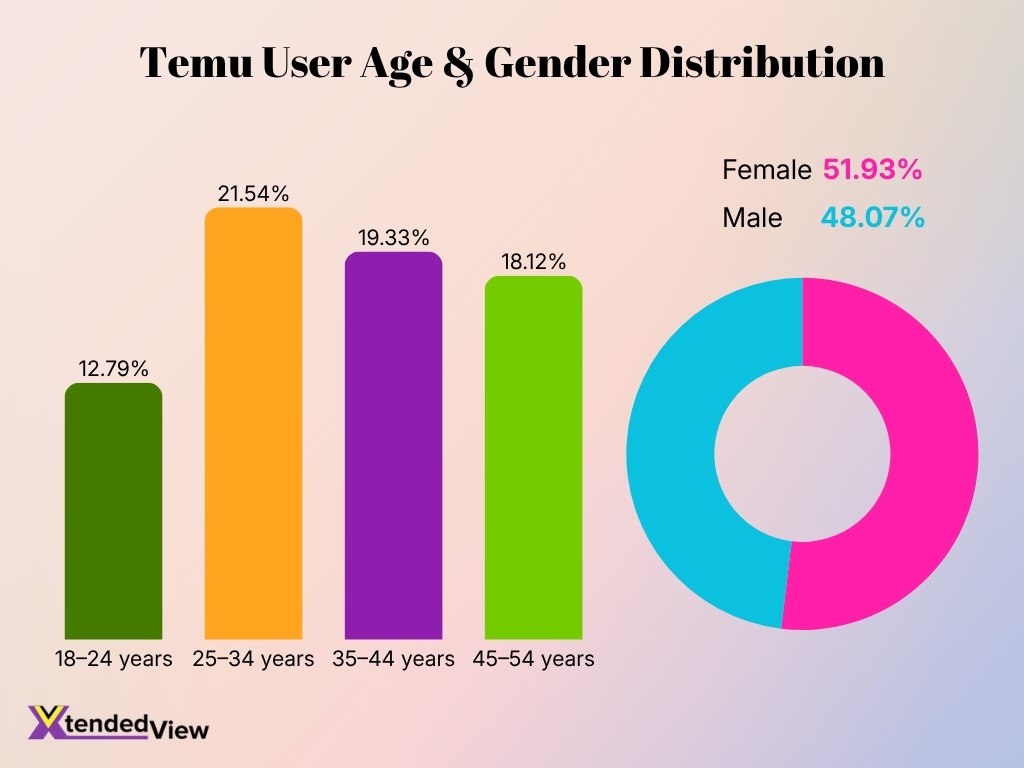
- Female users represented 51.93% of Temu’s audience, while male users accounted for 48.07%, indicating a nearly balanced customer base.
- Adults aged 25–34 years formed Temu’s largest age group, representing 21.54% of users.
- Consumers aged 35–44 years accounted for 19.33% of total users.
- The 45–54-year-old segment contributed 18.12% of the platform’s audience.
- Users aged 18–24 years represented 12.79%, making younger adults a smaller share of Temu’s customer base than many social commerce platforms.
- Referral traffic from news and media publishers accounted for 31.68% of referred visits, making it Temu’s largest referral category.
- Coupons and rebate websites generated 8.81% of referral traffic, reflecting strong price-sensitive shopping behavior.
- Independent traffic estimates placed Temu’s monthly website audience at approximately 286.6 million visits during the measured period, demonstrating strong consumer engagement.
- The platform continues attracting a broad demographic through low pricing, frequent promotions, and an expanding product catalog.
Temu Traffic and Website Analytics
- Temu ranked among the top three global e-commerce marketplaces by web traffic during 2025, reflecting sustained international growth.
- Between June and August 2025, Temu averaged 1.63 billion monthly visits and approximately 435 million unique monthly visitors, making it the second most-visited shopping website globally.
- Amazon remained the global leader with about 2.71 billion monthly visits, while Temu maintained a significant lead over many competing marketplaces.
- The United States generated 29.91% of Temu’s website traffic in early 2025, followed by Brazil (9.72%), Mexico (5.68%), Germany (4.11%), and Chile (3.75%).
- In 2025, Temu.com recorded 89.77% year-over-year traffic growth, highlighting continued expansion despite a maturing user base.
- Several emerging markets showed exceptionally high engagement. Visitors from Zambia averaged nearly 26 minutes per visit, while users in Azerbaijan viewed around 31 pages per session.
- Earlier growth trends demonstrated Temu’s rapid scale, with global web traffic exceeding 326 million monthly visits after increasing more than 4,000% year over year during its early expansion.
- Similarweb estimates also showed Temu becoming the second-largest e-commerce marketplace website worldwide by web visits, surpassing several long-established competitors.
- Mobile-first engagement remains central to Temu’s strategy, with website visitors frequently encouraged to complete purchases through the app.
temu.com Web Traffic by Country
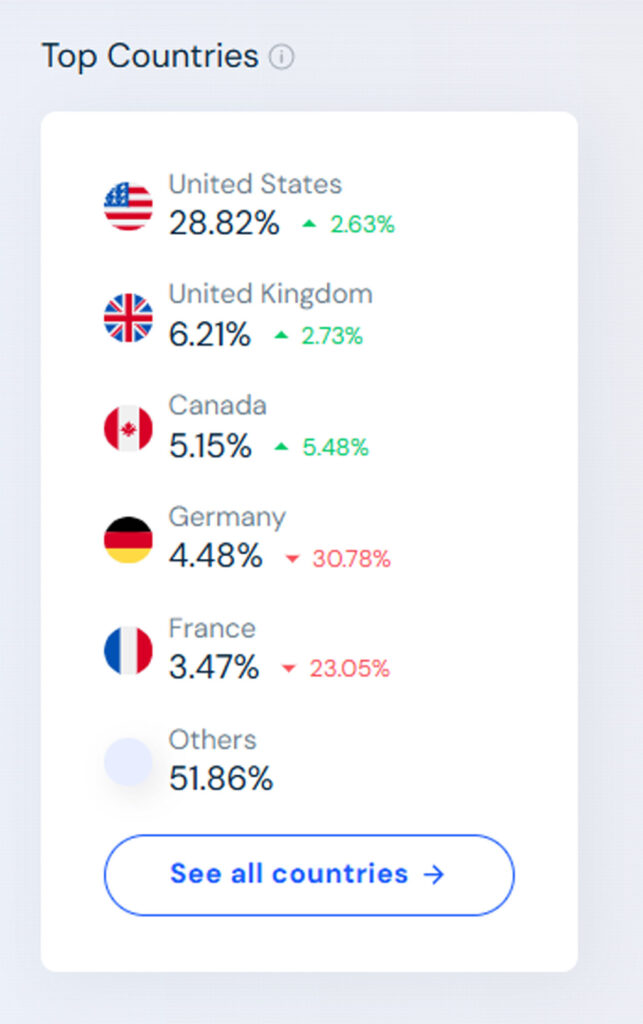
- The United States is Temu’s largest individual traffic market, accounting for 28.82% of total temu.com web traffic, with traffic increasing by 2.63%.
- The United Kingdom ranks second among individual countries, contributing 6.21% of website traffic and recording a 2.73% increase.
- Canada generates 5.15% of Temu’s web traffic and posted the strongest growth among the listed countries, rising by 5.48%.
- Germany represents 4.48% of temu.com traffic, but its traffic declined sharply by 30.78%, the largest decrease among the countries shown.
- France contributes 3.47% of total website traffic and experienced a substantial 23.05% decline.
- Other countries collectively account for 51.86% of temu.com traffic, indicating that more than half of Temu’s web audience comes from markets outside the five leading countries.
Temu App Performance and Rankings
- Temu ranked as the second-largest cross-platform e-commerce platform globally in early 2026 based on combined web and mobile audience size.
- Mobile monthly active users increased 24% year over year, outperforming many established global marketplaces.
- During 2025, Temu remained one of the world’s most downloaded shopping applications, leading the shopping category by downloads.
- The app recorded approximately 398 million downloads during 2025 despite a modest year-over-year decline.
- Similarweb estimated 246.4 million monthly active app users, placing Temu behind only Shopee among leading shopping apps in one global comparison.
- In the United States, Temu ranked as the second most popular e-commerce app, trailing Amazon but ahead of most other shopping competitors.
- Earlier US estimates showed approximately 185.6 million monthly active users, narrowing the gap with Amazon’s shopping app.
- Temu’s app-first strategy emphasizes gamification, personalized offers, coupons, and reward programs to increase repeat engagement.
- App usage continues growing faster than web usage in several international markets, reflecting broader consumer preference for mobile commerce.
Temu Seller and Product Statistics
- The platform offers roughly 10 million Stock Keeping Units (SKUs) across its global marketplace.
- There are currently around 100,000 sellers in the U.S. and 200,000 international merchants actively trading.
- The company aims to rapidly expand its merchant network to 200,000 U.S. sellers and 300,000 international sellers.
- Within the U.S. market alone, consumers have access to approximately 2 million distinct items.
- Roughly 25% of U.S. gross merchandise volume now comes from sellers utilizing local U.S. and European warehouses.
- Household Itemsand Shoes are among the most popular product categories, each driving 35% of purchases.
- Manufacturers are charged a commission on completed transactions that typically ranges from 5% to 20%.
- The marketplace facilitates immense daily activity, moving roughly $112 million in merchandise every single day.
Temu vs. Competitors Statistics
- Amazon remained the largest global shopping website with 2.71 billion monthly visits, while Temu ranked second at 1.63 billion monthly visits during mid-2025.
- AliExpress ranked third with approximately 646 million monthly visits, well behind Temu’s traffic volume.
- Walmart averaged roughly 506 million monthly visits, placing behind Temu among global shopping websites.
- eBay recorded approximately 635 million monthly visits, also trailing Temu’s global traffic.
- In the US mobile commerce market, Amazon maintained about 237.6 million monthly active users, compared with 185.6 million for Temu.
- Temu’s estimated desktop conversion rate reached 4.6%, slightly below SHEIN’s 4.7%, but ahead of several apparel-focused competitors.
- Amazon’s estimated desktop conversion rate remained substantially higher at 11.8%, demonstrating stronger purchase efficiency.
- Temu was identified as the second-largest global cross-platform marketplace, behind only Amazon.
- Competition among Amazon, SHEIN, AliExpress, Walmart Marketplace, and Temu continues driving aggressive pricing, marketing, and logistics investment worldwide.

Temu Consumer Behavior Statistics
- Gamified shopping promotions have helped maintain an impressive 75% return user rate among active buyers.
- Independent analysis estimated a 4.6% desktop conversion rate in the US, indicating strong purchase intent among visitors.
- Over 90% of total visits occur directly on the mobile app, where users access exclusive daily rewards.
- Approximately 53% of platform consumers explicitly cite low prices as their primary reason for shopping.
- Highly personalized product recommendations drive an impressive average session duration of over 14 minutes.
- Older shoppers aged 59 and above demonstrate the highest retention by averaging 5.6 transactions per year.
- Value-conscious consumers steadily increased their average order value to $38.90 due to aggressive discounting.
- The strategy of low prices and product variety generated over 412.3 million total orders globally in a single year.
- Global expansion efforts resulted in the Americas region capturing 42% of overall operations and shaping market trends.
Temu Marketing and Advertising Statistics
- PDD Holdings spent RMB 125.29 billion (US$17.92 billion) on sales and marketing during 2025, compared with RMB 111.30 billion in 2024.
- Sales and marketing expenses represented 29.0% of total revenue in 2025, compared with 28.3% in the previous year.
- The company attributed stronger merchant participation partly to continued global branding campaigns and expanded promotional efforts.
- Marketing campaigns contributed to greater user engagement by promoting wider merchandise selection and value-focused shopping experiences.
- Direct buyer traffic continues to originate from both word-of-mouth referrals and paid marketing initiatives.
- During the second quarter of 2025, Temu significantly reduced U.S. advertising spending following changes to U.S. import rules and shifted its acquisition strategy toward other international markets.
- Despite lower U.S. marketing investment, international user growth accelerated, with approximately 90% of Temu’s 405 million monthly users located outside the United States.
- PDD Holdings continues emphasizing brand awareness alongside customer acquisition to strengthen Temu’s competitive position globally.
- The company expects continued marketing investment as competition intensifies across international e-commerce markets.
Temu Advertising Spend by Channel
- Meta dominated Temu’s advertising strategy, with spending reaching $359 million in Q4 2025, substantially higher than every other listed platform.
- Temu spent $32.5 million on TikTok, making it the second-largest advertising channel among the four platforms.
- AppLovin received $22.8 million in advertising spend, placing it ahead of Google during the quarter.
- Temu allocated $20 million to Google advertising, the lowest amount among the four channels included in the data.
- Combined spending across Meta, TikTok, Google, and AppLovin reached $434.3 million during Q4 2025.
- Meta accounted for approximately 82.7% of the combined advertising spend across these four channels, highlighting Temu’s heavy reliance on the platform.
- Temu spent roughly 11 times more on Meta than TikTok, demonstrating a significant gap between its largest and second-largest advertising channels.

Temu Business Model Statistics
- Temu operates as a third-party marketplace where merchants list products while the platform earns revenue primarily through transaction services and online marketing services.
- PDD Holdings reported RMB 431.85 billion (US$61.75 billion) in total revenue for 2025, up from RMB 393.84 billion in 2024.
- Revenue from transaction services increased from RMB 195.90 billion in 2024 to RMB 214.06 billion in 2025.
- Revenue from online marketing services and related services reached RMB 217.78 billion in 2025, reflecting stronger merchant activity and higher platform engagement.
- Average transaction service revenue per active merchant increased from RMB 12,399 in 2024 to RMB 12,742 in 2025.
- Temu partners with a global network of logistics and fulfillment providers, enabling merchants to reach international buyers without building their own overseas distribution networks.
- The platform primarily serves China-based merchants, while expanding access to consumers across North America, Europe, Oceania, and other international markets.
- PDD Holdings stated that Temu and Pinduoduo share the same operational philosophy, focusing on competitive pricing, merchant services, and interactive shopping experiences.
- Management continues investing in sourcing, fulfillment, merchant tools, and platform infrastructure to support long-term marketplace growth.
Temu Shipping and Logistics Statistics
- Temu currently ships approximately 2.3 million parcels globally every single day.
- International freight and storage represent 43% of the company’s total logistics costs in the US market.
- The platform aims to fulfill 80% of its European orders using local regional warehouses.
- Customs clearance operations account for roughly 9% of Temu’s overall supply chain expenses.
- The platform’s return logistics costs make up 3.2% of its total sales volume.
- Managing returns and exchanges consumes exactly 10% of the total logistics budget.
- Fluctuations in air capacity and multi-level customs push comprehensive logistics costs up by 18% to 25%.
- The average return processing time for Temu is currently 125% longer than competing e-commerce platforms.
- The company’s extensive global fulfillment operations are projected to handle 840 million parcels annually by 2026.
Social Media Traffic to Temu.com
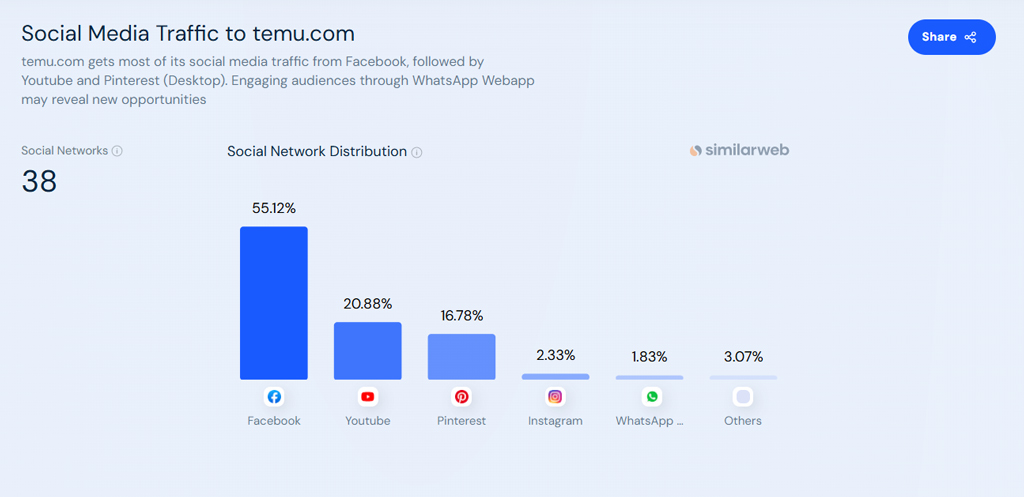
- Facebook dominates Temu’s social media traffic, accounting for 55.12% of visits from social platforms, more than half of the total social traffic.
- YouTube ranks second among Temu’s social traffic sources with a 20.88% share, highlighting the importance of video-driven discovery and referrals.
- Pinterest contributes 16.78% of Temu’s social media traffic, making it the third-largest social referral source for the shopping platform.
- Together, Facebook, YouTube, and Pinterest generate 92.78% of Temu’s social media traffic, showing that referrals are heavily concentrated across these three platforms.
- Instagram accounts for only 2.33% of social traffic to Temu.com, significantly trailing Facebook, YouTube, and Pinterest.
- WhatsApp contributes 1.83%, representing the smallest individually reported share among the major social networks shown.
- Other social platforms collectively account for 3.07% of Temu’s social traffic, indicating relatively limited traffic diversification beyond its leading channels.
- Temu receives social media traffic from 38 social networks, although the overwhelming majority of that traffic comes from a small group of leading platforms.
Temu Regulatory and Compliance Statistics
- The platform reported 92 million monthly active users in the EU, drastically exceeding the 45 million threshold for Very Large Online Platform status.
- The European Commission levied a massive €200 million fine in May 2026 for systemic failures in preventing illegal product sales.
- Independent consumer safety tests revealed that a staggering 95% of toys purchased from the marketplace failed European safety standards.
- Ongoing violations of the Digital Services Act could result in severe penalties reaching up to 6% of the company’s global annual revenue.
- Active regulatory investigations and consumer protection inquiries are currently proceeding across at least 8 major international jurisdictions.
- Government authorities officially suspended marketplace operations in 2 separate countries within a remarkably short 4-month regulatory window.
- Certain hazardous consumer products tested from the platform contained dangerous chemical levels measuring exactly 11 times the legal safety limit.
- The company’s rapidly scaling operations saw Gross Merchandise Volume hit $70.8 billion, accelerating widespread regulatory scrutiny over trade practices.
Temu Future Projections and Targets
- Temu’s e-commerce revenue is projected to reach $92.5 billion by 2025.
- The platform’s gross merchandise volume is forecast to potentially hit $140 billion by 2027.
- Monthly active users are expected to stabilize around 292 million globally across 90 international markets.
- Total cumulative app downloads are projected to surpass the 1 billion mark by mid-2025.
- The platform aims to maintain its 17% market share in the discount e-commerce sector in the United States.
- Monthly website traffic is projected to consistently exceed 2.11 billion visits globally.
- Annual e-commerce sales are expected to show a 72% year-over-year growth in 2025.
- The United States market currently accounts for over 40% of the platform’s total application downloads.
Frequently Asked Questions (FAQs)
Temu had approximately 405 million global monthly active users in 2025, with around 90% of them located outside the United States.
Temu surpassed 1.2 billion cumulative global app downloads by October 2025.
PDD Holdings, Temu’s parent company, reported RMB 431.85 billion (US$61.75 billion) in total revenue for 2025.
Temu.com recorded about 1.22 billion monthly visits during the latest measured period in 2026.
Temu ranked as the second-largest global cross-platform e-commerce platform in 2026, behind Amazon.
Conclusion
Temu has established itself as one of the most influential players in global e-commerce in just a few years, driven by rapid international expansion, aggressive customer acquisition, and a marketplace model focused on value-conscious shoppers. The latest statistics show continued growth in revenue, website traffic, app downloads, merchant participation, and global market presence, even as the company faces increasing competition and heightened regulatory scrutiny across several countries. Investments in logistics, technology, marketing, and localized fulfillment continue to strengthen Temu’s ability to serve customers in diverse markets.
Looking ahead, Temu’s long-term success will depend on its ability to balance growth with profitability while adapting to evolving trade policies, consumer expectations, and regulatory requirements. As the company continues expanding its global footprint and enhancing its marketplace ecosystem, it is expected to remain a significant force influencing online retail, cross-border commerce, and digital marketplace innovation for years to come.
