Microsoft continues to shape the global technology landscape through cloud computing, artificial intelligence, productivity software, enterprise infrastructure, and consumer devices. Organizations rely on Microsoft solutions to power digital workplaces, while developers, governments, and Fortune 500 companies use its platforms to build AI-driven applications and modern cloud services. This article explores the latest Microsoft statistics, helping readers understand the company’s growth, market position, and business performance through the most recent data available.
Editor’s Choice
- Microsoft generated $281.7 billion in revenue during fiscal year 2025, representing a 15% year-over-year increase.
- The company reported $101.8 billion in net income for FY2025, up 16% from FY2024.
- Microsoft Cloud revenue reached $46.7 billion in the fourth quarter of FY2025, increasing 27% year over year.
- Azure surpassed $75 billion in annual revenue during FY2025 after growing 34% year over year.
- Microsoft reported $81.3 billion in revenue for the quarter ending December 31, 2025 (Q2 FY2026), an increase of 17% from the previous year.
- Microsoft returned $9.4 billion to shareholders through dividends and share repurchases during Q4 FY2025.
- Microsoft now operates more than 400 data centers worldwide, supporting rapid AI and cloud infrastructure expansion.
Recent Developments
- In January 2026, Microsoft announced quarterly revenue of $81.3 billion, reflecting continued momentum across cloud and AI businesses.
- During the same quarter, operating income climbed 21% year over year to $38.3 billion.
- Microsoft’s GAAP net income reached $38.5 billion in Q2 FY2026, representing 60% annual growth, aided by investment gains.
- Azure and other cloud services posted 39% annual revenue growth during Q2 FY2026.
- Microsoft stated that its AI business has already grown into one of the company’s largest commercial businesses by early 2026.
- Microsoft expanded AI infrastructure investments to support increasing enterprise demand for generative AI services.
- The company continues integrating Copilot capabilities across Microsoft 365, Windows, GitHub, Azure, and Dynamics to strengthen enterprise adoption.
- Microsoft increased capital investments in AI infrastructure, with planned spending reaching approximately $30 billion in the following quarter.
Microsoft Annual Revenue Growth
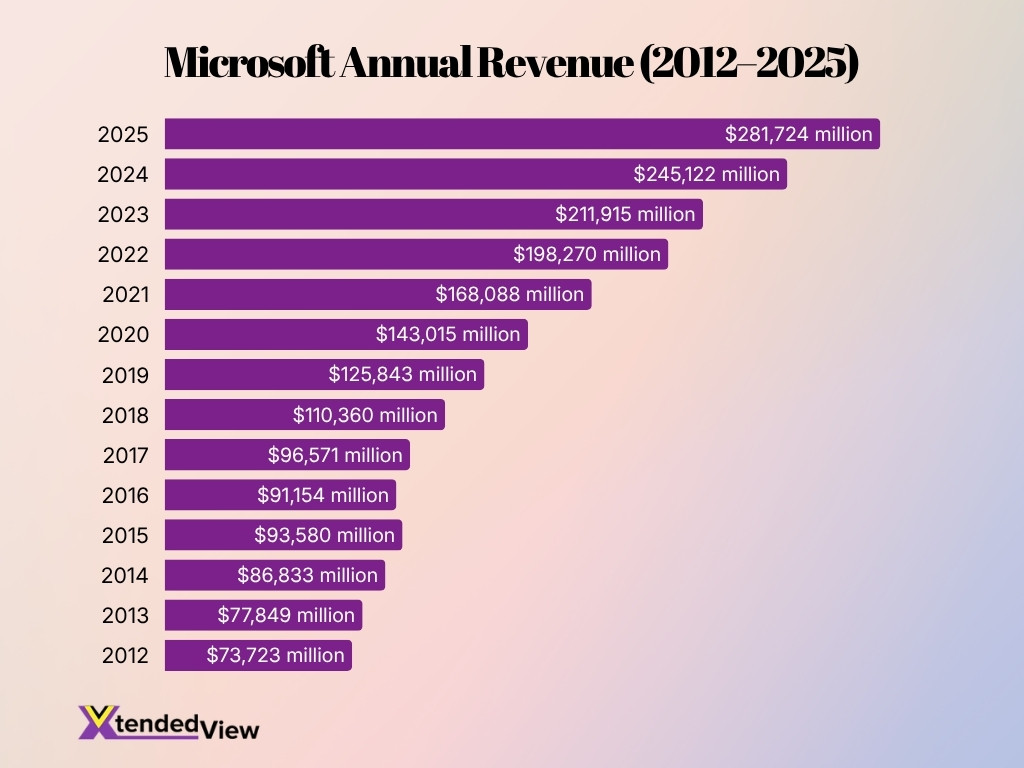
- Microsoft’s annual revenue reached a record $281.72 billion in 2025, up from $245.12 billion in 2024.
- Revenue increased by approximately $36.60 billion between 2024 and 2025, representing growth of nearly 14.9%.
- Microsoft crossed the $200 billion annual revenue mark for the first time in 2023, generating $211.92 billion.
- The company’s revenue rose from $168.09 billion in 2021 to $198.27 billion in 2022, an increase of about 18%.
- Between 2020 and 2025, Microsoft’s annual revenue nearly doubled from $143.02 billion to $281.72 billion.
- Microsoft generated $125.84 billion in 2019, marking the beginning of a sustained period of strong double-digit revenue expansion.
- Revenue surpassed $100 billion for the first time in 2018, reaching approximately $110.36 billion.
- Microsoft experienced a slight revenue decline from $93.58 billion in 2015 to $91.15 billion in 2016, before returning to growth in 2017.
- From 2012 to 2025, Microsoft’s annual revenue increased by more than $208 billion, rising from $73.72 billion to $281.72 billion.
- Overall, Microsoft’s revenue expanded by approximately 282% between 2012 and 2025, reflecting strong long-term business growth.
Microsoft Market Share Statistics
- Microsoft remains one of the three largest global cloud infrastructure providers, led by Azure’s continued expansion.
- Azure generated more than $75 billion in annual revenue during FY2025, strengthening Microsoft’s position in enterprise cloud computing.
- Microsoft 365 Commercial continued expanding through 6% seat growth during FY2025.
- Microsoft’s commercial cloud portfolio continued to gain enterprise adoption through Azure, Microsoft 365, Dynamics 365, and Power Platform.
- Search and news advertising revenue excluding traffic acquisition costs increased 20% during FY2025, improving Microsoft’s position in digital search advertising.
- Gaming revenue increased 9% in FY2025, supported by Xbox content and subscription services.
- LinkedIn revenue increased 9% during FY2025, reinforcing Microsoft’s position in the professional networking market.
- Dynamics 365 revenue grew 19% in FY2025, reflecting continued demand for Microsoft’s business applications.
Microsoft User Statistics
- Microsoft 365 Consumer subscriptions reached 89 million subscribers during FY2025.
- Microsoft 365 Consumer subscriber count increased 8% year over year.
- Microsoft 365 Consumer cloud revenue increased 11% during FY2025, supported by subscriber growth and pricing updates.
- Microsoft 365 Commercial seat growth reached 6%, driven primarily by small and medium-sized businesses.
- Azure continued attracting enterprise customers across AI, analytics, databases, and application development services.
- LinkedIn maintained revenue growth across all business lines during FY2025, indicating continued user engagement.
- Microsoft’s AI-powered Copilot experiences expanded across consumer and enterprise products throughout 2025 and into 2026.
- Enterprise demand for Microsoft Cloud services remained a primary driver of customer expansion entering FY2026.
Global Browser Market Share
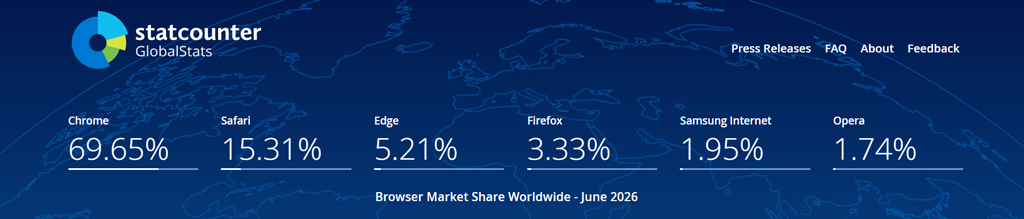
- Chrome dominates the worldwide browser market with a commanding 69.65% share as of June 2026.
- Safari ranks second with 15.31%, trailing Chrome by more than 54 percentage points.
- Microsoft Edge holds the third position with a 5.21% global market share.
- Firefox accounts for 3.33% of worldwide browser usage, placing it fourth.
- Samsung Internet captures 1.95% of the market, supported largely by Samsung mobile devices.
- Opera represents 1.74% of global browser usage, making it the smallest among the six listed browsers.
- Together, Chrome and Safari control 84.96% of the global browser market.
- The top six browsers collectively account for 97.19% of worldwide browser usage.
Microsoft Employee Statistics
- Microsoft maintained a global workforce of approximately 228,000 employees during FY2025.
- The company reduced its headcount by roughly 15,000 positions during this period.
- Hiring investments significantly increased for cloud engineering and AI research teams.
- Increased operating expenses were driven by new cloud and AI engineering talent.
- Engineering expansion focused strictly on AI infrastructure, Copilot, and Azure services.
- The data center workforce expanded to manage operations across more than 400 global facilities.
- Strategic hiring targeted specialists in cybersecurity, cloud architecture, and AI research.
- The 2025 workforce strategy prioritized productivity improvements alongside high-growth AI investments.
Microsoft Windows Statistics
- Windows OEM and Devices revenue increased by 3% during fiscal 2025.
- Windows 10 support officially concluded on Oct. 14, 2025.
- Windows 11 minimum requirements include a 1 GHz dual-core processor, 4 GB RAM, and 64 GB storage.
- Upgrading to Windows 11 strictly requires UEFI Secure Boot and TPM 2.0 hardware.
- Copilot+ PCs demand a neural processing unit achieving over 40 trillion operations per second.
- Windows 11 Pro PCs can complete demanding workloads 42% faster on average.
- Windows 11 mandates displays larger than 9 inches with a minimum 720p resolution.
- Microsoft continued servicing Windows 11 versions 24H2 and 25H2 during 2026.
Microsoft Products and Services Statistics
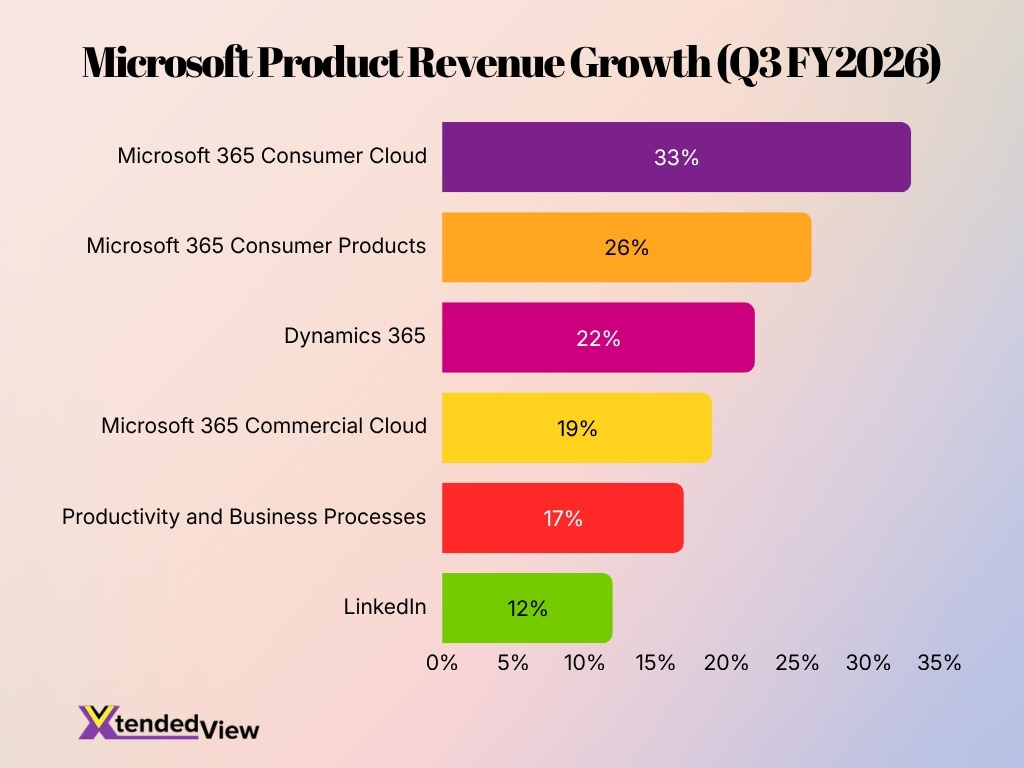
- Productivity and Business Processes revenue reached $35 billion in Microsoft’s fiscal third quarter of 2026, up 17% year over year.
- Dynamics 365 revenue increased 22% in the same quarter, compared with 19% growth in the comparable fiscal 2025 period.
- LinkedIn revenue grew 12% year over year in fiscal Q3 2026, adding approximately $521 million in quarterly revenue.
- Microsoft 365 Commercial cloud revenue rose 19% in fiscal Q3 2026, or 15% in constant currency.
- Microsoft 365 Consumer products and cloud services revenue increased 26%, including 33% growth in consumer cloud revenue.
- Microsoft 365 Commercial seat growth held at 6% during fiscal Q3 2026, continuing the same growth rate reported across several recent quarters.
- Microsoft’s Productivity and Business Processes portfolio includes Microsoft 365, LinkedIn, Dynamics 365, Power Apps, Power Automate and related business software.
- In fiscal 2025, Dynamics 365 revenue grew 19%, while LinkedIn revenue increased 9%, showing broad demand across enterprise applications and professional services.
Microsoft Office and Microsoft 365 Statistics
- Microsoft 365 Consumer subscriptions reached 89 million at the end of fiscal 2025, up 8% from the previous year.
- The consumer subscriber base stood at 82.5 million in fiscal 2024, meaning Microsoft added approximately 6.5 million subscriptions during fiscal 2025.
- Microsoft 365 Consumer cloud revenue grew 33% in fiscal Q3 2026, compared with 11% growth for the full 2025 fiscal year.
- Consumer subscriptions increased another 7% year over year in fiscal Q3 2026.
- Microsoft 365 Commercial cloud revenue increased 19% in fiscal Q3 2026, accelerating from 16% growth in fiscal Q2 2025.
- Commercial seat growth measured 6% in fiscal Q3 2026, compared with 7% in fiscal Q2 2025.
- Small and midsize businesses and frontline-worker plans remained important drivers of paid Microsoft 365 seat growth.
- A standard Microsoft 365 Business plan can support up to 300 users, while eligible plans provide 1 TB of cloud storage per user.
- Microsoft 365 usage reporting can track activity over 7-, 30-, 90- or 180-day periods, with most reporting data available within 24 to 48 hours.
- Microsoft provides three principal update channels for Microsoft 365 Apps: Current Channel, Monthly Enterprise Channel and Semi-Annual Enterprise Channel.
Microsoft Azure Statistics
- Azure surpassed $75 billion in annual revenue during fiscal 2025, following 34% year-over-year growth.
- Azure and other cloud services revenue grew 40% in fiscal Q3 2026, or 39% in constant currency.
- Azure growth measured 39% in fiscal Q2 2026 and 40% in fiscal Q1 2026, showing consistently high demand across the fiscal year.
- Azure revenue grew 33% in fiscal Q3 2025, with AI services contributing 16 percentage points of that growth.
- Azure AI Foundry served 80,000 customers by fiscal Q1 2026, including 80% of Fortune 500 companies.
- Azure customers in 33 countries were developing localized cloud and AI capabilities to address data residency and sovereignty requirements.
- Demand for Azure services continued to exceed available infrastructure capacity during fiscal 2026, despite new capacity coming online.
- Azure’s reported growth includes cloud and AI consumption services, GitHub cloud services, virtual desktops and Nuance health care cloud products.
- Server products and cloud services revenue rose 22% in fiscal Q3 2025, primarily because of Azure demand.
- Azure’s rapid growth has made it one of Microsoft’s largest individual businesses and a central contributor to Intelligent Cloud revenue.
Microsoft Cloud Computing Statistics
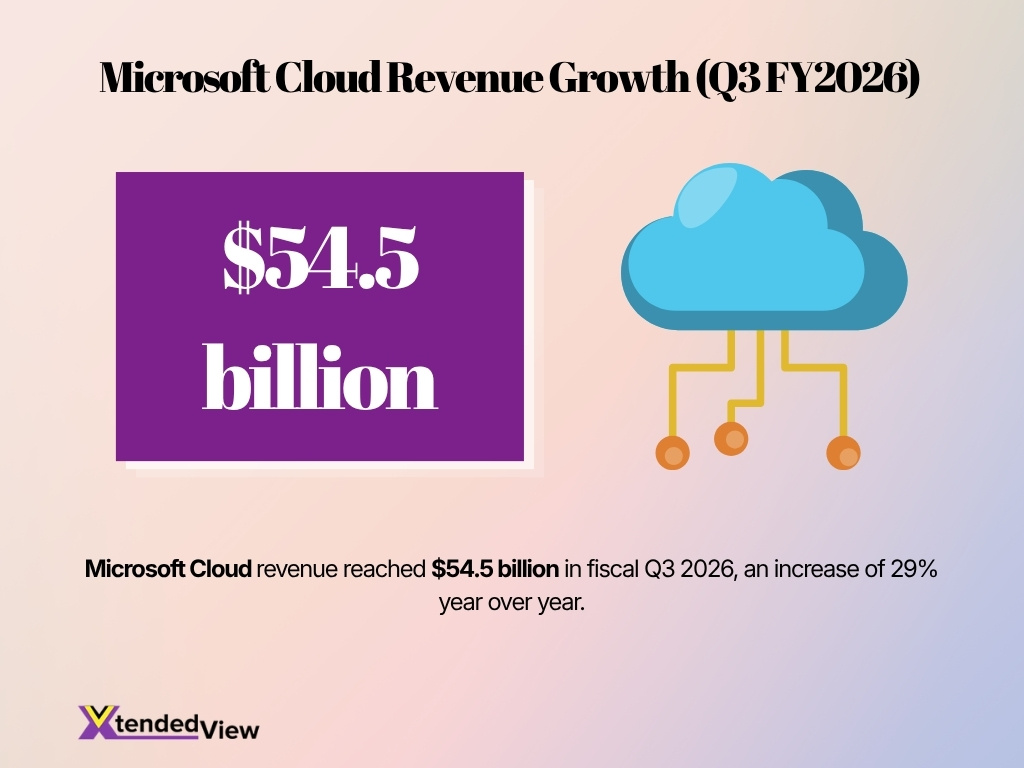
- Microsoft Cloud revenue reached $54.5 billion in fiscal Q3 2026, an increase of 29% year over year.
- Microsoft Cloud first surpassed $50 billion in quarterly revenue during fiscal Q2 2026, when revenue increased 26%.
- The increase from more than $50 billion in fiscal Q2 to $54.5 billion in fiscal Q3 shows that quarterly cloud revenue expanded by at least $4.5 billion sequentially.
- Commercial remaining performance obligations reached $627 billion in fiscal Q3 2026, up 99% year over year.
- Microsoft Cloud’s gross margin fell to 66% in fiscal Q3 2026, compared with 69% in fiscal Q3 2025, as infrastructure and AI usage costs increased.
- The cloud gross margin had already declined to 71% in fiscal Q1 2025 because Microsoft was scaling AI infrastructure.
- Microsoft Cloud revenue growth accelerated from 23% in fiscal Q3 2025 to 29% in fiscal Q3 2026.
- Cloud cost of revenue increased 22% in fiscal Q3 2026 as Microsoft expanded data-center capacity and supported higher product usage.
- Microsoft Cloud includes Azure, Microsoft 365 Commercial cloud, Dynamics 365 and the commercial portion of LinkedIn.
- Continued demand across AI and non-AI workloads exceeded available cloud capacity during fiscal Q3 2026, even after Microsoft delivered additional infrastructure earlier than expected.
Microsoft Teams Statistics
- Microsoft Teams had more than 350 million monthly active users by early 2025.
- The platform had reported 320 million monthly active users in late 2023, indicating an increase of at least 30 million users by 2025.
- Microsoft 365 Commercial seats, which include paid access to Teams in many subscription plans, grew 6% year over year in fiscal Q3 2026.
- Microsoft 365 Business plans that include Teams can support organizations with up to 300 users.
- Eligible Teams events can support audiences of up to 100,000 attendees through additional attendee-capacity licensing.
- Teams Phone’s multi-line feature can assign up to 10 phone numbers to one user, helping organizations manage several business lines through one account.
- Teams usage contributes to Microsoft 365 Commercial cloud revenue, which increased 19% in fiscal Q3 2026.
- Microsoft 365 administrators can monitor Teams activity across reporting windows of up to 180 days.
- Teams Premium adds AI-assisted meeting features, advanced personalization and enhanced security controls for eligible subscribers.
Microsoft AI Statistics
- GitHub Copilot reached 20 million users by fiscal 2025, up from 15 million three months prior.
- GitHub Copilot user numbers grew more than fourfold year over year by fiscal Q3 2025.
- Nearly 140,000 organizations actively used GitHub Copilot by fiscal Q3 2026.
- GitHub Copilot enterprise subscriptions nearly tripled year over year by fiscal Q3 2026.
- GitHub Copilot command-line interface usage nearly doubled month over month in fiscal Q3 2026.
- 90% of Fortune 100 companies deployed GitHub Copilot by fiscal Q4 2025.
- GitHub Copilot Enterprise customers increased 75% quarter over quarter in fiscal Q4 2025.
- An AI-powered code-review agent reviewed over 8 million pull requests by April 2025.
- Visual Studio platforms served over 50 million monthly active users, distributing Microsoft’s developer AI tools.
- Azure AI Foundry reached 80,000 customers, including four out of five Fortune 500 companies by fiscal Q1 2026.
Microsoft Copilot Web Traffic by Country
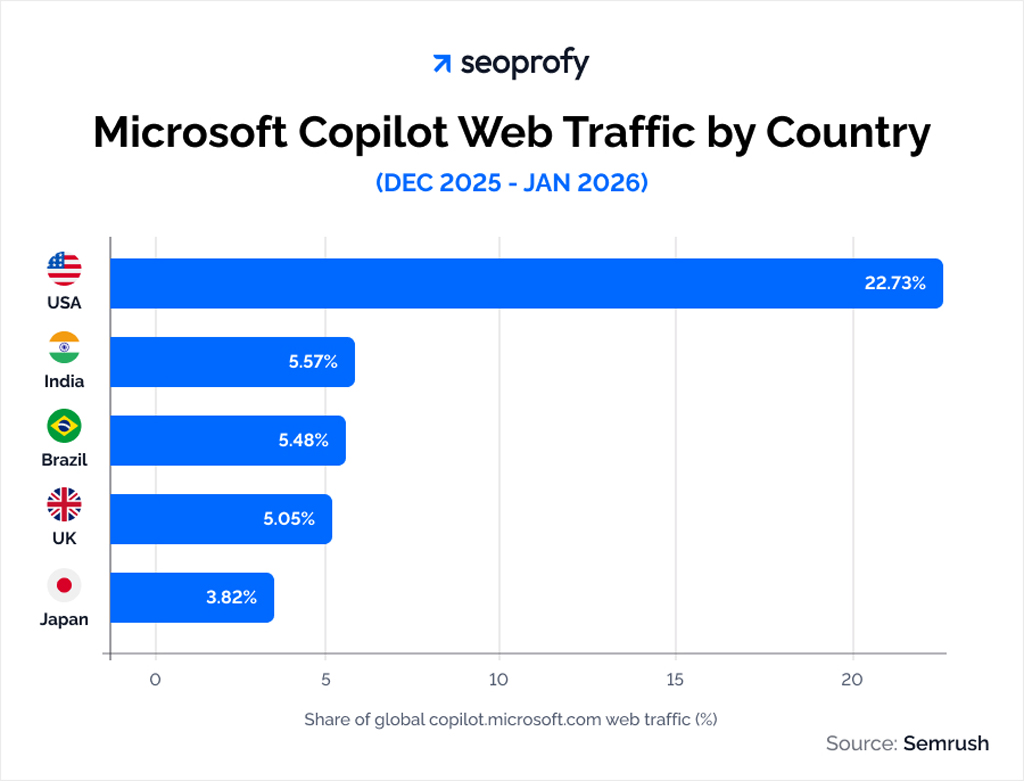
- The United States generated the largest share of Microsoft Copilot web traffic at 22.73%, far ahead of every other country.
- India ranked second with 5.57% of global traffic, making it Copilot’s strongest market outside the U.S.
- Brazil followed closely at 5.48%, only 0.09 percentage points behind India.
- The United Kingdom accounted for 5.05% of Copilot web traffic during December 2025 to January 2026.
- Japan ranked fifth with a 3.82% share of global traffic.
- The U.S. traffic share was more than four times higher than India’s, highlighting Microsoft Copilot’s strong concentration in the American market.
- Together, the five leading countries represented 42.65% of global Copilot web traffic.
Microsoft Xbox and Gaming Statistics
- Microsoft’s gaming revenue decreased 7% year over year in fiscal Q3 2026, representing a decline of approximately $380 million.
- Xbox content and services revenue fell 5% in fiscal Q3 2026, partly because the prior-year quarter benefited from stronger first-party game releases.
- Xbox hardware revenue declined 33% in fiscal Q3 2026 as Microsoft sold fewer consoles.
- Microsoft’s More Personal Computing segment generated $13.2 billion in fiscal Q3 2026 revenue, down 1% from $13.4 billion a year earlier.
- Gaming and device weakness contributed to the More Personal Computing segment’s year-over-year decline, while search advertising provided a partial offset.
- In fiscal 2025, Microsoft’s gaming revenue increased 9%, supported by Xbox content and services and the inclusion of Activision Blizzard operations.
- Research and development spending related to gaming contributed to a $3 billion increase in companywide R&D expenses during fiscal 2025.
- Microsoft completed its Activision Blizzard acquisition in October 2023, expanding its portfolio across console, PC and mobile gaming.
- The fiscal Q3 2026 results show that Microsoft increasingly depends on game content, subscriptions and digital services as console hardware sales decline.
Microsoft LinkedIn Statistics
- LinkedIn serves a global community of more than 1.3 billion members.
- More than 70 million companies maintain a presence on the professional networking platform.
- The platform lists more than 144,000 schools and recognizes over 42,000 skills in its professional data network.
- LinkedIn generates approximately $19 billion in annual revenue, up from $17.8 billion reported at the end of fiscal 2025.
- Revenue increased 12% year over year in fiscal Q3 2026, or 9% in constant currency, with growth across all major business lines.
- The fiscal Q3 increase added approximately $521 million to LinkedIn’s quarterly revenue compared with the prior-year period.
- Revenue had grown 11% in fiscal Q2 2026, driven primarily by Marketing Solutions, after increasing 10% in fiscal Q1.
- LinkedIn recorded more than four consecutive years of double-digit member growth by 2026.
- Members engage with around 1.5 million pieces of content every minute, while video uploads had already increased 34% year over year in fiscal 2024.
- LinkedIn’s Talent Solutions business continues to face pressure from weaker hiring activity in several industries, even as advertising and other services support revenue growth.
Microsoft Market Capitalization Trends
- Microsoft shares closed at approximately $381.70 on July 24, 2026.
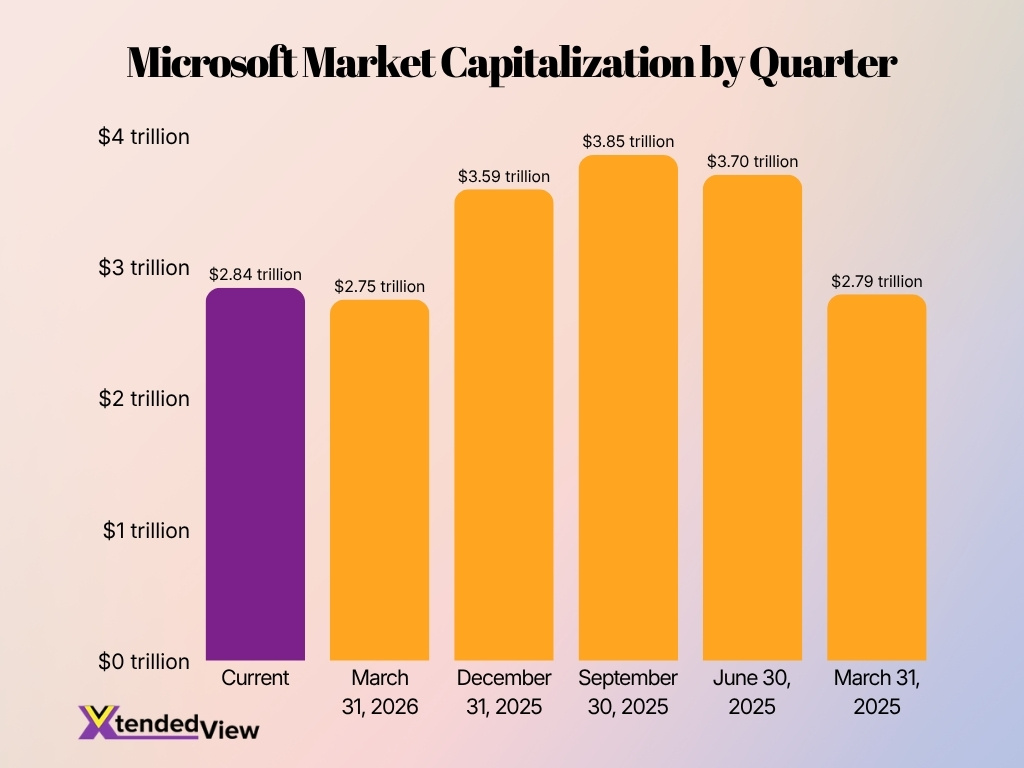
- Microsoft’s current market capitalization stands at $2.84 trillion, reflecting a modest recovery from $2.75 trillion on March 31, 2026.
- The company reached its highest recorded valuation of $3.85 trillion on September 30, 2025.
- Microsoft’s market cap increased from $2.79 trillion in March 2025 to $3.70 trillion in June 2025.
- After peaking in September 2025, the valuation declined to $3.59 trillion by December 31, 2025.
- Microsoft’s market capitalization fell by approximately $1.10 trillion between September 2025 and March 2026.
- The current valuation remains about $1.01 trillion below the September 2025 peak.
- Compared with March 2025, Microsoft’s current market cap is only around $50 billion higher.
- The figures highlight significant valuation volatility, with Microsoft moving between $2.75 trillion and $3.85 trillion during the period. Active share-repurchase authorization is currently valued at up to $60 billion.
Microsoft Global Presence Statistics
- Microsoft operated more than 400 data centers across 70 cloud regions by December 2025.
- The company opened new data centers across six continents during 2025 to support growing cloud and AI workloads.
- Microsoft employed approximately 228,000 people worldwide at the end of fiscal 2025.
- Azure customers in 33 countries were developing localized cloud and AI systems to address data residency and sovereignty requirements.
- Microsoft announced a $30 billion UK investment covering 2025 through 2028, including $15 billion for cloud and AI infrastructure.
- The UK program includes a planned supercomputer with more than 23,000 graphics processing units.
- Microsoft contracted approximately 40 gigawatts of new renewable energy supply across 26 countries through more than 400 agreements.
- Those clean-energy agreements involved more than 95 utilities and developers, reflecting the scale of Microsoft’s infrastructure supply network.
- In fiscal 2025, Microsoft matched 100% of its annual global electricity consumption with renewable energy purchases.
- Microsoft replenished more than 14.2 million cubic meters of water, surpassing its global water withdrawals for the first time.
Microsoft Innovation and Research Statistics
- Microsoft spent $32.49 billion on research and development in fiscal 2025, up from $29.51 billion in fiscal 2024.
- Research and development expenses increased 10%, adding almost $3 billion in one year.
- R&D accounted for 12% of annual revenue in both fiscal 2025 and fiscal 2024.
- The company directed much of the additional spending toward cloud engineering, AI model training, infrastructure and gaming development.
- Microsoft planned to invest approximately $80 billion in AI-enabled data centers during fiscal 2025.
- The company introduced its Majorana 1 quantum chip in February 2025, using an approach designed to support more stable and scalable qubits.
- Microsoft Research India marked 20 years of operations in 2025 after opening its Bengaluru laboratory in 2005.
- When the India laboratory opened, it became Microsoft Research’s sixth laboratory worldwide and its third outside the United States.
- Microsoft introduced the Maia 200, its next-generation AI accelerator, in January 2026.
- Microsoft’s fiscal 2025 R&D expenditure equaled about $89 million per day, based on the reported annual total.
Frequently Asked Questions (FAQs)
Microsoft generated $281.7 billion in revenue during fiscal year 2025, a 15% increase from the previous year.
As of June 30, 2025, Microsoft employed approximately 228,000 full-time employees worldwide.
Azure surpassed $75 billion in annual revenue during fiscal 2025 after growing 34% year over year.
GitHub Copilot has more than 20 million users worldwide as of fiscal 2025.
LinkedIn has grown to 1.2 billion members globally, making it one of the world’s largest professional networking platforms.
Conclusion
Microsoft continues to grow through cloud computing, artificial intelligence, business software and digital services. The company reported $82.9 billion in fiscal Q3 2026 revenue and maintained a large global presence through LinkedIn, Azure and more than 400 data centers across 70 regions. Microsoft also invested heavily in research, spending $32.49 billion on R&D in fiscal 2025, while returning $37.7 billion to shareholders. Overall, the company’s 2026 performance shows strong demand for cloud and AI services, even as gaming hardware and some consumer businesses faced slower growth.