



Microsoft Azure continues to shape the cloud computing market by helping organizations modernize IT infrastructure, build AI-powered applications, and scale enterprise workloads. Businesses across industries rely on Azure for data analytics, cybersecurity, disaster recovery, and hybrid cloud deployments, while developers use its platform to accelerate software delivery and AI innovation. As cloud and AI spending continues to grow across the US and worldwide, Azure remains a key driver of digital transformation. Explore the statistics below to understand Azure’s market position, financial growth, customer adoption, and expanding global footprint.
Editor’s Choice
- Azure generated more than $75 billion in annual revenue during Microsoft’s fiscal year 2025, representing 34% year-over-year growth, the first time Microsoft publicly disclosed Azure’s annual revenue.
- Microsoft reported Azure and other cloud services revenue increased 39% year over year during the second quarter of fiscal year 2026, reflecting continued AI-driven demand.
- Azure’s global infrastructure now spans 80+ regions and more than 500 data centers, giving Microsoft one of the largest cloud footprints worldwide.
- Microsoft Cloud generated $51.5 billion in quarterly revenue during Q2 FY2026, increasing 26% year over year.
- Azure offers more than 100 compliance certifications and regulatory offerings, making it one of the most compliant enterprise cloud platforms.
- Microsoft’s total revenue reached $281.7 billion in fiscal year 2025, up 15% from the previous year, with Azure serving as one of the company’s primary growth engines.
- Azure continues expanding AI infrastructure across multiple continents as Microsoft invests in new cloud regions to support enterprise AI adoption.
Recent Developments
- Microsoft announced that Azure revenue grew 39% year over year in Q2 FY2026, largely driven by AI infrastructure and enterprise cloud workloads.
- Microsoft Cloud surpassed $50 billion in quarterly revenue for the first time during Q2 FY2026.
- Commercial remaining performance obligation reached $625 billion, increasing 110% year over year, reflecting strong long-term Azure commitments.
- Microsoft expanded Azure capacity across Europe by investing in additional cloud regions, including Austria, Belgium, Denmark, Finland, and Greece.
- Azure now supports AI infrastructure designed specifically for large-scale generative AI workloads and enterprise foundation models.
- Microsoft continues launching new Azure regions, including cloud investments in Malaysia, Thailand, Denmark, and Belgium to strengthen regional availability.
- Azure maintains more regions than any other major cloud provider, supporting low-latency services and regional compliance requirements.
- During Q3 FY2025, Azure and other cloud services recorded 33% annual revenue growth, highlighting continued enterprise migration before accelerating further in FY2026.
Cloud Infrastructure Market Share Highlights
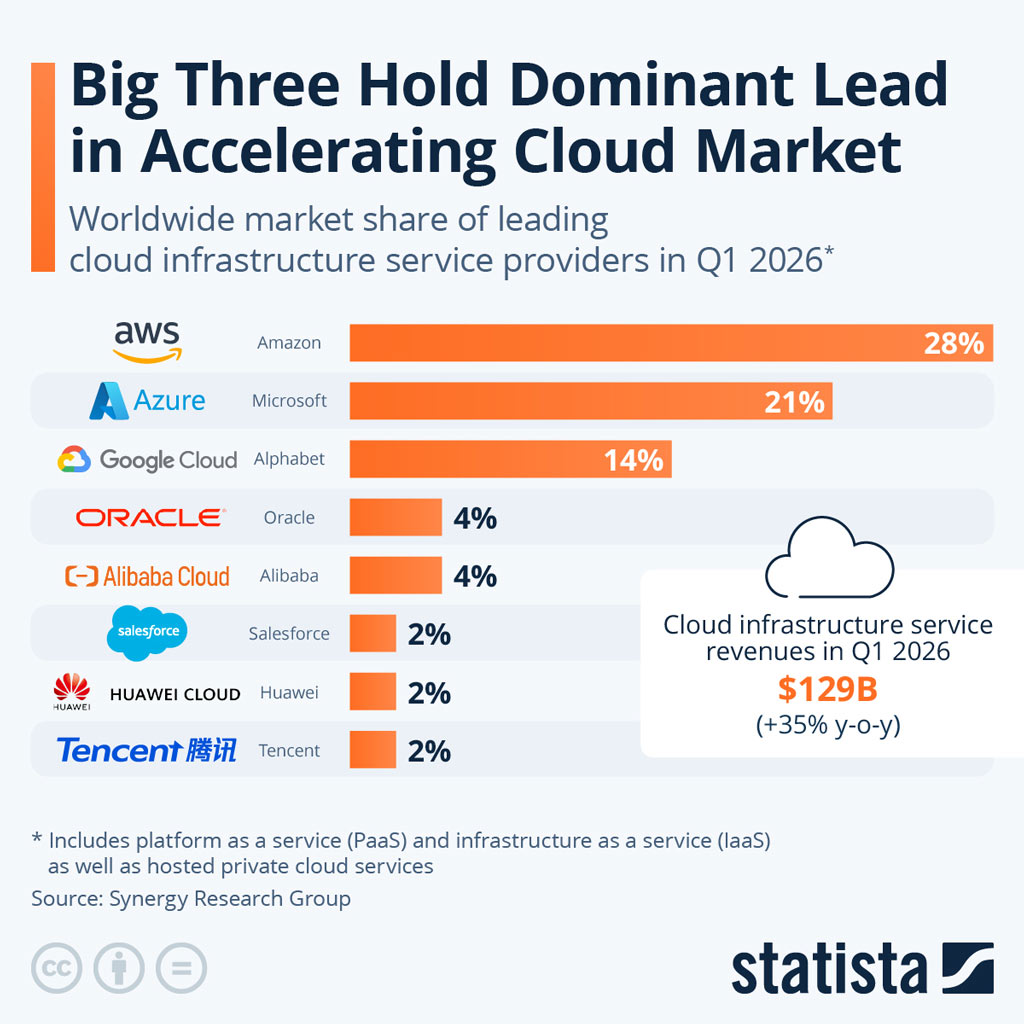
- Amazon Web Services led the global cloud infrastructure market with a 28% share in Q1 2026, maintaining a clear advantage over its closest competitors.
- Microsoft Azure ranked second with a 21% market share, placing it 7 percentage points behind AWS.
- Google Cloud captured 14% of the market, giving the three largest providers a combined share of 63%.
- AWS and Azure together controlled 49% of global cloud infrastructure spending, highlighting the market’s strong concentration.
- Oracle Cloud and Alibaba Cloud each held a 4% share, tying for fourth place among the leading providers.
- Salesforce, Huawei Cloud, and Tencent Cloud each accounted for 2% of the worldwide cloud infrastructure market.
- Global cloud infrastructure service revenue reached $129 billion in Q1 2026.
- The market recorded strong 35% year-over-year revenue growth, reflecting accelerating enterprise demand for cloud computing services.
- AWS’s 28% share was twice Google Cloud’s 14% share and seven times the shares held individually by Oracle and Alibaba.
- The figures cover infrastructure as a service, platform as a service, and hosted private cloud services.
Azure Revenue Statistics
- Azure surpassed $75 billion in annual revenue during Microsoft’s fiscal year 2025, representing 34% annual growth.
- Microsoft’s total company revenue reached $281.7 billion in FY2025, with Azure contributing an increasingly significant share.
- Microsoft Cloud generated $51.5 billion in quarterly revenue during Q2 FY2026.
- Intelligent Cloud revenue reached $32.9 billion during Q2 FY2026, increasing 29% year over year.
- Azure and other cloud services revenue increased 39% in Q2 FY2026 on a reported basis.
- During Q3 FY2025, Intelligent Cloud revenue totaled $26.8 billion, growing 21% year over year.
- Azure and other cloud services revenue increased 33% during Q3 FY2025 before accelerating further in FY2026.
- Microsoft reported $98.4 billion in Server Products and Cloud Services revenue during FY2025, up from $79.8 billion in FY2024.
Azure Growth Over Time
- Azure has evolved from a platform-as-a-service offering into one of Microsoft’s largest business segments since its commercial launch in 2010.
- Annual Azure revenue exceeded $75 billion in FY2025 after years of double-digit growth.
- Azure recorded 33% revenue growth in Q3 FY2025 before accelerating to 39% growth by Q2 FY2026.
- Microsoft’s Server Products and Cloud Services revenue increased from $65.0 billion (FY2023) to $79.8 billion (FY2024) and $98.4 billion (FY2025).
- Microsoft continues expanding Azure infrastructure into additional countries to support sustained long-term cloud demand.
- AI services have become one of Azure’s fastest-growing workload categories, contributing to accelerating cloud demand during 2025 and 2026.
- Microsoft’s commercial cloud backlog expanded sharply during FY2026, indicating strong future Azure revenue visibility.
- Azure continues benefiting from enterprise migrations away from on-premises infrastructure toward hybrid and AI-enabled cloud environments.
Azure Adoption by Businesses
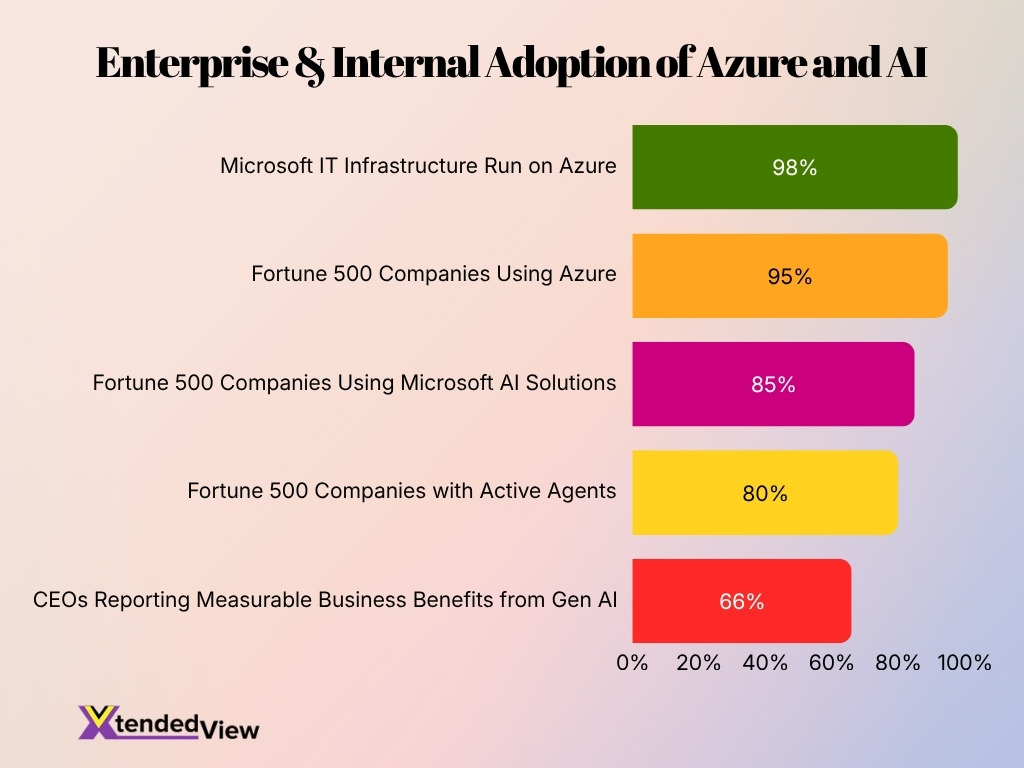
- 95% of Fortune 500 companies use Azure for workloads that include enterprise applications, databases, high-performance computing, and hybrid infrastructure.
- More than 60% of customer compute cores on Azure run Linux, showing that adoption extends well beyond Microsoft-based software environments.
- Microsoft runs 98% of its own IT infrastructure on Azure. That environment supports more than 200,000 employees and over 750,000 managed devices.
- More than 36,000 organizations were using Azure Arc, while its customer base grew 90% year over year at the time of disclosure. Azure Arc helps businesses manage on-premises, edge, and multicloud resources through Azure.
- Microsoft Fabric reached 35,000 paid customers by the third quarter of fiscal 2026, up 60% from the prior-year period.
- More than 80% of Fortune 500 companies had active agents built with Microsoft’s low-code and no-code tools by the second quarter of fiscal 2026.
- More than 85% of Fortune 500 companies were using Microsoft AI solutions in 2025, including services delivered through Azure’s cloud and data ecosystem.
- A collection published in 2025 documented more than 1,000 customer AI transformation examples across sectors such as health care, manufacturing, financial services, retail and government.
- 66% of CEOs reported measurable business benefits from generative AI initiatives in 2025, particularly through greater operational efficiency and improved customer service.
Azure Customer and User Statistics
- Azure holds 21% to 24% of the global cloud market share as of early 2026.
- Over 95% of Fortune 500 companies actively use Azure for their enterprise IT operations.
- The platform currently supports an estimated 486,000+ organizations globally across diverse industries.
- Azure revenue exceeded $75 billion annually while achieving 40% year-over-year growth in Q3 FY2026.
- More than 60,000 customers are leveraging Azure AI Foundry to develop generative AI applications.
- The public cloud infrastructure encompasses 70+ regions and over 400 data centers worldwide.
- Linux workloads represent more than 60% of all customer cores deployed on the platform.
- Microsoft recorded $627 billion in commercial remaining performance obligation due to long-term Azure adoption.
Azure Services and Workload Statistics
- Microsoft Fabric’s annual revenue run rate exceeded $2 billion in the second quarter of fiscal 2026, two years after the service became generally available.
- Fabric revenue grew 60% year over year during the same quarter, making data and analytics one of Azure’s fastest-growing workload areas.
- Fabric expanded from more than 31,000 customers in the second quarter of fiscal 2026 to 35,000 paid customers one quarter later.
- Azure Cosmos DB revenue grew 50% year over year in the third quarter of fiscal 2026 as AI applications created demand for low-latency databases.
- Azure Cosmos DB supports up to 1 million request units per second for a container with dedicated provisioned throughput under its standard documented limits.
- Each Azure Cosmos DB logical or physical partition supports up to 10,000 request units per second, while each logical partition can hold up to 20 GB.
- More than 50% of Fabric customers used at least three workloads in an earlier adoption snapshot, indicating that many organizations combine analytics, data engineering, and business intelligence capabilities.
- Fabric had already reached more than 21,000 customers, including over 70% of the Fortune 500, before passing 31,000 customers in fiscal 2026.
- Power BI supported 350,000 organizations worldwide in a previously disclosed customer count, strengthening Azure’s broader analytics and data ecosystem.
- A June 2025 Azure Marketplace update added 251 new commercial offers in a single week after they met the platform’s onboarding requirements.
Azure Usage and Consumption Statistics
- Azure and other cloud services revenue grew 39% year over year in Microsoft’s second quarter of fiscal 2026, reflecting higher consumption across AI and traditional cloud workloads.
- Azure revenue increased 34% in fiscal 2025 and exceeded $75 billion for the first time. Microsoft attributed the increase to growth across every major workload category.
- AI services contributed 16 percentage points to Azure’s 33% growth rate in the third quarter of fiscal 2025. In other words, almost half of that quarter’s percentage growth came from AI services.
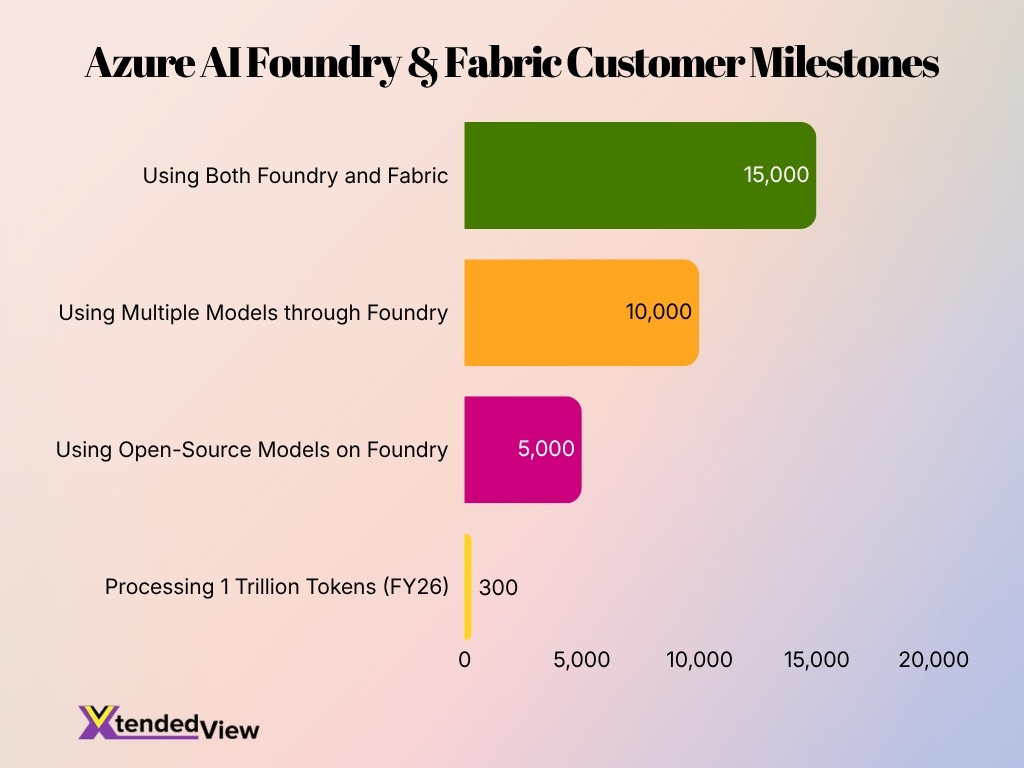
- More than 300 Foundry customers were on track to process at least 1 trillion tokens each during fiscal 2026. The number increased 30% quarter over quarter.
- In the previous quarter, more than 250 customers were on track to cross the same 1 trillion-token threshold, showing rapid growth among large-scale users.
- More than 10,000 customers had used multiple models through Foundry by the third quarter of fiscal 2026.
- 5,000 Foundry customers had used open-source models, highlighting demand for model choice rather than reliance on a single AI provider.
- The number of customers using both Anthropic and OpenAI models on Foundry doubled quarter over quarter in fiscal 2026.
- Data stored in Microsoft Fabric’s OneLake increased nearly fourfold year over year by the third quarter of fiscal 2026.
- More than 15,000 customers used both Foundry and Fabric, up 60% year over year, as businesses connected AI agents to operational and analytical data.
Azure Region and Data Center Statistics
- Azure actively maintains more than 70 operational regions worldwide to place workloads closer to users.
- The expanded infrastructure roadmap features more than 80 announced regions across the globe.
- The global network utilizes more than 400 physical data centers to handle cloud and AI capabilities.
- Microsoft expanded Southeast Asian capacity by opening new data centers in Malaysia and Indonesia in 2025.
- Rising infrastructure demand prompted scheduled regional launches in India and Taiwan during 2026.
- Microsoft is constructing a second region in Malaysia officially recognized as Southeast Asia 3.
- Microsoft includes Availability Zones in 100% of newly launched regions to ensure independent physical separation.
- The overarching Azure network connects via more than 175,000 miles of subsea and terrestrial fiber.
- Azure interfaces with the broader internet using over 190 strategic edge points of presence.
Azure Security Statistics
- Microsoft processed more than 100 trillion security signals per day in 2026, giving its cloud security systems a broad base for identifying suspicious activity.
- Identity-based attacks increased 32% during the first half of 2025, highlighting the continued risk of stolen credentials and unauthorized account access.
- More than 97% of identity attacks observed during that period involved large-scale password attacks.
- Financial motives drove 52% of cyberattacks recorded worldwide between July 2024 and June 2025.
- Data theft or data leakage occurred in 80% of incidents investigated by Microsoft security teams during the same 12-month reporting period.
- Microsoft’s security portfolio served 1.6 million customers by 2026, including organizations using its cloud, identity, endpoint and data-protection products.
- Microsoft Purview had audited 35 billion Copilot interactions, seven times the volume recorded one year earlier.
- Security guidance indicates that core protections such as multifactor authentication, modern anti-malware tools and data safeguards can prevent 99% of attacks.
- Generative AI techniques produced phishing click-through rates that were up to 450% higher, illustrating how AI can make social engineering attempts more persuasive.
Cloud Providers Accelerate Growth to Capture AI Demand
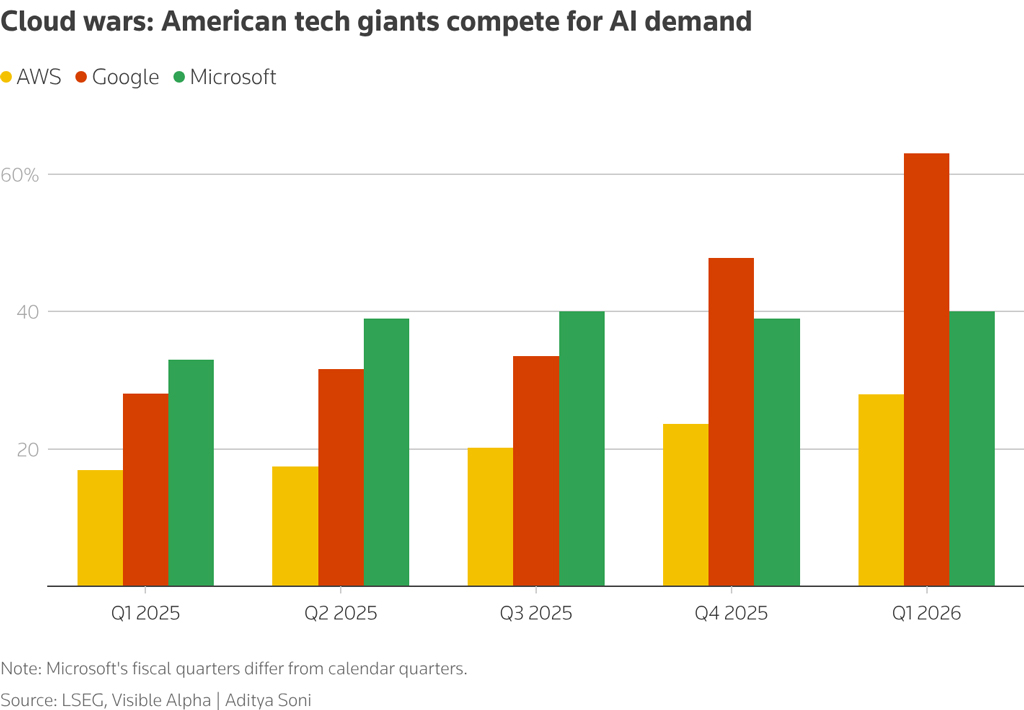
- Google recorded the strongest growth, rising from 28% in Q1 2025 to approximately 63% in Q1 2026.
- Google’s growth accelerated sharply in late 2025, climbing from 34% in Q3 2025 to 48% in Q4 2025.
- Microsoft maintained comparatively steady growth, increasing from 33% to 40% across the five-quarter period.
- Microsoft reached 40% in Q3 2025, dipped slightly to 39% in Q4 2025, and returned to 40% in Q1 2026.
- AWS posted the lowest growth rates among the three providers but improved consistently from 17% in Q1 2025 to 28% in Q1 2026.
- AWS gained 11 percentage points over the period, showing gradual momentum rather than a sudden AI-driven surge.
- By Q1 2026, Google’s 63% growth rate was more than double AWS’s 28% and 23 percentage points above Microsoft’s 40%.
- The data suggests that AI infrastructure demand is benefiting all three cloud giants, although Google appears to be capturing the fastest growth.
- Microsoft led Google in the first three quarters shown, but Google moved ahead decisively in Q4 2025.
- The widening gap in Q1 2026 indicates intensifying competition as cloud providers invest heavily in AI computing capacity and services.
Azure AI and Machine Learning Statistics
- Microsoft Foundry served more than 80,000 customers by 2026, including 80% of Fortune 500 companies.
- The number of Foundry customers spending at least $1 million per quarter grew nearly 80% year over year in the second quarter of fiscal 2026.
- More than 300 customers were projected to process at least 1 trillion Foundry tokens each during fiscal 2026, up from more than 250 customers one quarter earlier.
- More than 10,000 customers used multiple AI models through Foundry, while 5,000 used open-source models.
- Nearly 90% of Fortune 500 companies had active AI agents by the third quarter of fiscal 2026.
- Foundry supported 100 trillion tokens in one quarter and 2 billion daily search queries in a 2025 platform update.
- More than 15,000 organizations used both Foundry and Fabric by the third quarter of fiscal 2026, representing 60% year-over-year growth.
- Bayer’s internal agent platform, built with multiple Foundry models, supported more than 20,000 monthly active users.
- Microsoft reported a 67% increase in GPU efficiency for its MAI-Transcribe-1 speech model and an improvement of up to 260% for MAI-Image 2.
- AI investments worldwide could contribute a cumulative $22.3 trillion to the global economy by 2030, equal to about 3.7% of projected global GDP.
Azure DevOps and Developer Statistics
- GitHub hosted more than 180 million developers and 630 million projects in 2025, expanding the developer ecosystem connected to Microsoft’s cloud and development tools.
- Developers recorded 1.12 billion contributions on GitHub in 2025, showing the scale of software activity that can feed Azure deployment and DevOps workflows.
- GitHub added a new developer at an average rate of one per second during 2025. India alone added more than 5 million developers that year.
- Developers created 4.3 million AI-related projects on GitHub in 2025 as organizations embedded machine learning and generative AI into applications.
- GitHub users merged an average of 43.2 million pull requests per month in 2025, up 23% year over year.
- GitHub Copilot surpassed 20 million users in fiscal 2025, up from 1.8 million paid subscribers reported one year earlier.
- More than 77,000 enterprise customers used GitHub Copilot by fiscal 2024, representing 180% year-over-year growth at the time of disclosure.
- Developers using GitHub Copilot achieved productivity improvements of up to 55% in previously reported controlled research.
- TypeScript became the most-used programming language on GitHub in 2025, while Python ranked second as AI development accelerated.
- Increased GitHub Copilot usage contributed to a 47% rise in Intelligent Cloud cost of revenue during the third quarter of fiscal 2026, alongside continued AI infrastructure investment.
Azure Customer Spending Distribution
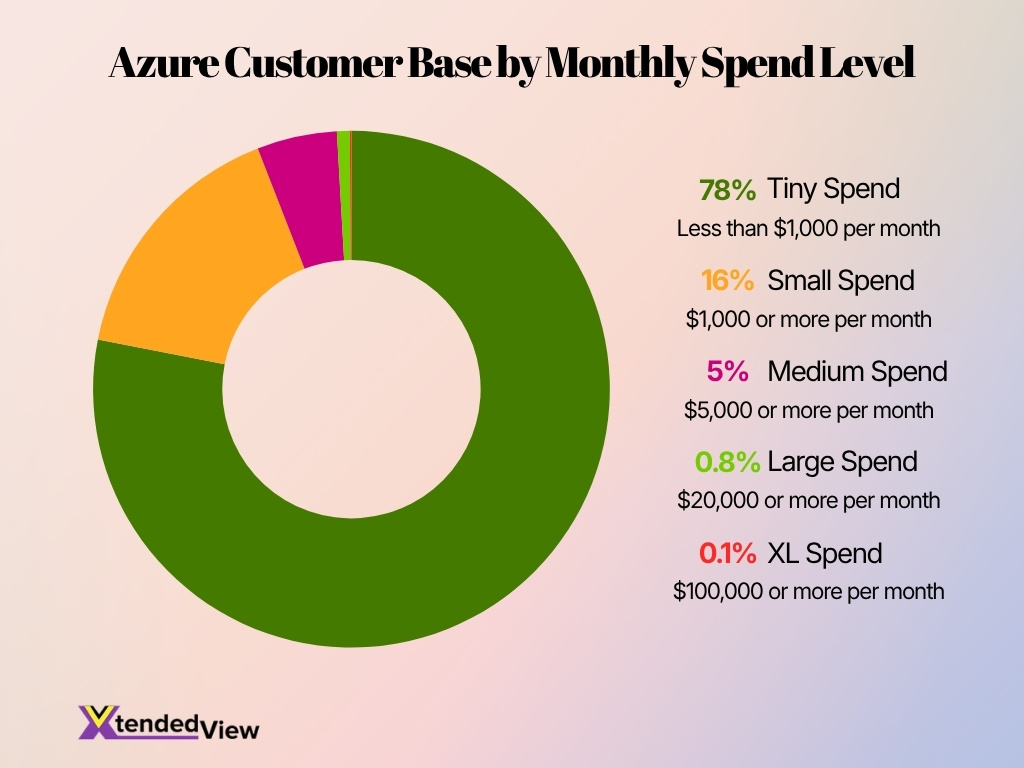
- Azure serves approximately 347,924 companies across five monthly spending categories.
- The largest segment is Tiny Spend, representing 78% of Azure companies spending less than $1,000 per month.
- Around 271,381 companies fall into the Tiny Spend category, showing Azure’s strong reach among low-spending customers.
- Small Spend customers account for 16%, or approximately 55,668 companies, spending at least $1,000 per month.
- About 5% of Azure companies, equal to roughly 17,396 businesses, spend $5,000 or more per month.
- Only 0.8%, or approximately 2,783 companies, belong to the Large Spend segment with monthly spending above $20,000.
- The highest-spending XL segment represents just 0.1%, or around 348 companies, spending more than $100,000 per month.
- Combined, about 94% of Azure customers spend below $5,000 per month, indicating that lower-spending accounts dominate the customer base.
- Customers spending at least $20,000 per month make up less than 1% of all Azure companies.
- The distribution suggests Azure has a broad customer base, but its highest-value accounts represent a very small share of total companies.
Azure Compliance and Governance Statistics
- Microsoft Purview Compliance Manager provides ready-to-use assessment templates for more than 360 regulations, standards, and legal frameworks.
- Azure compliance offerings fall into four categories encompassing globally applicable, US government, industry-specific, and regional requirements.
- A single Microsoft Entra tenant can contain up to 10,000 Azure management groups for organizing extensive cloud estates.
- A management-group hierarchy supports the root level plus six additional levels, excluding the subscription layer.
- Azure allows an unlimited number of subscriptions under one management group, with each having only one direct parent.
- An enterprise Microsoft Customer Agreement or partner billing account can support up to 10,000 subscriptions.
- Azure Policy supports up to 100 parallel remediation tasks per policy, each running as many as 30 parallel deployments.
- The Data Protection Baseline template includes 36 Zero Trust actions across identity, applications, endpoints, data, infrastructure, networks, and visibility.
- A one-time Compliance Manager trial grants eligible organizations access to 25 premium regulatory templates for 90 days.
- Azure supports regulated US healthcare workloads by providing safeguards strictly aligned with HIPAA and the HITECH Act.
Azure Performance and Reliability Statistics
- Azure Virtual Machines deployed across multiple availability zones can receive a 99.99% uptime service-level agreement.
- A 99.99% availability target corresponds to about 4.4 minutes of potential downtime per month, although actual results depend on architecture and service conditions.
- Azure Virtual Machines can run across more than 60 regions, enabling businesses to place compute resources closer to users and recovery locations.
- Zone-redundant storage copies data synchronously across three or more availability zones in a primary region.
- Availability zones use separate power, cooling, and networking systems, reducing the risk that one data center failure will interrupt every instance of an application.
- Azure Cosmos DB can distribute database replicas across multiple availability zones and redirect operations when one zone becomes unavailable.
- Azure’s broader infrastructure includes more than 70 operational regions and over 400 data centers, helping customers design geographically distributed systems.
- Azure Files supports up to 10,000 file shares per subscription per region and as many as 200 snapshots per file share under documented service limits.
- Azure Files control-plane limits include up to 375 management reads per second and 300 management writes per second before refill-rate controls apply.
- Azure demand continued to exceed available capacity in fiscal 2026 even as Microsoft added infrastructure, indicating that supply, not customer demand, remained a constraint across some workloads.
Azure Pricing and Cost Statistics
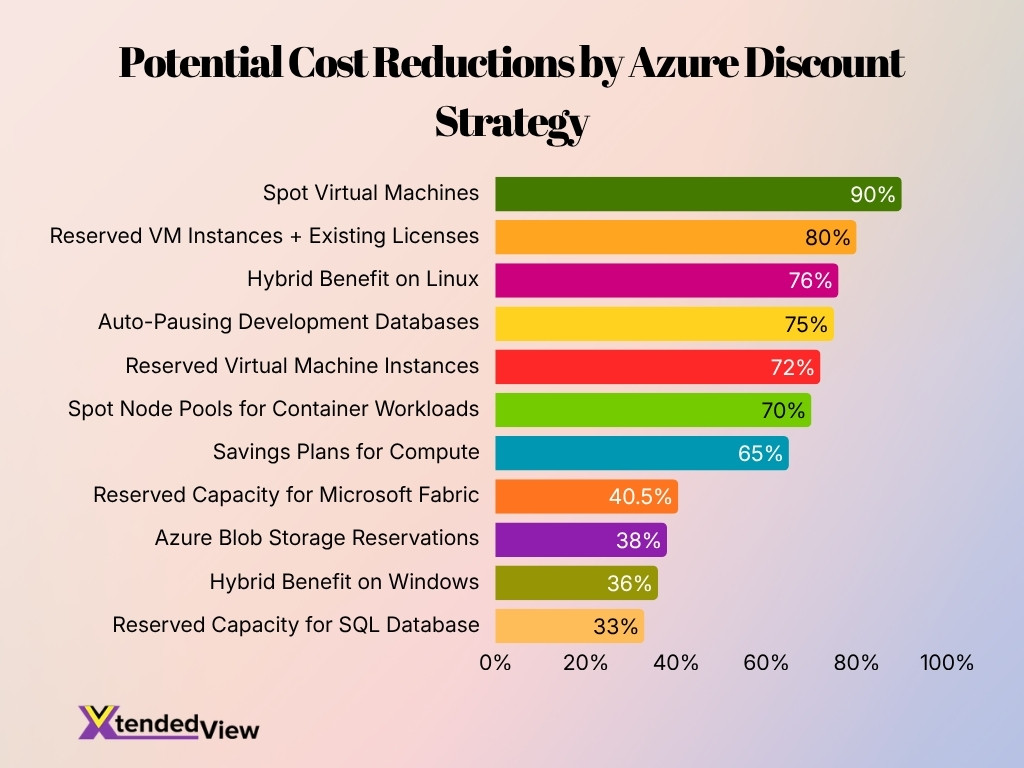
- Azure Reserved Virtual Machine Instances can reduce compute costs by up to 72% compared to standard pricing.
- Azure savings plans for compute can cut eligible costs by up to 65% in exchange for a spending commitment.
- Azure Spot Virtual Machines offer discounts of up to 90% for interruptible workloads compared to standard rates.
- Combining Reserved VM Instances with existing licenses can increase total compute savings to up to 80%.
- Reserved capacity for Azure SQL Database lowers costs by up to 33% compared to license-included pricing.
- Azure Blob Storage reservations can reduce eligible cloud storage costs by up to 38%.
- Reserved capacity for Microsoft Fabric can provide savings of up to 40.5% for qualifying cloud workloads.
- Auto-pausing development databases during inactive periods can generate cost savings of up to 75%.
- Azure Hybrid Benefit allows organizations to save an average of 36% on Windows and up to 76% on Linux.
- Utilizing Spot node pools for stateless container workloads can reduce costs by up to 70%.
Azure vs AWS Comparison
- AWS held about 28% of the global cloud infrastructure market in the first quarter of 2026, while Azure remained the second-largest provider.
- Global cloud infrastructure spending reached $129 billion in Q1 2026, up 35% from the same quarter in 2025. Both Azure and AWS benefited from the market’s ninth consecutive quarter of accelerating growth.
- Azure revenue surpassed $75 billion in fiscal 2025, rising 34%, while AWS generated about $116.5 billion during the comparable 12-month period and grew 18%.
- Azure grew faster than AWS during that comparison period, but AWS continued to generate substantially more standalone cloud revenue.
- AWS operated 39 geographic regions and 123 availability zones by 2026, with two more regions and seven additional zones announced.
- Azure reported more than 70 operational regions, giving it a larger region count, although the two companies define and structure their infrastructure footprints differently.
- Each AWS region has at least three availability zones, while Azure also uses physically separated zones to provide independent power, networking and cooling.
- AWS operates more than 30 Local Zone locations across six continents, extending selected cloud services closer to metropolitan users.
- Azure has a strong position among organizations that use Microsoft 365, Windows Server, SQL Server, GitHub and hybrid management tools, while AWS maintains the larger infrastructure market share.
- The comparison does not produce one universal winner. Workload requirements, existing software contracts, employee skills, regional availability, compliance needs and discount eligibility determine which platform delivers the stronger business case.
Frequently Asked Questions (FAQs)
Microsoft disclosed that Azure generated more than $75 billion in annual revenue in fiscal year 2025, representing 34% year-over-year growth.
Microsoft Azure operates across 80+ regions and 500+ data centers globally, giving it one of the largest cloud infrastructure footprints in the industry.
Azure and other cloud services revenue increased 39% year over year in Microsoft’s latest reported fiscal quarter, driven by strong AI and cloud demand.
Azure is the second-largest cloud provider globally and holds an estimated 24%–25% share of the worldwide cloud infrastructure services market.
Microsoft states that Azure has over 70 operational regions worldwide, with its broader global infrastructure spanning 80+ announced regions.
Conclusion
Microsoft Azure entered the year with more than $75 billion in annual revenue and quarterly growth rates approaching 40%, reinforcing its position as one of the world’s leading cloud platforms. The platform now extends far beyond infrastructure services, with AI, analytics, security, developer tools, and hybrid cloud capabilities driving enterprise adoption across virtually every industry.
The statistics also highlight Azure’s rapid expansion in AI workloads, global infrastructure, developer ecosystems, and enterprise governance. At the same time, Microsoft continues investing heavily in new regions, GPU capacity, security, and compliance to meet growing demand from organizations building AI-powered applications.
Although AWS continues to lead the global cloud infrastructure market by overall market share, Azure has maintained faster recent growth and continues strengthening its competitive position through deep integration with Microsoft products, hybrid cloud technologies, and enterprise AI services.
For organizations evaluating cloud platforms, Azure offers a compelling combination of scalability, security, compliance, AI innovation, and cost optimization options. Ultimately, the best platform depends on workload requirements, existing technology investments, regional availability, governance needs, and long-term business objectives.
