
Business intelligence (BI) has become a core capability for organizations that want to make faster, evidence-based decisions. Companies now use BI platforms to optimize supply chains, improve customer experiences, forecast revenue, and monitor operational performance in real time. As artificial intelligence becomes more integrated with analytics, the value of business intelligence continues to expand across industries. Explore the latest statistics to understand how BI is shaping business strategy.
Editor’s Choice
- The global business intelligence market is projected to reach $37.96 billion in 2026, up from $34.82 billion in 2025.
- The BI software market was valued at $40.13 billion in 2025 and is forecast to reach $81.45 billion by 2033.
- North America accounted for approximately 38% of the global BI software market in 2025, maintaining its leadership position.
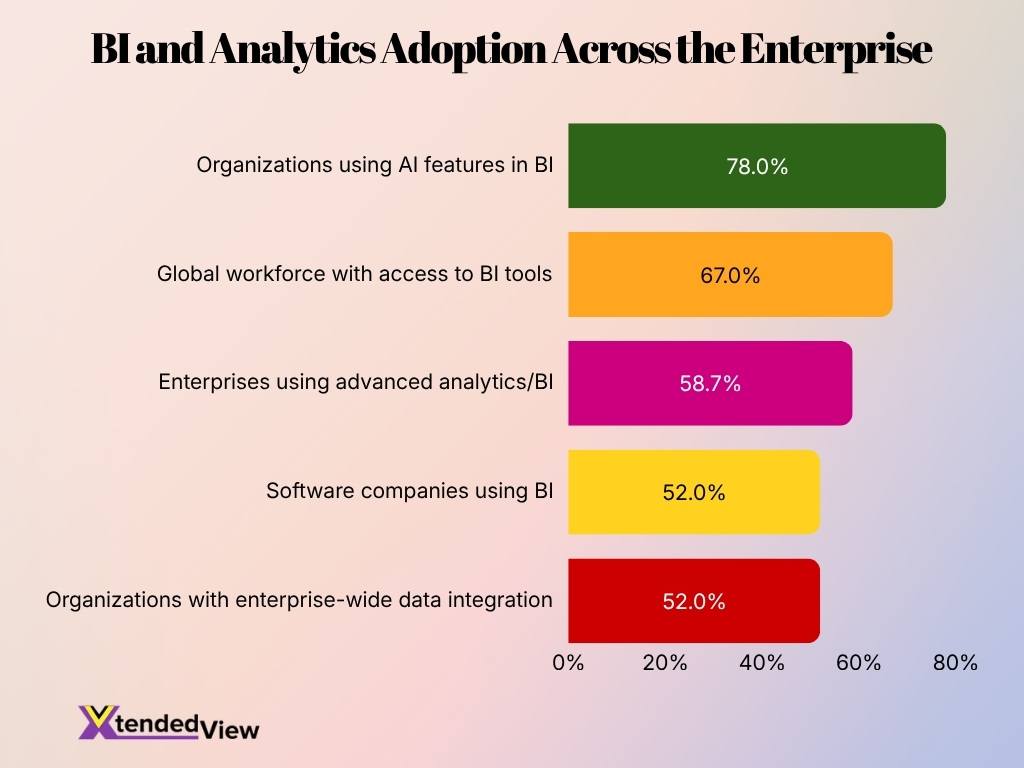
- About 67% of the global workforce now has access to business intelligence tools within their organizations.
- Around 58.7% of enterprises already use advanced BI and analytics platforms in their operations.
- More than 78% of companies reportedly use AI-enabled capabilities within their BI environments.
- The BI and analytics market is expected to reach $50.4 billion in 2026 and grow to $95.8 billion by 2033.
- Organizations with mature BI programs are five times more likely to make faster and more informed decisions than competitors.
Recent Developments
- Generative AI integration has emerged as one of the primary drivers of BI market growth between 2025 and 2030.
- Approximately 65% of organizations are already using or actively exploring AI-powered analytics solutions.
- Enterprise AI adoption accelerated significantly in 2025, with nearly 45% of organizations reporting AI in production environments.
- Companies are increasingly adopting multiple AI models, with the average number of LLMs used or evaluated rising from 2.8 in 2024 to 4.7 in 2025.
- Global data generation is estimated to have reached 181 zettabytes in 2025, creating greater demand for BI and analytics platforms.
- Real-time data visualization initiatives have been linked to 4% to 8% productivity-related revenue gains.
- Enterprise AI market forecasts were revised upward to $1.9 trillion by 2030, highlighting growing demand for intelligent analytics and decision support systems.
- Natural-language querying and NL2SQL capabilities have become a major area of BI innovation, allowing users to interact with data without coding expertise.
- Unified AI-powered BI platforms are demonstrating up to 58.58% higher analytical accuracy on enterprise-specific tasks.
General Business Intelligence Statistics
- The global BI adoption rate currently stands at approximately 26%.
- Around 86% of organizations use at least two BI platforms.
- About 61% of companies operate four or more BI tools simultaneously.
- Roughly 25% of organizations use ten or more BI platforms across departments.
- More than half (52.3%) of organizations are actively standardizing data across business functions.
- Manufacturing companies report some of the strongest BI outcomes, with 80% seeing measurable improvements after implementation.
- Approximately 52% of software companies use BI tools as part of routine operations.
- Nearly 90% of R&D departments consider BI critical for innovation initiatives.
- Only 4% of organizations report significant challenges adopting BI systems, indicating growing maturity in deployment practices.
Global Business Intelligence Market Size and Growth
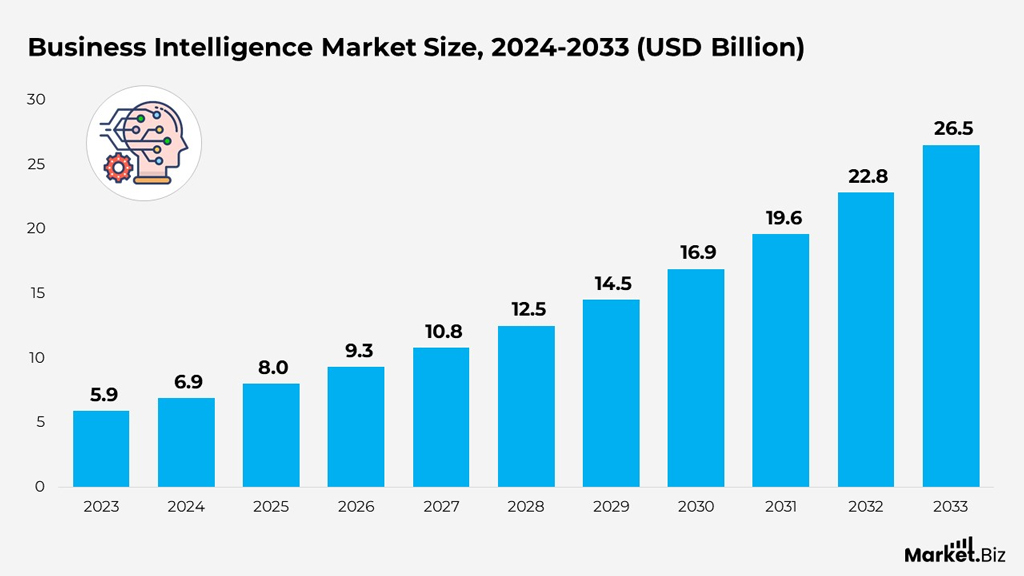
- The business intelligence market is projected to grow from $5.9 billion in 2023 to $26.5 billion by 2033.
- The market is expected to add $20.6 billion in value between 2023 and 2033.
- Business intelligence revenue is forecast to more than quadruple over the period, showing strong long-term demand.
- The market crosses the $10 billion mark in 2027, reaching $10.8 billion.
- By 2030, the BI market is projected to reach $16.9 billion, nearly triple its 2023 size.
- The strongest annual rise appears between 2032 and 2033, when the market grows from $22.8 billion to $26.5 billion.
- The steady year-over-year growth reflects rising adoption of data analytics, AI-driven insights, and enterprise reporting tools.
Business Intelligence Revenue Statistics
- The BI software market generated $40.13 billion in revenue during 2025.
- Global BI software revenue is projected to reach $81.45 billion by 2033.
- Software and platform products represented 68.73% of the BI market revenue in 2025.
- Subscription and SaaS licensing accounted for 60.13% of BI revenue in 2025.
- The broader BI and analytics market is estimated at $50.4 billion in 2026.
- Analysts project BI and analytics revenue to reach $95.8 billion by 2033.
- North America generated the largest share of BI software revenue, holding roughly 38% of the global market in 2025.
- Europe’s BI software market grew from $14.07 billion in 2025 to $15.91 billion in 2026.
- Europe’s BI software revenue is forecast to reach $42.47 billion by 2034.
The ROI and Financial Impact of BI Tools
- Organizations using business intelligence effectively are five times more likely to make faster decisions than competitors.
- Companies that rely on data-driven decision-making are 23 times more likely to acquire customers and 19 times more likely to be profitable.
- Data-driven organizations report revenue growth rates that are approximately 30% higher than businesses with low analytics maturity.
- Enterprises implementing advanced analytics and BI initiatives typically achieve an average ROI of 112% to 250% over multi-year deployments.
- Organizations with mature analytics programs improve operational efficiency by up to 30%.
- Real-time analytics deployments have been linked to 4% to 8% increases in annual revenue productivity.
- Businesses that leverage predictive analytics reduce forecasting errors by 20% to 50%.
- Companies using BI for supply chain optimization have reported inventory reductions of 15% to 20% while maintaining service levels.
- Organizations that integrate BI into customer analytics initiatives improve customer retention rates by up to 25%.
- Firms with strong data cultures are approximately three times more likely to report significant business improvements from analytics investments.
Business Intelligence Adoption Rates and Demographics
- Approximately 67% of employees worldwide have access to BI tools.
- The highest BI adoption levels are found in manufacturing, financial services, and business services sectors.
- Around 58.7% of enterprises report using advanced analytics and BI solutions.
- More than 52% of organizations have begun enterprise-wide data integration initiatives.
- Software companies show a BI adoption rate of approximately 52%.
- Logistics, healthcare, and financial services rank among the industries with the strongest demand for BI solutions.
- More than 78% of organizations now use AI features inside BI workflows.
- Organizations deploying BI extensively are reported to make decisions significantly faster than peers lacking analytics capabilities.
- Enterprise adoption continues to rise as AI, cloud infrastructure, and self-service analytics become more accessible.
Cloud Business Intelligence Statistics
- More than 60% of new BI deployments now occur in cloud environments rather than on-premises infrastructure.
- The cloud BI market is expected to grow at a CAGR exceeding 15% through 2030.
- Approximately 94% of enterprises use cloud services in some capacity, supporting wider BI adoption.
- Around 67% of organizations identify cloud analytics as a strategic priority.
- Cloud-based BI implementations generally cost 30% to 40% less upfront than traditional deployments.
- More than 70% of enterprise data workloads are expected to run in cloud environments by 2027.
- Organizations adopting cloud analytics platforms report deployment times that are 40% faster than on-premises alternatives.
- Hybrid cloud environments are used by approximately 73% of large enterprises to support analytics and reporting workloads.
- Cloud-native BI platforms are among the fastest-growing software segments, with annual growth exceeding 20% in several enterprise markets.
- Security improvements and AI integration remain the top reasons organizations migrate BI workloads to the cloud.
Self-Service BI and Data Democratization Trends
- More than 70% of organizations identify self-service analytics as a key strategic initiative.
- Approximately 48% of employees regularly use self-service analytics tools instead of relying solely on IT teams.
- Companies with strong data democratization programs are 1.5 times more likely to exceed revenue goals.
- Self-service BI adoption reduces report generation times by up to 80% in many organizations.
- Around 64% of business users prefer interactive dashboards over static reports.
- Organizations that promote data literacy achieve analytics adoption rates nearly two times higher than their peers.
- More than 80% of executives believe data literacy is essential for workforce success.
- Companies with mature self-service analytics environments report decision-making cycles that are 30% faster.
- Democratized data access has helped reduce dependency on IT-generated reports by approximately 40%.
- Citizen analysts now account for a growing share of enterprise analytics users, particularly in finance, marketing, and operations teams.
Business Intelligence Decision-Making Insights
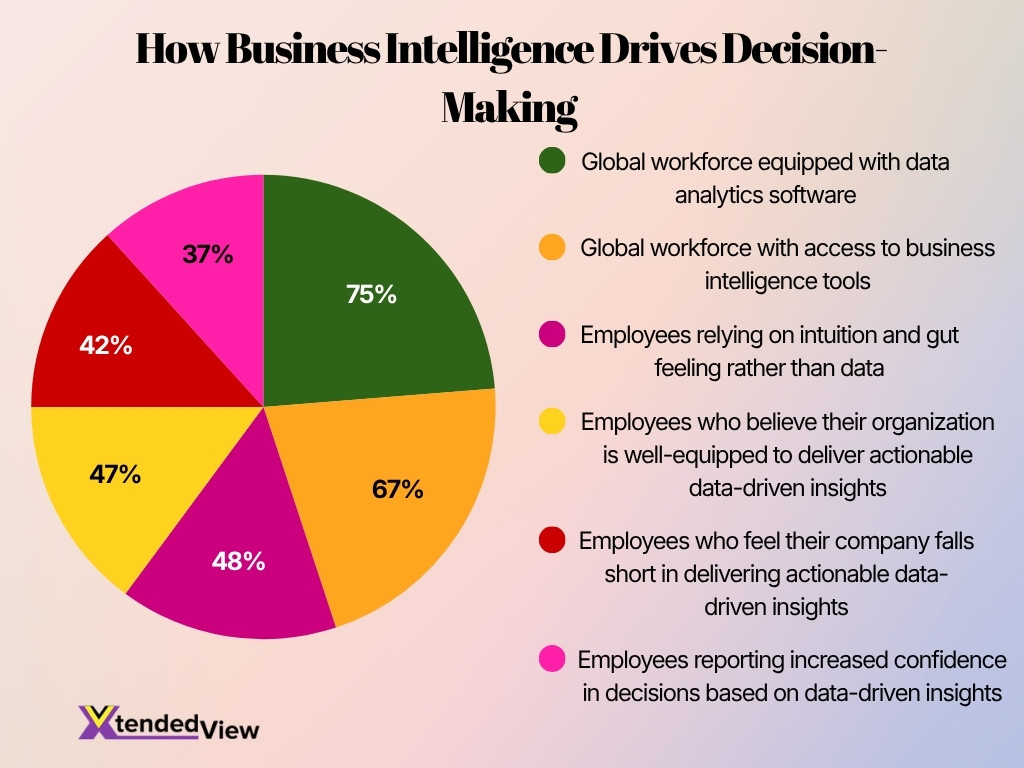
- 75% of the global workforce is equipped with data analytics software, showing strong enterprise investment in BI capabilities.
- 67% of workers have access to business intelligence tools, making BI a mainstream part of workplace decision-making.
- 48% of employees still rely on intuition and gut feeling, highlighting a major gap in data-driven culture.
- 47% of employees say their organization is well-equipped to deliver actionable data-driven insights.
- 42% of employees feel their company falls short in delivering actionable BI insights, showing room for improvement.
- Only 37% of employees report higher decision confidence from data-driven insights, despite wide BI access.
Data Analytics and Reporting Statistics
- Global data creation surpassed 181 zettabytes in 2025, creating unprecedented reporting demands.
- The average enterprise manages data from more than 400 different sources.
- Around 68% of organizations cite data integration as a top analytics challenge.
- Approximately 85% of business leaders consider data quality critical to reporting accuracy.
- Real-time reporting adoption has increased significantly as organizations seek faster operational visibility.
- Automated reporting tools can reduce manual reporting workloads by up to 70%.
- Organizations with advanced analytics capabilities are 2.8 times more likely to outperform competitors financially.
- More than 60% of executives rely on dashboards as a primary decision-support tool.
- Businesses that use predictive analytics report stronger planning accuracy and reduced operational risk.
- Data visualization remains one of the most widely adopted BI functions, especially among executive teams.
Big Data Volume and Data Management Statistics
- Global data creation reached approximately 181 zettabytes in 2025, up from 149 zettabytes in 2024.
- Worldwide data volume is projected to exceed 394 zettabytes by 2028.
- More than 90% of the world’s data has been generated within the last few years.
- Organizations process an average of 400+ data sources across business functions.
- Approximately 68% of enterprises struggle with data integration across multiple systems.
- Unstructured data accounts for roughly 80% to 90% of enterprise information assets.
- Data storage spending continues to rise, with enterprise storage markets growing at more than 10% annually.
- Around 47% of organizations cite data governance as a top priority for analytics programs.
- Businesses with mature data governance frameworks are significantly more likely to trust analytics outputs.
- Real-time data pipelines have become a standard requirement for large enterprises pursuing AI and BI initiatives.
Top BI Software Vendors by Market Share
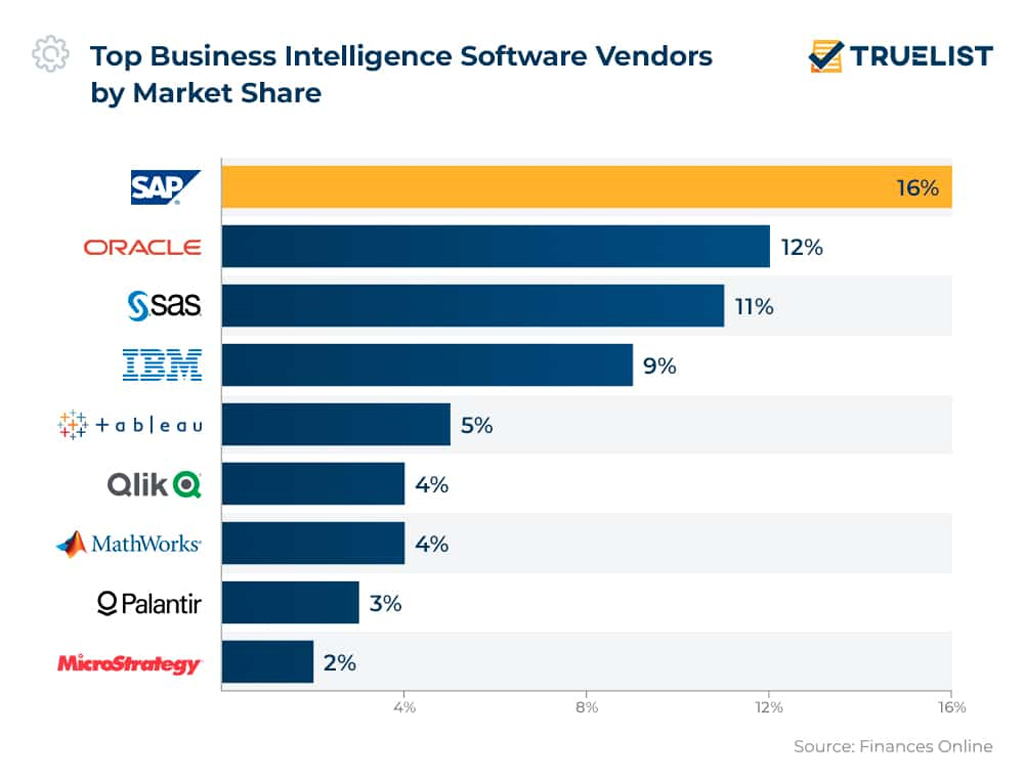
- SAP leads the BI software market with the highest share at 16%.
- Oracle ranks second with a 12% market share, staying close behind SAP.
- SAS holds the third position with 11%, making it one of the top BI vendors.
- IBM captures 9% of the BI software market, placing it fourth overall.
- Tableau accounts for 5%, showing strong relevance in data visualization and analytics.
- Qlik and MathWorks each hold 4%, indicating similar market presence.
- Palantir has a 3% share, reflecting a smaller but specialized BI footprint.
- MicroStrategy records the lowest share among listed vendors at 2%.
- The top four vendors, SAP, Oracle, SAS, and IBM, together control 48% of the BI software market.
Business Intelligence Regional Statistics
- North America held approximately 38% of the global BI software market in 2025.
- The North American region is projected to lead the analytics market with a 45% share by 2026.
- The United States BI market is estimated to reach $14.0 billion in 2026 with a 9.1% CAGR.
- Europe’s BI software market grew from $14.07 billion in 2025 to $15.91 billion in 2026.
- Europe is forecast to reach approximately $42.47 billion in BI software revenue by 2034.
- The Asia-Pacific industry is expected to record the highest CAGR of 10.4% between 2026 and 2034.
- India accounted for around 21.10% of the BI market share in the Asia-Pacific region in 2025.
- Japan’s BI market size is projected to hit $1.6 billion in 2026 and expand at a 9.5% CAGR.
The Cost of Poor Data Quality and BI Implementation Challenges
- Poor data quality costs organizations an average of $12.9 million annually.
- Data quality issues consume approximately 30% of employee time in many organizations.
- Around 85% of business leaders identify data quality as critical to successful analytics initiatives.
- Nearly 68% of organizations struggle with data integration and data silos.
- Data governance shortcomings remain one of the top reasons BI projects underperform.
- Approximately 47% of enterprises cite regulatory compliance as a challenge when scaling analytics programs.
- Lack of data literacy continues to limit analytics adoption among business users.
- More than 40% of analytics initiatives face delays because of data preparation and cleansing requirements.
- Organizations with fragmented data environments experience slower decision-making and lower reporting accuracy.
- Change management and user adoption remain among the most common BI implementation obstacles.
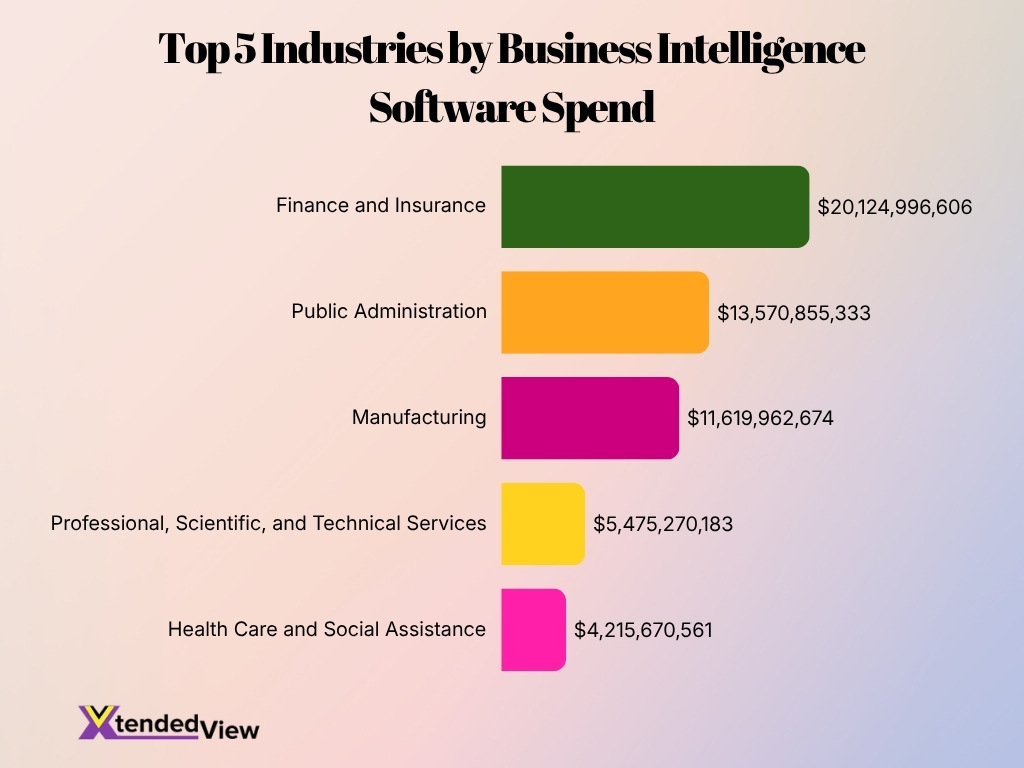
Top Industries Driving BI Software Spend
- Finance and Insurance leads BI software spend with $20.12 billion, showing the sector’s heavy reliance on data-driven decisions.
- Public Administration ranks second with $13.57 billion, reflecting strong BI use across government operations.
- Manufacturing spends $11.62 billion on BI software, supported by 686,660 companies using data for operations and efficiency.
- Professional, Scientific, and Technical Services has the highest company count at 1.32 million, with $5.48 billion in BI spend.
- Health Care and Social Assistance rounds out the top five with $4.22 billion, highlighting growing analytics adoption in healthcare.
Business Intelligence Job Market and Career Demand
- Employment for data scientists is projected to grow by 36% between 2023 and 2033.
- The median annual salary for data scientists recently reached $112,590, reflecting high market demand.
- Positions for computer systems analysts are expected to increase by 11% over the next decade.
- Jobs integrated with AI and advanced analytics are experiencing 42% faster wage growth than traditional roles.
- The global business intelligence market is expanding rapidly and is expected to reach $38.57 billion by 2026.
- Salaries for machine learning scientists reached a median of $140,910, highlighting the premium on advanced skills.
- The data science sector in India is projected to grow at nearly 19% annually through 2033.
- Approximately 67% of the global workforce now utilizes business intelligence tools to perform their daily jobs.
Future Predictions for the Business Intelligence Industry
- The global BI market is projected to reach approximately $72.21 billion by 2034.
- BI software revenue is forecast to grow to $81.45 billion by 2033.
- The BI and analytics market could reach $95.8 billion by 2033.
- Generative AI will become a standard capability across most enterprise BI platforms.
- More than 50% of analytics interactions are expected to use conversational AI interfaces by 2028.
- Decision intelligence platforms are projected to become a major enterprise software category by the end of the decade.
- Automated insight generation will increasingly reduce dependence on manual dashboard creation.
- Cloud-native BI deployments are expected to dominate new enterprise implementations.
- Real-time analytics and streaming data architectures will become standard for large enterprises.
- Organizations with strong data cultures and AI-enabled BI capabilities are expected to outperform competitors in revenue growth and operational efficiency.
Frequently Asked Questions (FAQs)
The global business intelligence market is projected to reach $37.96 billion in 2026.
The global business intelligence market is forecast to grow at a CAGR of 8.4% from 2026 to 2034.
The business intelligence software market is expected to reach $81.45 billion by 2033, up from $40.13 billion in 2025.
Approximately 67% of the global workforce has access to business intelligence tools.
About 86% of organizations use at least two BI platforms, while 61% use four or more, and 25% use ten or more BI tools.
Conclusion
Business intelligence continues to evolve from a reporting tool into a strategic decision-making platform. Organizations are investing heavily in cloud analytics, AI-powered insights, self-service BI, and data governance to gain a competitive advantage. Market growth remains strong across North America, Europe, and Asia-Pacific, while demand for analytics professionals continues to accelerate. As data volumes increase and AI capabilities mature, BI will play an even larger role in helping organizations improve efficiency, profitability, and customer outcomes.