



Network marketing continues to shape the global direct selling economy by creating flexible income opportunities and expanding product distribution through independent distributors. Businesses use the model to grow customer acquisition at relatively low marketing costs, while millions of individuals use it to earn supplemental or full-time income. From wellness brands expanding into international markets to beauty companies building social commerce communities, network marketing remains relevant across multiple industries. Explore the statistics below to understand how the industry is evolving.
Editor’s Choice
- Global network marketing (direct selling) retail sales reached $163.9 billion in 2024, remaining nearly unchanged from 2023 after several years of decline.
- The industry supported approximately 104.3 million independent representatives worldwide in 2024, representing a slight 0.1% annual increase.
- The United States remained the world’s largest network marketing market, followed by Germany, China, South Korea, and Malaysia.
- Women accounted for 72.1% of the global direct selling workforce in 2024, highlighting the industry’s continued appeal to female entrepreneurs.
- Twenty-one countries generated more than $1 billion in annual direct selling revenue, together representing 92% of worldwide sales.
- Wellness products remained the largest product category, followed by cosmetics, personal care, and household goods.
- Nearly 45% of reporting markets recorded annual sales growth in 2024, up from 42% in 2023, signaling improving industry momentum entering 2025 and 2026.
Recent Developments
- The global network marketing industry stabilized during 2024, with retail sales declining by only 0.05%, compared with larger declines in the previous two years.
- The percentage of reporting markets showing annual growth increased from 23% in 2022 to 42% in 2023 and 45% in 2024.
- Average market growth rates improved from -5.4% in 2022 to 4.6% in 2024, reflecting stronger recovery across multiple regions.
- Industry participation exceeded 104 million independent distributors, reversing the declines recorded during 2022 and 2023.
- Companies continued increasing investments in digital enrollment, mobile commerce, AI-powered distributor tools, and online customer engagement throughout 2025.
- Wellness products continued to outperform most other product categories as consumers increased spending on preventive health and nutrition.
- India’s direct selling industry reached ₹23,021 crore in FY2024-25, growing 4% year over year, making it one of the fastest-growing major markets.
- India’s active direct sellers increased from 8.8 million to 9.32 million within one year.
- Several established MLM companies have shifted toward affiliate or hybrid compensation models in response to changing consumer expectations and regulatory scrutiny.
Global Network Marketing Industry Overview
- Global network marketing generated approximately $163.9 billion in retail sales during 2024.
- More than 104 million people participated as independent distributors worldwide.
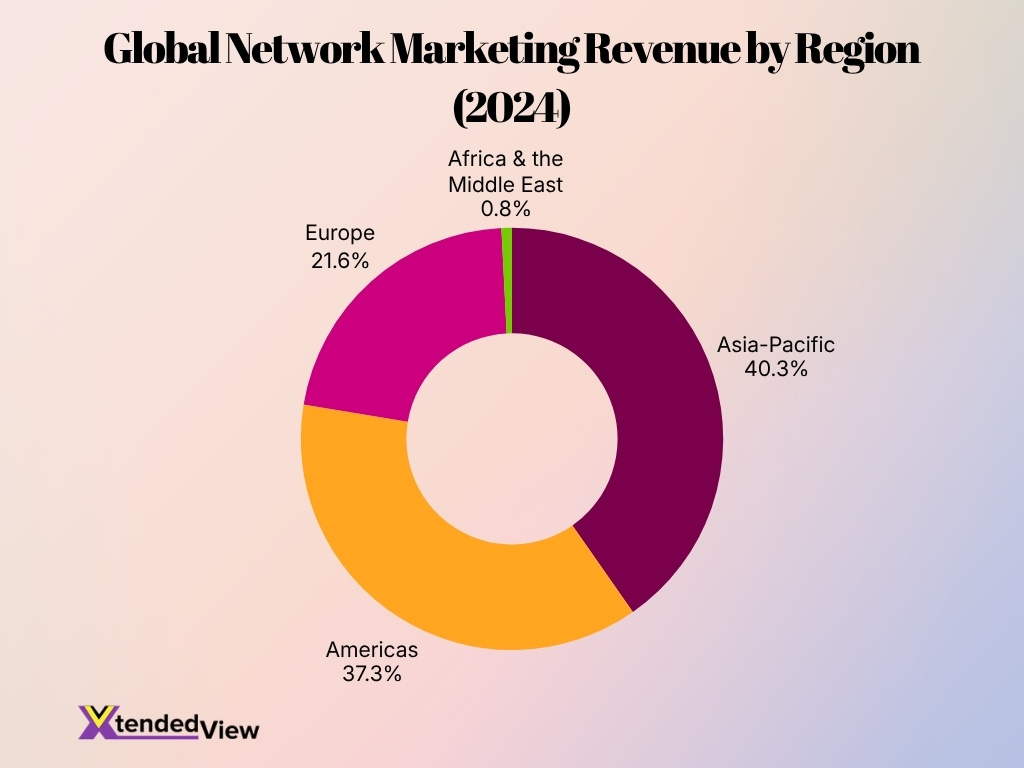
- The Asia-Pacific region represented 40.3% of global industry revenue, making it the largest regional market.
- The Americas accounted for 37.3% of worldwide direct selling revenue.
- Europe contributed 21.6% of global network marketing sales.
- Africa and the Middle East represented approximately 0.8% of worldwide sales, remaining the smallest regional market.
- The industry collected data across 55 national markets, providing one of the broadest global measurements of direct selling activity.
- The United States continued to lead all global markets by retail sales volume.
- Wellness, cosmetics, and household products remained the industry’s three largest commercial segments worldwide.
Key Direct Selling and Network Marketing Statistics
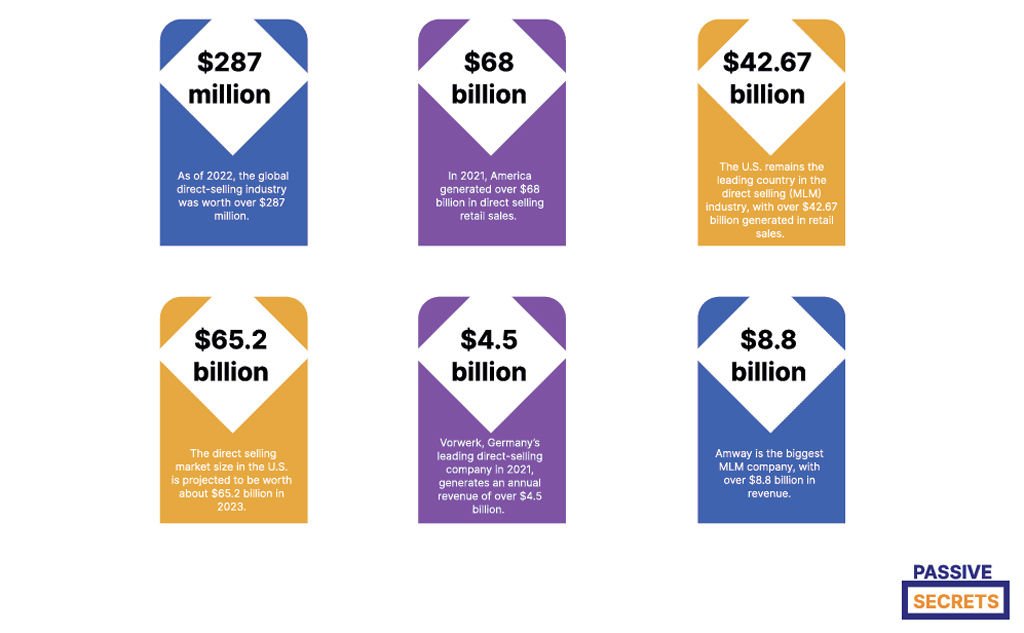
- The global direct-selling industry was valued at more than $287 million in 2022, according to the figure shown in the image.
- America generated approximately $68 billion in direct-selling retail sales in 2021, highlighting the region’s strong market position.
- The United States led the direct-selling market with more than $42.67 billion in retail sales.
- The U.S. direct-selling market was projected to reach about $65.2 billion in 2023.
- Germany-based Vorwerk generated more than $4.5 billion in annual revenue in 2021, making it one of the leading direct-selling companies.
- Amway ranked as the largest MLM company, with annual revenue exceeding $8.8 billion.
- The gap between Amway’s $8.8 billion revenue and Vorwerk’s $4.5 billion revenue shows Amway generated nearly twice as much.
- The image’s $287 million global market figure may be a labeling error, as other direct-selling industry estimates are commonly reported in billions.
Number of Network Marketing Companies Worldwide
- The global direct selling industry includes several thousand companies operating across 55 reported markets worldwide.
- Exactly 21 national markets successfully generated over $1 billion each in annual direct selling sales during 2024.
- The United States remained a leading market with $34.7 billion in retail sales and over 1,000 active network marketing companies.
- The Asia-Pacific region saw significant growth, representing 42% of all global distributor participation as of 2025.
- Digital-enabled transactions surged by 31% globally in 2025 due to expanded mobile ordering and social commerce integrations.
- Wellness and nutritional products represented the largest share, accounting for 41% to 46% of total industry product movement.
- The integration of AI-assisted distributor tools increased by 28%, which improved sales conversion efficiency by 23%.
- The industry maintained a massive workforce of 104.3 million independent representatives, with women comprising 72.1% of global participants.
- Mobile-based applications and ordering systems accounted for 57% of all digital product orders globally during 2025.
Global Network Marketing Participant Numbers
- The global network marketing industry included approximately 104.3 million independent representatives in 2024, up 0.1% from the previous year.
- Asia-Pacific accounted for the largest share of participants, with 62.3 million independent representatives across the region.
- The Americas recorded 25.5 million network marketing participants in 2024.
- Europe reported approximately 12.9 million independent representatives, making it the third-largest regional market by participation.
- Africa and the Middle East together represented roughly 3.6 million participants worldwide.
- The United States had approximately 12.2 million people with active direct selling agreements in 2024, including both business builders and discount buyers.
- India reported 9.32 million active direct sellers during FY2025, strengthening its position among the world’s largest participant markets.
- China remained one of the largest individual markets, with more than 20.5 million independent representatives.
- The Philippines recorded approximately 10.9 million network marketing participants, highlighting Southeast Asia’s continued importance to the industry.
Regional Distribution of Network Marketing Revenue
- Asia-Pacific generated 40.3% of worldwide network marketing revenue, making it the largest regional contributor.
- The Americas represented 37.3% of global retail sales.
- Europe contributed 21.6% of worldwide industry revenue.
- Africa and the Middle East together accounted for approximately 0.8% of global sales.
- The United States ranked first among all individual markets by annual sales.
- Germany ranked as the second-largest direct selling market globally.
- China remained the third-largest national market despite ongoing regulatory changes.
- Malaysia entered the top five global markets, reflecting strong growth across Southeast Asia.
- India ranked 11th worldwide by retail sales while continuing to deliver one of the strongest long-term growth rates among major markets.
Demographic Profile of Network Marketers
- Women represented 72.1% of independent representatives globally during 2024.
- Men accounted for the remaining 27.9% of the global network marketing workforce.
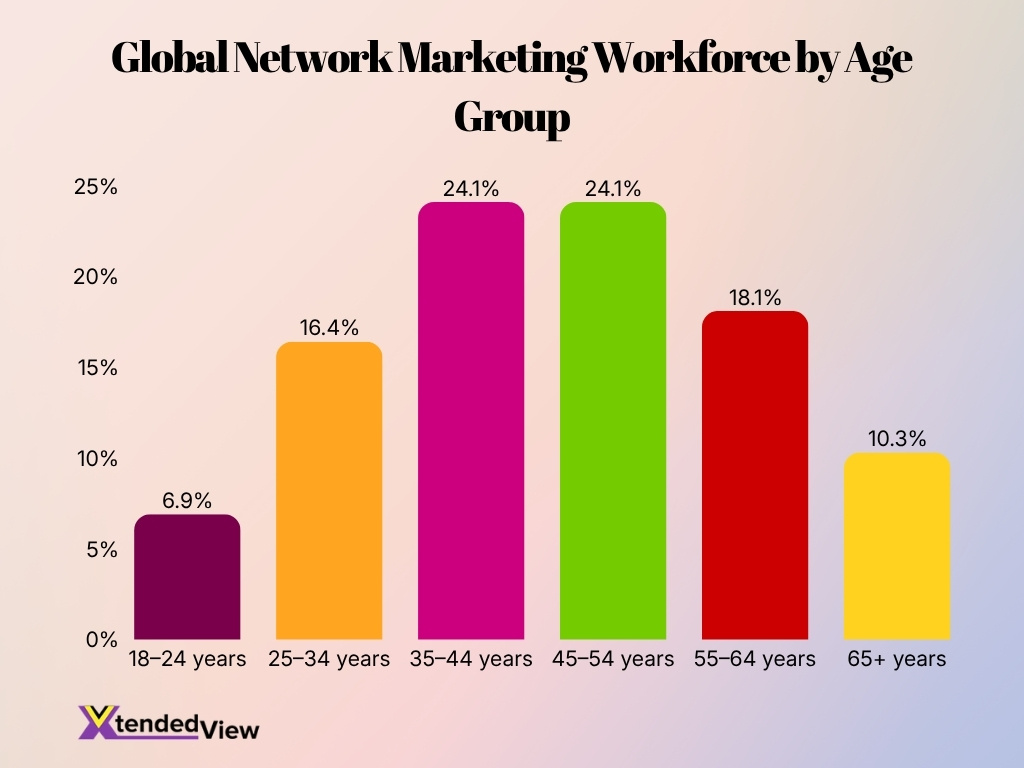
- The largest age groups worldwide were 35-44 years and 45-54 years, each representing 24.1% of participants.
- Approximately 18.1% of participants were between 55 and 64 years old.
- Around 10.3% of global representatives were 65 years or older, demonstrating continued participation beyond traditional retirement age.
- In the United States, 73% of direct sellers were women during 2024.
- Hispanic participants represented 19% of U.S. direct sellers, reflecting broad demographic diversity.
- India reported that 44% of active direct sellers were women in FY2025, up from 37% one year earlier.
- Flexible work arrangements, supplemental income, entrepreneurship, and social selling continue to attract participants across multiple age and income groups.
Gender Distribution in Network Marketing
- Women accounted for 72.1% of global network marketing participants in 2024.
- Men represented 27.9% of the worldwide independent representative population.
- In the United States, women made up approximately 73% of direct sellers.
- Canada’s recent independent seller survey found that 89% of respondents were women.
- India’s female participation increased from 37% in FY2024 to 44% in FY2025, one of the greatest year-over-year improvements among major markets.
- Female participation remains highest in wellness, cosmetics, personal care, and lifestyle product categories.
- Many companies continue introducing leadership development and mentorship initiatives designed specifically for women entrepreneurs.
- Flexible scheduling and remote selling continue to be among the leading reasons women join network marketing organizations.
- Gender diversity has gradually improved in technology-focused and service-based direct selling businesses over the past several years.
Age Distribution of Network Marketing Participants
- Adults aged 35-44 years represented 24.1% of global participants in 2024.
- Individuals aged 45-54 years also accounted for 24.1%, making these the industry’s two largest age groups.
- Participants between 25 and 34 years represented 16.4% of the global workforce.
- People aged 55-64 years contributed 18.1% of worldwide participation.
- Those 65 years and older represented 10.3% of global independent representatives.
- Young adults aged 18-24 years accounted for 6.9% of participants worldwide.
- U.S. demographic data similarly shows that the 35-54 age range remains the industry’s largest participant segment.
- Middle-aged participants continue to dominate because they often combine network marketing with established careers or family responsibilities.
- Older adults increasingly participate to supplement retirement income and maintain flexible work opportunities.
Income and Earnings Statistics in Network Marketing
- In 2024, 5.4 million participants in the United States actively built network marketing businesses.
- Another 6.8 million participants primarily used their memberships to purchase products at discounted prices.
- The network marketing industry generated $163.9 billion in global retail sales during 2024.
- This massive global volume created commission opportunities for more than 104 million representatives worldwide.
- Approximately 73% of all participants join these programs specifically to earn supplemental income.
- Wellness and personal care products generate the largest commission pools by making up nearly 30% of industry sales.
- Most standard income disclosures show that over 50% of active distributors earn less than $5,000 annually.
- Industry averages indicate that only about 1% of representatives reach the highest leadership tiers to earn substantial income.
Part-Time vs Full-Time Network Marketers
- 73% of network marketers run their business part-time for under 30 hours per week.
- Only 27% of independent sellers operate full-time by working over 30 hours weekly.
- About 55% of part-time distributors balance their network marketing alongside traditional employment.
- Nearly 39% of representatives spend strictly less than 10 hours per week managing direct sales.
- Exactly 5.4 million U.S. entrepreneurs actively built a business part-time or full-time in 2024.
- Most part-timers dedicate between 5 and 20 hours weekly specifically to generate supplemental income.
- Over 35% of part-time consultants are parents who rely heavily on the industry’s flexible scheduling.
- Globally, 104.3 million representatives participate, with the vast majority operating on a part-time basis.
- Top-earning full-time leaders routinely commit 8 to 10 hours daily toward team management and training.
Product Categories and Sales Breakdown in Network Marketing
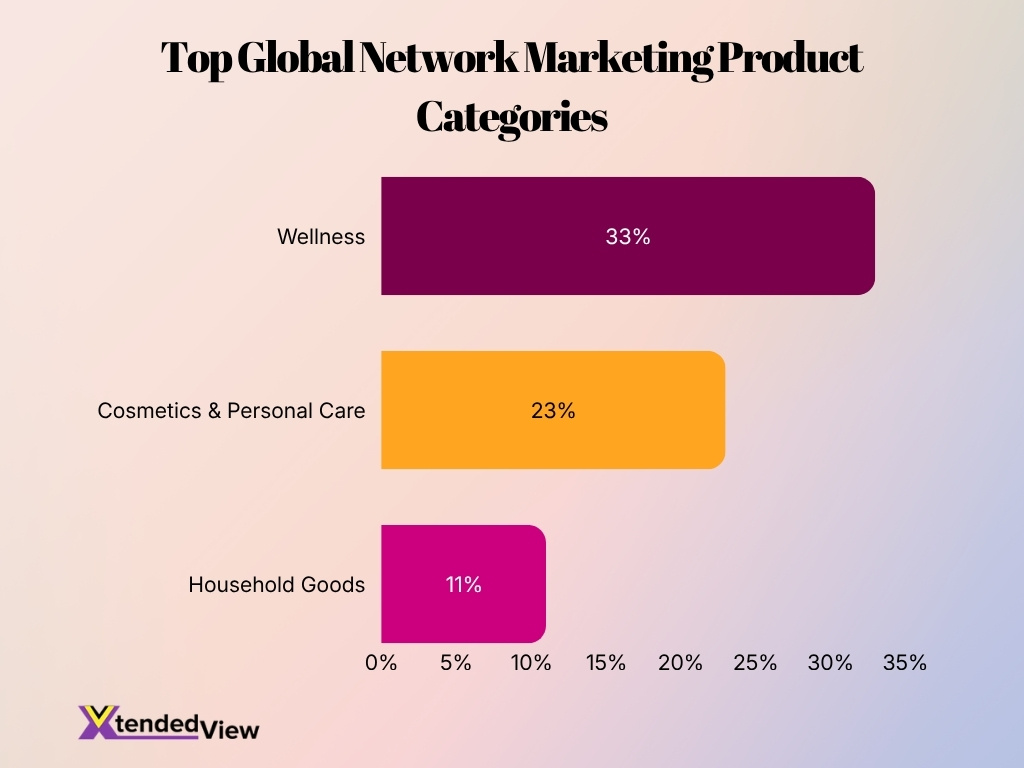
- Wellness products generated over 33% of global network marketing revenue in 2024.
- Cosmetics and personal care captured approximately 23% of the worldwide direct selling market.
- Household goods ranked third globally by accounting for roughly 11% of total industry sales.
- Health and wellness products dominated India’s direct selling revenue with a 64% share during FY2024.
- Cosmetics and personal care represented nearly 24% of the Indian network marketing industry.
- Household products contributed approximately 3% to India’s total direct selling sales.
- Global wellness sales grew by an estimated 4% due to rising demand for preventive healthcare.
- Product portfolio expansions in 2025 increased plant-based supplement offerings by nearly 15%.
Retention and Attrition Rates in Network Marketing
- Up to 60% of new distributors leave within the first 90 days of registration.
- Annual turnover rates across the network marketing industry frequently reach between 50% and 75%.
- Over 50% of representatives exit their company within the first year of joining.
- Approximately 90% of participants abandon the industry completely within five years.
- Large network marketing organizations typically lose 10% to 15% of their active partner base every quarter.
- The average annual distributor retention rate for direct selling businesses falls between 10% and 20%.
- Teams lacking digital support or onboarding can experience an annual attrition rate reaching 50% to 80%.
- Highly committed and engaged network marketing representatives are 87% less likely to leave their organization.
Network Marketing Software and Technology Adoption Statistics
- Mobile-first enrollment platforms currently support a global workforce of 104.3 million independent representatives as these digital tools become the industry standard.
- Companies leveraging AI-powered recommendation engines for personalized customer offers report 20% to 30% higher engagement rates.
- Modern digital onboarding systems featuring AI-guided workflows are now utilized by 75% of sales organizations to dramatically reduce new distributor training time.
- The widespread transition from paper systems to cloud-based CRM platforms has pushed the MLM software market to a $1.82 billion valuation.
- Early adopters of automated commission tracking and intelligent management platforms report a 35% average improvement in core performance metrics.
- Integrating social commerce and livestream selling directly into workflows has helped modern distributors boost new customer acquisition by 40%.
- AI-assisted training platforms and virtual compliance assistants now hold a 53.7% deployment share across direct selling technology upgrades.
- Equipping teams with digital analytics dashboards to monitor sales performance and customer retention has resulted in a 250% improvement in lead quality.
- Accelerating technology investments entering 2026 show that 67% of MLM companies are adopting advanced software to achieve up to 40% higher distributor retention.
Leading Network Marketing Companies by Revenue
- Global network marketing sales stabilized at $163.9 billion throughout 2024.
- The United States market alone generated $34.7 billion in retail sales.
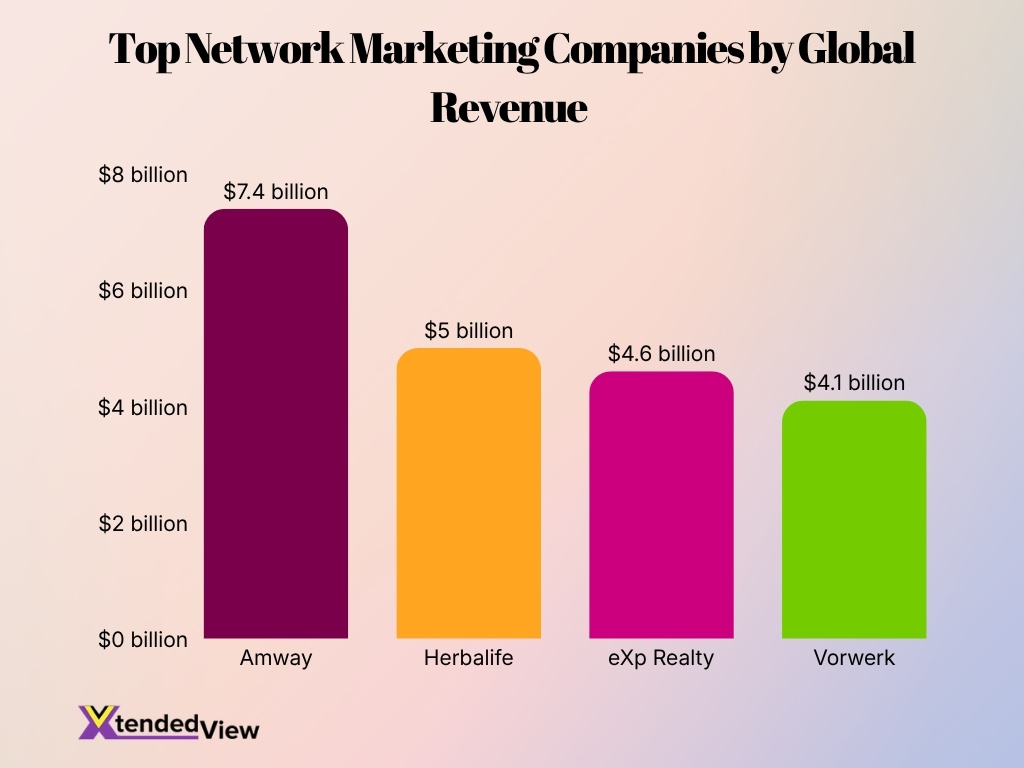
- Amway led the industry globally with an impressive $7.4 billion in revenue.
- Herbalife maintained its strong market position by generating $5.0 billion.
- The real estate firm eXp Realty ranked third with $4.6 billion in revenue.
- Exactly 21 national markets surpassed the $1 billion sales threshold globally.
- The top 10 national markets accounted for a massive 78% of worldwide sales.
- There are currently 104.3 million independent representatives operating globally.
- Women strongly dominate the industry by making up 72.1% of all global representatives.
- Germany’s Vorwerk contributed significantly to European sales with $4.1 billion.
Recruitment Channels and Onboarding Trends in Network Marketing
- Over 82% of direct sellers utilize social media as their primary recruitment and promotion channel.
- Utilizing mobile applications for rapid registration has increased distributor productivity by 24%.
- Digital commerce integration and virtual demonstrations have successfully boosted distributor engagement by 34%.
- Implementing AI-powered customer analytics and onboarding tools has improved sales conversion efficiency by 23%.
- Automated recruitment platforms and video learning sequences have enhanced global onboarding efficiency by 27%.
- Social media-driven promotional strategies and campaigns have improved customer acquisition efficiency by 29%.
- Mobile-based ordering systems now facilitate and support 61% of all direct selling transactions globally.
- Approximately 71% of modern buyers discover network marketing products and opportunities via social media platforms.
- Nearly 55% of distributors actively utilize hybrid recruitment models combining digital tools and relationship selling.
Consumer Perception and Trust in Network Marketing
- U.S. direct selling generated $34.7 billion in retail sales during 2024 alongside 34.3 million customers.
- Approximately 77% of consumers report a high level of satisfaction with their network marketing purchases.
- The wellness and personal care category drives repeat purchases by accounting for nearly 35% of global sales.
- Over 70% of independent distributors fostering long-term consumer trust in the industry are women.
- Roughly 84% of buyers state they strongly trust recommendations from personal network contacts over traditional ads.
- Companies shifting toward customer-first models experience an average annual customer retention rate of 40% to 50%.
- More than 60% of modern network marketing businesses leverage verified digital testimonials to influence purchasing decisions.
- The global direct selling market is projected to surpass $250 billion by 2026, driven by improved consumer confidence.
Network Marketing Success and Failure Statistics
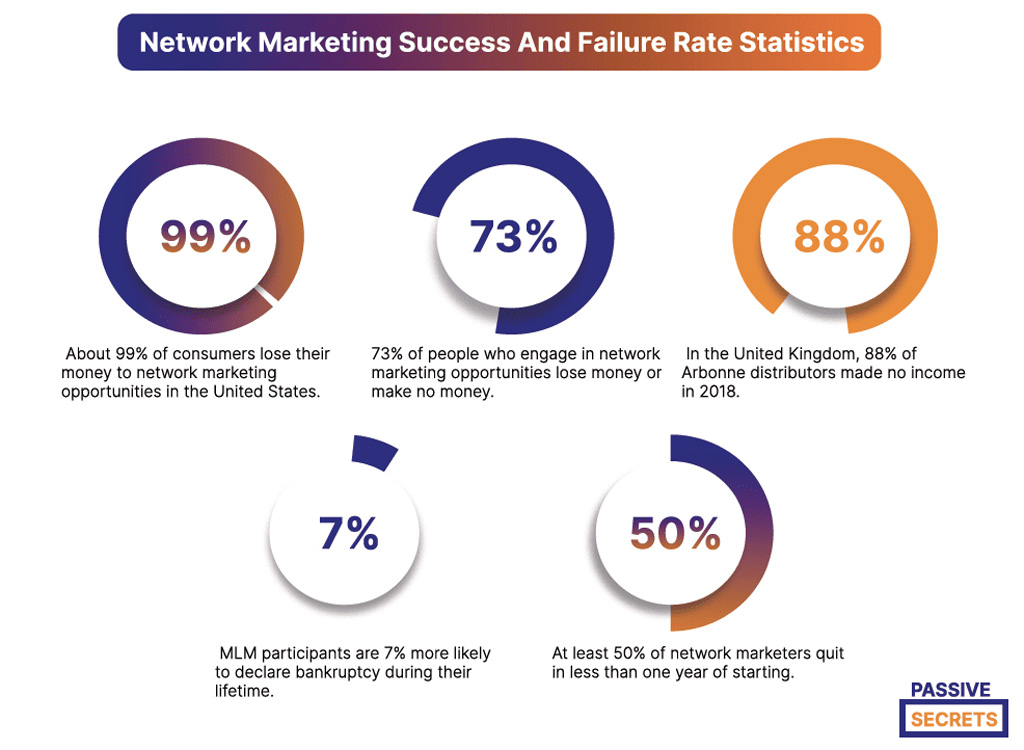
- Approximately 99% of U.S. consumers reportedly lose money through network marketing opportunities.
- Around 73% of network marketing participants either lose money or earn no income from their involvement.
- In the United Kingdom, 88% of Arbonne distributors reportedly earned no income in 2018.
- MLM participants are estimated to be 7% more likely to declare bankruptcy during their lifetime.
- At least 50% of network marketers quit the industry within their first year.
- The figures indicate that financial losses and zero earnings are common outcomes among network marketing participants.
- High first-year attrition suggests that retention remains a major challenge for network marketing companies.
Frequently Asked Questions (FAQs)
The global network marketing (direct selling) industry generated $163.9 billion in retail sales during 2024.
Approximately 104.3 million independent representatives participated in network marketing globally in 2024.
Women accounted for 72.1% of independent representatives worldwide in 2024.
The U.S. direct selling industry recorded $34.7 billion in retail sales during 2024.
Asia-Pacific led the global market with a 40.3% share of worldwide network marketing revenue in 2024.
Conclusion
The network marketing industry entered the year with signs of renewed stability after several challenging years. Global retail sales remained resilient at $163.9 billion, participation exceeded 104 million independent representatives, and wellness products continued driving demand across major markets. At the same time, AI-powered tools, digital onboarding, mobile commerce, and stronger compliance practices are reshaping how companies recruit distributors and serve customers. While mature markets continue generating most industry revenue, emerging economies such as India are recording some of the fastest growth rates. Together, these trends indicate that network marketing is evolving toward a more technology-enabled, customer-focused, and globally diversified business model.
