The competition between Apple’s iPad lineup and Samsung’s Galaxy Tab series continues to shape the global tablet industry. Both brands dominate consumer, education, enterprise, and entertainment markets, with tablets now playing a central role in remote work, mobile gaming, streaming, and digital classrooms. Businesses increasingly deploy iPads for field operations and retail systems, while Samsung Galaxy Tabs remain popular for Android productivity ecosystems and affordable premium experiences. The statistics in this article reveal how both brands compare across market share, shipments, revenue, and user adoption trends worldwide.
Editor’s Choice
- Apple controlled 51.35% of the global tablet vendor market in April 2026, while Samsung held 26.57%.
- Apple shipped 17.1 million iPads in Q4 2025, capturing 41.9% quarterly market share globally.
- Samsung shipped 6.4 million Galaxy Tabs in Q4 2025, though shipments declined 7.5% year over year.
- Global tablet shipments increased by 9.8% in 2025, reaching nearly 162 million units worldwide.
- Apple sold approximately 57 million iPads in 2024, up 5.3% annually.
- In the United States tablet market, Apple held 58.15% share in 2026, compared to Samsung’s 18.29%.
- Apple’s premium iPad strategy contributed to the expected 10% shipment growth in 2026.
- Apple generated over $435 billion in annual revenue during 2025, supported partly by a strong iPad sales recovery.
- Samsung maintained its position as the world’s second-largest tablet vendor throughout 2025 despite declining shipments.
Recent Developments
- Apple introduced refreshed iPad Pro models powered by the M5 chip in 2025, boosting premium tablet demand globally.
- Entry-level iPads accounted for nearly 52% of Apple’s quarterly tablet sales during Q4 2025.
- Samsung expanded Galaxy AI capabilities across newer Galaxy Tab devices in 2025 to strengthen productivity features.
- Apple’s iPad shipments rose 16.5% year over year in Q4 2025.
- Samsung’s foldable ecosystem growth improved cross-device integration with Galaxy Tabs and Galaxy Z Fold devices in 2025.
- The tablet industry recorded its sixth consecutive quarter of shipment growth in Q2 2025.
- Apple reportedly explored the development of a foldable iPad with a launch target around 2028.
- Global tablet shipments grew 5% in early 2026, though analysts warned replacement demand could slow.
- Samsung experienced stronger competition from Chinese tablet brands during 2025, particularly in Asia and Europe.
- Apple’s iPad lineup benefited from increased education and hybrid work demand entering 2026.
Global Tablet Market Share: Apple iPad vs Samsung Galaxy Tab
- Apple led the worldwide tablet vendor market with 51.35% share in April 2026.
- Samsung ranked second globally with 26.57% market share in April 2026.
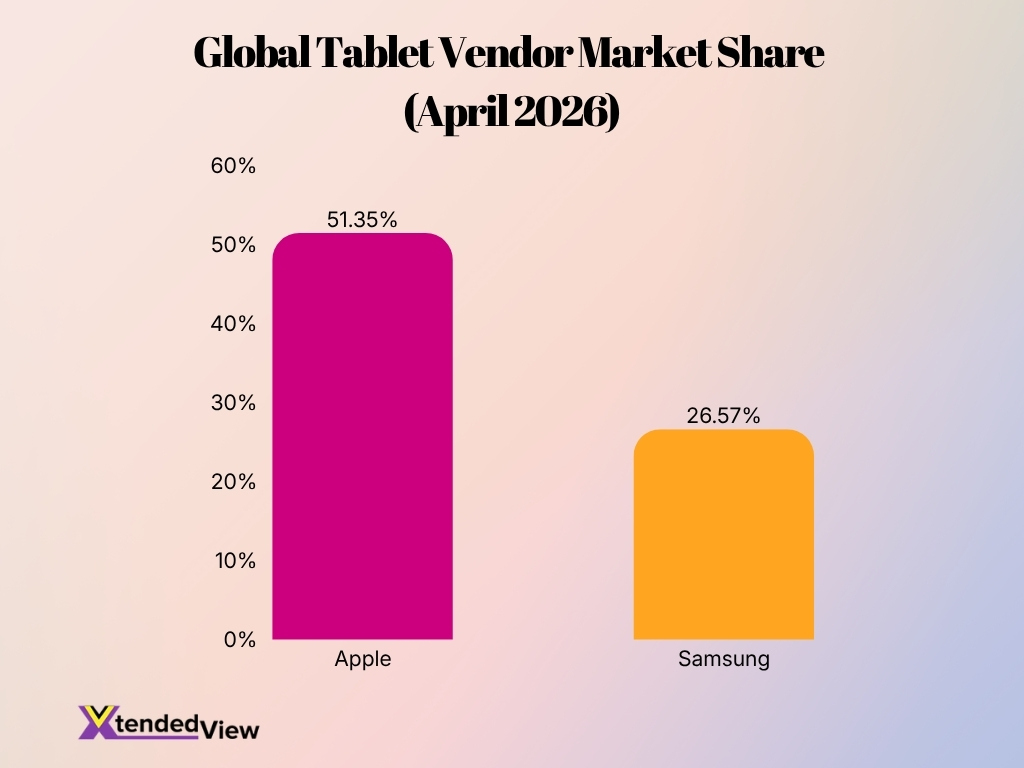
- Apple’s global tablet market share exceeded Samsung’s by nearly 25 percentage points in 2026.
- Apple captured 44.9% market share during Q4 2025 tablet shipments.
- Samsung held 14.7% quarterly market share in Q4 2025 tablet shipments.
- Apple maintained the top tablet position for more than a decade due to strong ecosystem loyalty and premium hardware adoption.
- Samsung remained the largest Android tablet manufacturer worldwide entering 2026.
- Apple dominated the US tablet market with 58.15% share, while Samsung captured 18.29%.
- Worldwide tablet shipments grew nearly 10% in 2025, helping both Apple and Samsung increase installed user bases.
- Apple’s premium-focused strategy continued outperforming Samsung in high-end tablet revenue share during 2025.
iPad vs Samsung Galaxy Tab Sales Growth and Performance
- Apple maintained its market dominance with a 41.9% global market share in Q4 2025.
- Apple achieved a significant 16.5% year-over-year shipment growth during the 2025 calendar year.
- Samsung held the second position globally but saw its Q4 2025 shipments decline by 9.2%.
- Global tablet shipments reached 151.9 million units in 2025, marking a 5% annual increase.
- Entry-level iPad models accounted for 52% of total Apple tablet sales during the 2025 holiday quarter.
- Samsung captured a 17.8% global market share in the tablet sector throughout 2025.
- Apple’s Q4 2025 shipments reached 17.1 million units as part of its strong seasonal performance.
- Samsung’s Q4 2025 shipments totaled 6.4 million units amid increasing competitive pressure.
- The global tablet market grew by 1.9% in Q4 2025, reaching 40.9 million units shipped.
Revenue and Profitability Comparison
- Apple’s overall annual revenue crossed $435 billion in 2025, setting a company record.
- Apple reported 16% year-over-year revenue growth during Q4 2025.
- Apple’s hardware business revenue increased 16% annually in late 2025.
- Apple’s iPad division generated over $7 billion in quarterly revenue during strong upgrade cycles in 2024.
- Samsung generated lower tablet profit margins than Apple due to heavier competition in Android pricing tiers.
- Apple’s premium tablet pricing strategy improved profitability despite slower unit growth compared with smartphones.
- Entry-level iPads contributed significantly to Apple’s shipment volume, while Pro models drove profitability.
- Samsung relied more heavily on mid-range Galaxy Tab devices, which generally produce thinner hardware margins.
- Apple maintained stronger ecosystem monetization through App Store purchases, subscriptions, and accessories tied to iPads.
- Analysts expect Apple to retain higher tablet operating margins than Samsung through 2026 because of tighter hardware-software integration.
Annual Tablet Shipment Trends for iPad and Samsung Galaxy Tab
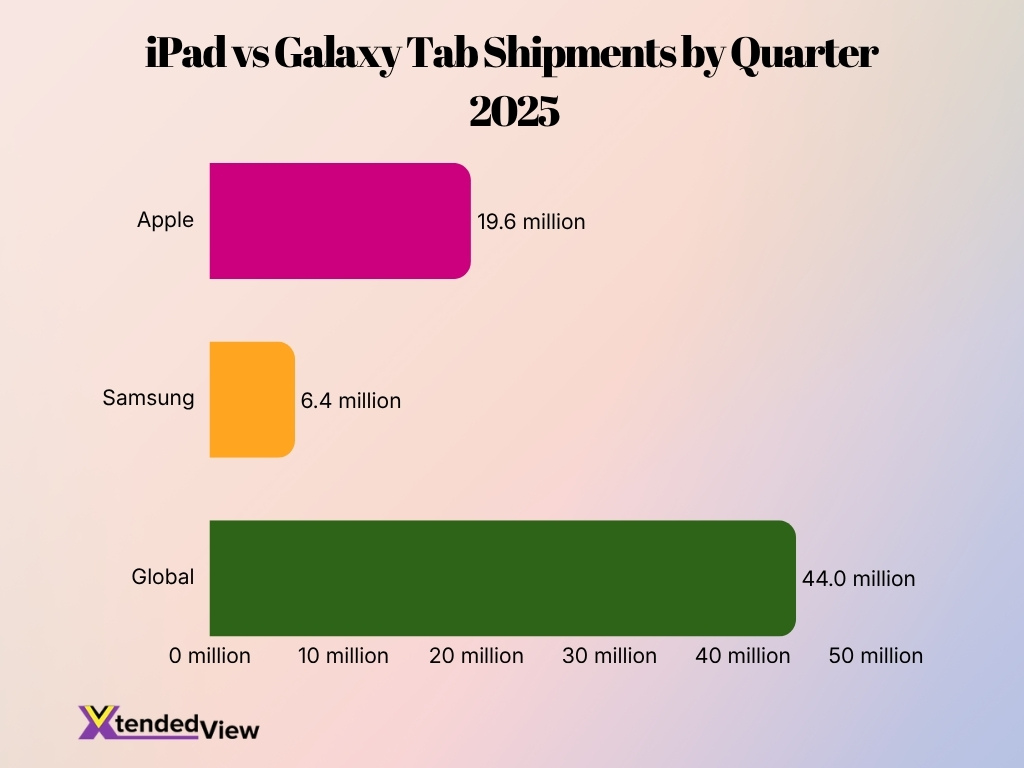
- Apple shipped 19.6 million iPads during Q4 2025.
- Samsung shipped approximately 6.4 million tablets during the same quarter.
- Apple’s Q4 2025 iPad shipments increased 16.5% year over year.
- Samsung’s quarterly tablet shipments declined 9.2% annually in Q4 2025.
- Worldwide tablet shipments reached approximately 44 million units in Q4 2025.
- Global tablet shipments totaled around 162 million units in 2025.
- Apple shipped 14.1 million iPads in Q2 2025, representing 2% annual growth.
- Samsung faced shipment pressure due to aggressive pricing from Xiaomi and Lenovo tablets in emerging markets.
- Apple’s shipment growth benefited from strong demand for both entry-level iPads and high-end iPad Pros.
- Analysts projected continued but slower shipment growth across the tablet market through 2026.
Regional Market Dominance: iPad vs Samsung Galaxy Tab Adoption
- Apple commanded a 51.35% share of the global tablet market as of April 2026.
- Samsung maintained a 26.57% global market share in the tablet vendor segment by April 2026.
- In Europe, Apple held 47.23% of the tablet market compared to Samsung’s 31.26% share in April 2026.
- Samsung captured a 31% market share in India during 2025, supported by the Galaxy Tab A series.
- Apple ranked as the second-largest tablet player in India in 2025 with a 20% market share.
- In the fourth quarter of 2025, Apple secured a 41.9% market share in global tablet shipments.
- Android operating systems accounted for approximately 47.8% of global tablet revenue during 2025.
- Apple’s iPad lineup continued to drive revenue leadership with a significant share of the premium device segment.
- The global tablet market was valued at $112.4 billion in 2026, reflecting ongoing competition between major vendors.
Consumer Spending and Price Segment Statistics for iPad and Galaxy Tab
- The average selling price of an iPad exceeded $610 globally in 2025.
- Samsung’s average Galaxy Tab selling price remained below $430 during 2025 due to higher mid-range sales volume.
- Apple’s premium iPad Pro models priced above $999 experienced double-digit sales growth in 2025.
- More than 48% of Samsung tablet buyers globally purchased devices in the mid-range segment below $500.
- Apple generated higher revenue per user because iPad buyers spent more on accessories and subscriptions.
- Samsung’s Galaxy Tab FE lineup became one of the company’s fastest-growing tablet categories during 2025.
- US consumers spent over $14 billion on tablets in 2025, with Apple accounting for the majority of premium purchases.
- Refurbished iPad demand increased by 18% year over year in 2025 because of rising premium tablet prices.
- Samsung tablets under $300 represented a major growth driver in education and family entertainment markets.
- Apple users spent significantly more on stylus accessories, with Apple Pencil sales rising alongside iPad Pro adoption.
Tablet OS Market Share Worldwide
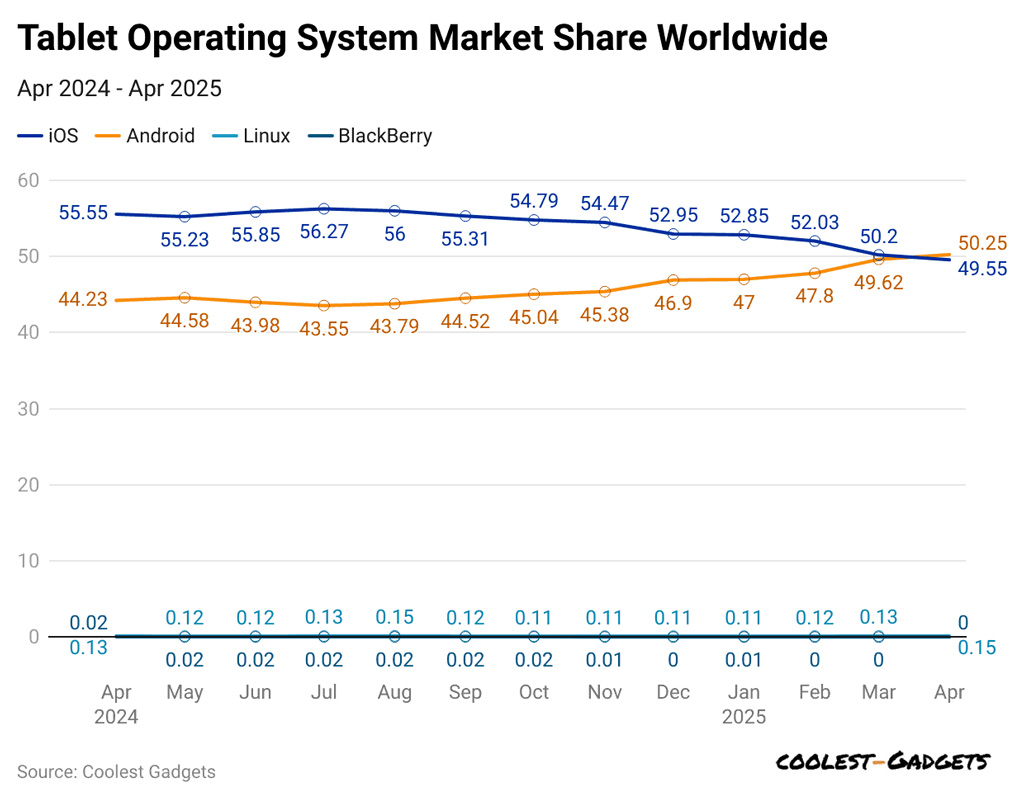
- Android overtook iOS in April 2025, reaching 50.25% market share, while iOS fell to 49.55%.
- iOS led the tablet operating system market for most of the period, staying above 50% share from April 2024 to March 2025.
- Android showed steady growth, rising from 44.23% in April 2024 to 50.25% in April 2025, gaining 6.02 percentage points in one year.
- iOS declined consistently in late 2024 and early 2025, dropping from its peak of 56.27% in July 2024 to 49.55% in April 2025.
- The market gap between iOS and Android narrowed sharply, from 11.32 percentage points in April 2024 to Android leading by 0.70 percentage points in April 2025.
- March 2025 was the closest month before Android’s lead, with iOS at 50.20% and Android at 49.62%.
- Linux remained negligible throughout the period, fluctuating between 0.00% and 0.15% market share.
- BlackBerry had almost no presence in the tablet OS market, mostly staying near 0.00% to 0.02%, except in April 2025, when it reached 0.15%.
- The data suggests a clear shift in the global tablet OS market, with Android gaining momentum while iOS is gradually losing share.
- By April 2025, the tablet OS market became nearly evenly split between the two major platforms, with Android slightly ahead of iOS.
Business and Enterprise Market Share: iPad vs Samsung Galaxy Tab
- Apple maintained a dominant 51.35% global market share in the tablet sector as of early 2026.
- Samsung secured the second position globally with a 26.57% share of the tablet market by April 2026.
- Global tablet shipments reached 162 million units in 2025, representing a 9.8% year-over-year increase.
- Apple recorded 19.6 million iPad shipments in the final quarter of 2025, marking a 16.5% growth compared to the previous year.
- Samsung tablet shipments totaled 6.4 million units in the fourth quarter of 2025 amid competitive market pressure.
- The global tablet market reached a valuation of $92.7 billion in 2025, with a significant focus on enterprise deployments.
- Projections indicate the tablet market will experience a 9.87% compound annual growth rate through 2031, driven by business adoption.
- In late 2025, Apple captured 44.9% of the global tablet market share, leading all other hardware manufacturers.
- Samsung accounted for 14.7% of the global tablet market share during the 2025 holiday quarter.
- Enterprise and business tablet segments are identified as the fastest-growing areas within the global hardware market for 2026.
Gaming and Entertainment Usage Statistics
- Global mobile gaming revenue reached approximately $107 billion in 2026.
- Apple maintained a dominant 51.35% global tablet market share as of April 2026.
- Samsung captured 26.57% of the worldwide tablet market share by early 2026.
- Approximately 27% of global live streaming consumption occurs on mobile devices like tablets.
- Mobile gamers spent an average of 8.45 hours per week on gaming activities in 2025.
- Xbox Cloud Gaming usage experienced a 45% year-over-year growth for subscribers in 2025.
- Gaming apps comprise roughly 12.3% of the total available iOS application ecosystem in 2026.
- Mobile advertising revenue is projected to reach $131 billion globally in 2026.
- Women represent 46% of the global gaming population, with 44% gaming exclusively on mobile devices.
Performance and Processing Benchmarks
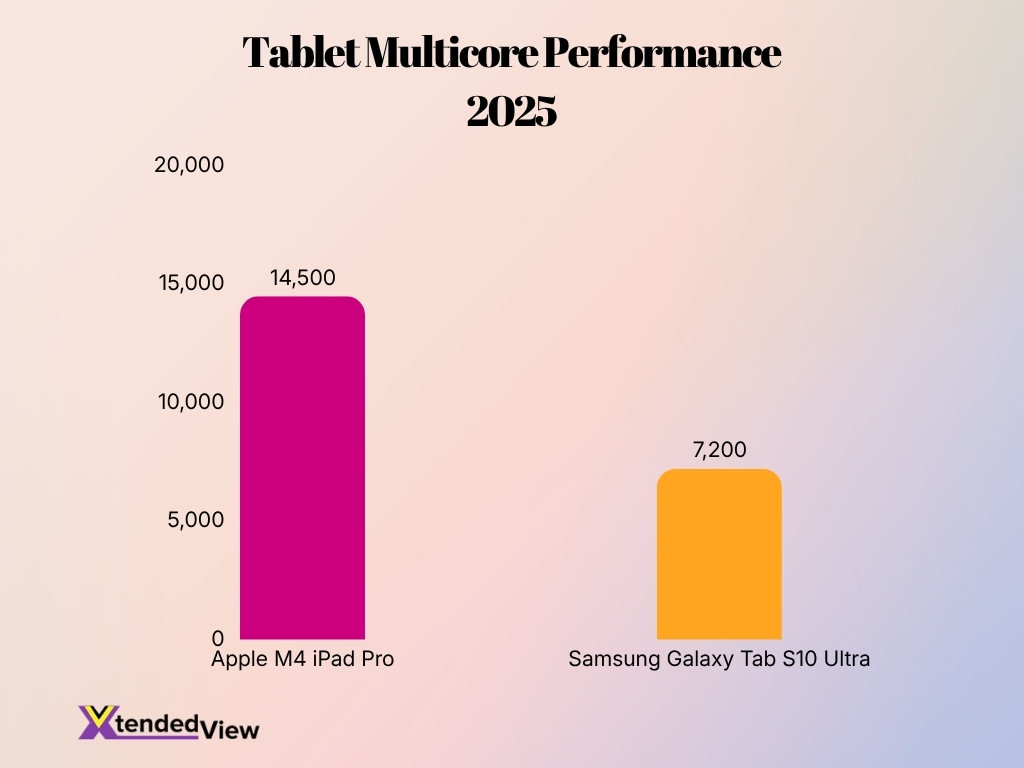
- Apple’s M4-powered iPad Pro consistently exceeded 14,500 points in multicore Geekbench testing throughout 2025.
- The Samsung Galaxy Tab S10 Ultra achieved peak multicore benchmark scores surpassing 7,200 points during 2025.
- Apple’s flagship M-series tablets demonstrated nearly 2x faster raw CPU performance compared to typical Android rivals entering 2026.
- Samsung delivered a 28% increase in GPU performance for the Galaxy Tab S10 series compared to the previous S9 generation.
- Hardware-accelerated ray tracing on M-series iPads boosted AAA gaming frame stability by significant margins in 2025.
- Android tablets maintained market-leading flexibility, with Samsung capturing a 31% share of the Indian tablet market in 2025.
- Internal testing indicated Apple Silicon chips consumed 15% less power per high-intensity productivity workload than comparable Android platforms.
- Market surveys from 2025 confirmed that 62% of premium tablet buyers prioritized processor performance as their top purchasing factor.
- Samsung’s flagship tablets supported up to 1.5TB of expandable storage, offering superior hardware versatility for professional workflows.
- Professional benchmarks showed Apple’s M-series tablets completing 4K video exports up to 40% faster than leading Android alternatives.
Display and Design Statistics
- In 2025, AMOLED technology maintained a dominant 70.7% share of the total display market.
- Samsung captured a 35% market share in the premium tablet segment by the end of 2025.
- The 14.6-inch display size became a standard for ultra-premium tablets, accounting for a significant 85% of large-screen shipments.
- New tandem OLED technology in premium tablets enabled 1,600 nits of peak HDR brightness.
- Flagship tablets achieved an ultra-slim design thickness of just 5.1 mm during the 2025 release cycle.
- Consumer data indicates 81% of tablet shipments in 2025 were driven by high-performance, productivity-focused configurations.
- Demand for 12GB RAM configurations in premium tablets surged by 1,359% year-over-year in 2025.
- The global tablet market experienced a 9.2% growth in shipments as consumers prioritized display quality and design.
Battery and Hardware Longevity Metrics: iPad vs Samsung Galaxy Tab
- Apple advertised up to 10 hours of battery life for most iPad models in 2025.
- Samsung Galaxy Tab Ultra devices delivered battery capacities exceeding 11,000mAh in premium models.
- Apple’s M-series processors improved battery efficiency by nearly 20% compared with earlier iPad chipsets.
- Samsung supported faster charging speeds, with select Galaxy Tabs reaching 45W wired charging in 2025.
- iPads maintained stronger long-term software support, averaging 6 to 7 years of major updates.
- Samsung expanded Android update commitments to up to 7 years for flagship Galaxy Tab devices entering 2026.
- Apple devices showed lower annual battery degradation rates in long-term user testing compared with many Android tablets.
- More than 71% of tablet buyers considered battery life one of the top three purchase factors in 2025.
- Samsung tablets gained popularity among travelers and entertainment users because of larger battery capacities and OLED efficiency.
- Apple’s aluminum construction and ecosystem repair support contributed to higher hardware longevity ratings globally.
Most Common Tablet Use Cases Among iPad and Galaxy Tab Users
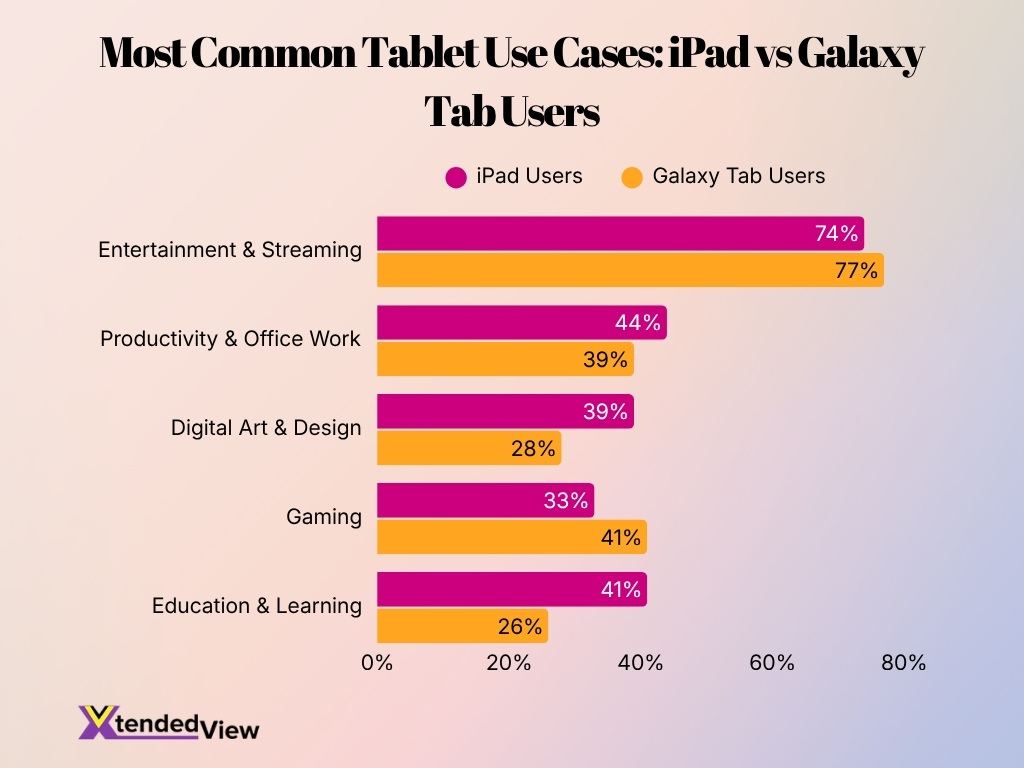
- Entertainment & Streaming is the top use case for both tablet groups, with 77% of Galaxy Tab users and 74% of iPad users using their devices for watching videos, streaming shows, or media consumption.
- Galaxy Tab users slightly lead in entertainment usage, with a 3 percentage-point advantage over iPad users, showing a stronger appeal for content consumption.
- Productivity & Office Work is more common among iPad users, with 44% using iPads for work-related tasks compared to 39% of Galaxy Tab users.
- Digital Art & Design shows a clear iPad advantage, as 39% of iPad users use their device for creative work compared to only 28% of Galaxy Tab users.
- Gaming is more popular on Galaxy Tab, with 41% of Galaxy Tab users using their tablets for gaming versus 33% of iPad users.
- Education & Learning is significantly stronger among iPad users, with 41% using iPads for learning compared to 26% of Galaxy Tab users.
- The biggest gap appears in Education & Learning, where iPad leads Galaxy Tab by 15 percentage points, suggesting stronger adoption in academic and learning environments.
- iPad performs better in productivity, digital art, and education, while Galaxy Tab performs better in entertainment and gaming.
- Overall, the data suggests that iPads are more work-, creativity-, and learning-focused, while Galaxy Tabs are more entertainment- and gaming-oriented.
Tablet Lifecycle and Replacement Rates: iPad vs Samsung Galaxy Tab
- The average global tablet replacement cycle is expected to extend to 4.1 years by 2025.
- Apple’s installed base of active devices reached over 2.5 billion units in early 2026.
- Refurbished electronics market share for tablets reached 14.8% in 2025.
- Approximately 76% of consumers are refusing to upgrade hardware until new features justify the cost.
- Apple captured 41.9% of the global tablet market share in 4Q25.
- Samsung maintained the second position globally with a 14.7% market share as of 2025.
- Global tablet shipments grew by 9.8% in 2025 to reach 162 million units.
- About 42% of mobile device users cite battery life as the primary driver for upgrading hardware.
- The second-hand electronics market reached a global value of $139.5 billion in 2025.
- Over 80% of the global tablet market is controlled by the top five manufacturers.
Refurbished and Resale Value Statistics for iPad and Galaxy Tab
- Refurbished iPad prices retained approximately 67% of their original value after two years in 2025.
- Samsung Galaxy Tabs retained around 45% to 50% of their original resale value after two years.
- Apple tablets consistently ranked among the highest-value refurbished consumer electronics globally.
- Refurbished iPad demand increased by 18% year over year during 2025.
- Samsung tablets experienced faster price depreciation in entry-level Android categories.
- Apple’s strong secondary market reduced the effective long-term ownership cost of iPads.
- More than 52% of refurbished tablet buyers preferred Apple devices entering 2026.
- Samsung’s refurbished Galaxy Tab market grew steadily in emerging economies because of affordability trends.
- Apple Certified Refurbished programs strengthened buyer confidence in secondhand iPad purchases.
- Refurbished tablet sales globally surpassed $18 billion in market value during 2025.
Customer Satisfaction and Brand Loyalty Statistics
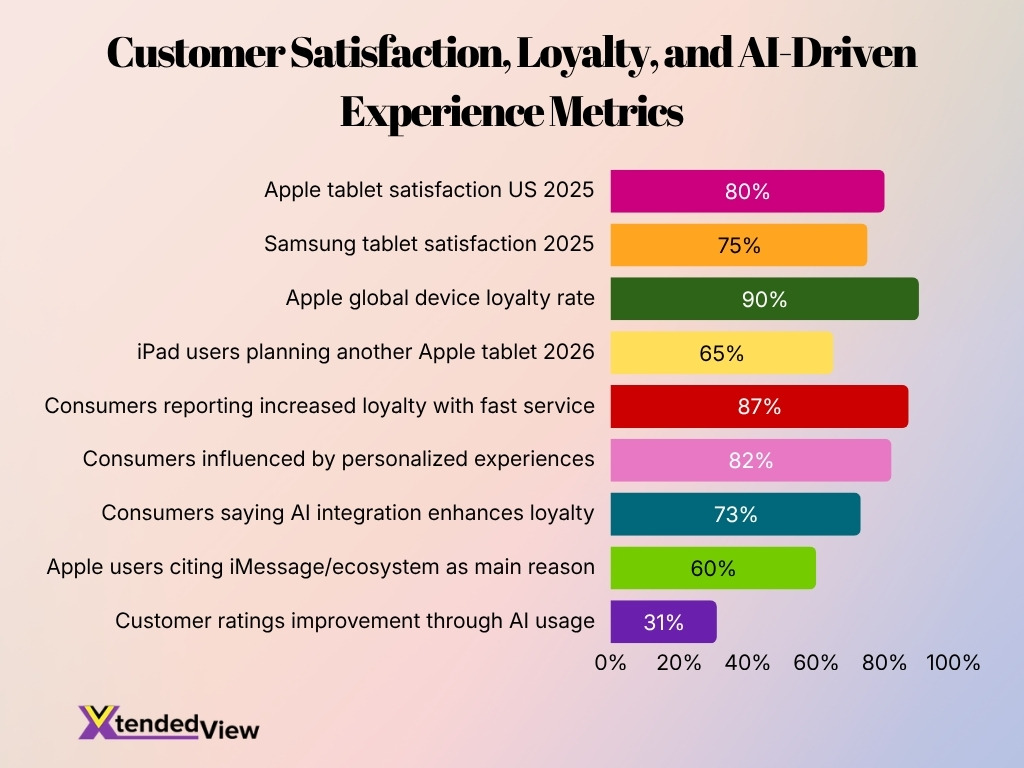
- Apple achieved a customer satisfaction rating above 80% among US tablet users in 2025.
- Samsung tablet satisfaction scores remained consistently above 75% throughout 2025.
- Apple maintained a high global device loyalty rate, with figures exceeding 90% among existing users.
- More than 65% of iPad users reported plans to purchase another Apple tablet for their next upgrade in 2026.
- Approximately 87% of consumers report increased brand loyalty when companies provide fast and effective customer service.
- 82% of consumers state that personalized experiences significantly influence their brand choice during shopping decisions.
- Apple captures a 62% market share in the global premium smartphone segment, driving broader ecosystem brand loyalty.
- 73% of consumers report that AI integration enhances their overall brand loyalty and engagement experience.
- 60% of Apple users consider iMessage and ecosystem connectivity as the primary reasons for staying with the brand.
- Roughly 76% of customer experience leaders report that customer ratings improved by 31% on average through AI usage.
Future Trends and Forecasts
- Global tablet market revenue is forecast to reach $125.27 billion by 2027.
- OLED display penetration in the premium tablet segment is projected to exceed 45% by 2027.
- The AI productivity tools market is expanding at a significant 19.50% CAGR through 2035.
- Premium tablet demand remains resilient, helping drive a 3.9% increase in total market value during 2026.
- LTPO-AMOLED display technology is expected to be featured in over 35% of high-end tablets by 2031.
- Enterprise and business segments represent the fastest-growing category for tablet adoption through 2031.
- Apple continues to lead the premium space with AI-capable chips, seeing 24% revenue growth in key quarters.
- Samsung remains a dominant Android manufacturer, maintaining focus on ecosystem-wide AI feature integration.
- Flexible and foldable display technologies are key drivers for the 10.81% CAGR growth in the OLED market.
- Total market value for tablets is expected to climb to $158.37 billion by 2030.
Frequently Asked Questions (FAQs)
Apple held 51.35% of the worldwide tablet vendor market in April 2026, while Samsung held 26.57%.
Apple shipped 17.1 million iPads globally in Q4 2025 and captured 41.9% market share.
Samsung shipped approximately 6.4 million Galaxy Tabs in Q4 2025, despite a 7.5% year-over-year decline.
Global tablet shipments reached around 162 million units in 2025, growing nearly 9.8% year over year.
The global tablet market is projected to grow at a 9.29% CAGR from 2026 to 2034, reaching $211.2 billion by 2034.
Conclusion
Apple and Samsung continue to dominate the global tablet market, but they compete with different strengths. Apple leads in premium market share, ecosystem loyalty, enterprise deployments, and long-term resale value, while Samsung remains highly competitive through AMOLED displays, flexible Android experiences, and aggressive pricing across multiple regions.
The data also shows that tablets have evolved beyond casual media devices. Businesses now use them for field operations, schools deploy them for digital learning, and creators rely on them for design and video production workflows. Looking ahead, AI-powered features, foldable displays, OLED adoption, and deeper ecosystem integration will likely shape the next phase of competition between iPads and Samsung Galaxy Tabs.