



The Internet of Things (IoT) connects billions of physical devices that collect, exchange, and analyze data in real time. Businesses use IoT to improve factory operations, monitor healthcare patients remotely, optimize logistics, and power smart homes, while cities rely on connected sensors to manage traffic, utilities, and public safety. As AI, edge computing, and 5G continue to expand, IoT has become a core technology across nearly every industry. Explore the statistics below to understand how IoT is growing and where the market is headed next.
Editor’s Choice
- The global IoT market reached $864.32 billion in 2025 and is projected to surpass $1.05 trillion in 2026, reflecting continued enterprise and consumer adoption.
- Worldwide IoT revenue is expected to reach approximately $1.18 trillion in 2026, with the United States remaining the largest national market.
- The number of connected IoT devices increased from 18.5 billion in 2024 to an estimated 21.1 billion in 2025, with projections approaching 24 billion in 2026.
- North America accounted for 32.4% of the global IoT market in 2025, maintaining its position as the leading regional market.
- Industrial IoT is projected to generate more than $321 billion in revenue during 2026, making it the largest IoT segment worldwide.
- Around 45% of U.S. internet households now own at least one smart home device, highlighting strong consumer adoption.
- AI-powered IoT deployments continue to expand rapidly, with AIoT connections forecast to exceed 9 billion by 2033, driven by automation and predictive analytics.
Recent Developments
- The global IoT industry entered the trillion-dollar revenue era in 2026, fueled by cloud computing, AI, and edge intelligence.
- Matter, the open smart home standard, continues to improve interoperability across connected devices, reducing ecosystem fragmentation.
- AI integration has become a major trend, allowing IoT platforms to detect anomalies, automate maintenance, and improve cybersecurity.
- Governments are expanding IoT cybersecurity requirements as connected infrastructure grows. Recent proposals include broader certification frameworks for IoT devices beyond surveillance equipment.
- Edge computing adoption continues to increase because organizations need lower latency for manufacturing, healthcare, and transportation workloads.
- Enterprise IoT spending continues shifting toward integrated ecosystems that combine sensors, AI, analytics, and cloud platforms instead of standalone devices.
- Smart infrastructure investments remain a leading growth driver as governments modernize utilities, transportation systems, and energy grids.
- The United States is expected to generate approximately $420 billion in IoT revenue during 2026, reinforcing its leadership in connected technologies.
Internet of Things Overview
- The Internet of Things refers to a network of physical devices equipped with sensors, software, and connectivity that exchange data over the internet.
- IoT applications span manufacturing, healthcare, transportation, agriculture, retail, utilities, logistics, and smart cities.
- Enterprise IoT represented roughly 45% of all connected IoT devices in 2025, demonstrating strong commercial adoption.
- The technology combines sensors, wireless communications, cloud infrastructure, analytics, and increasingly AI to automate decision-making.
- Smart factories use IoT for predictive maintenance, reducing downtime and improving production efficiency.
- Healthcare providers deploy connected medical devices for continuous patient monitoring and remote care delivery.
- Smart homes continue expanding through connected thermostats, lighting systems, appliances, cameras, and security products.
- IoT increasingly works alongside AI, cloud computing, edge computing, and 5G to create intelligent digital ecosystems.
Global IoT-Connected Devices
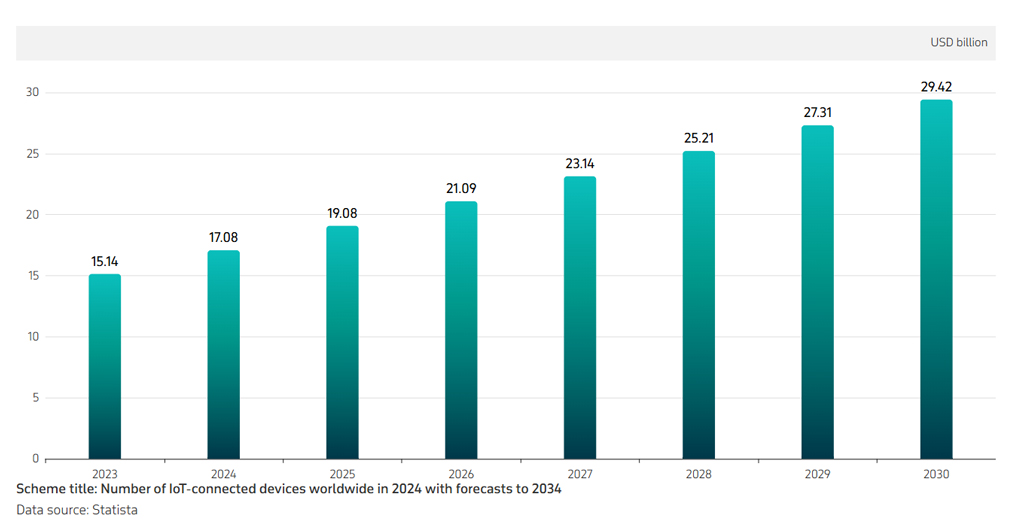
- The number of IoT-connected devices worldwide is projected to rise from 15.14 billion in 2023 to 29.42 billion by 2030.
- Global IoT device connections are expected to grow by approximately 94.3% between 2023 and 2030, nearly doubling in seven years.
- In 2024, the number of connected IoT devices reached 17.08 billion, an increase of 1.94 billion from the previous year.
- IoT connections are forecast to surpass 20 billion in 2026, reaching approximately 21.09 billion devices.
- By 2027, the global IoT ecosystem is expected to include 23.14 billion connected devices.
- The total is projected to exceed 25 billion devices in 2028, highlighting the rapid adoption of connected technologies.
- Annual IoT device growth remains steady, adding roughly 2 billion new connections each year throughout the forecast period.
- By 2030, there could be about 3.8 IoT devices per person globally, based on a world population of approximately 7.8 billion.
IoT Market Size and Growth
- The worldwide IoT market was valued at $864.32 billion in 2025.
- Market value is forecast to grow to approximately $1.055 trillion in 2026, representing 23.1% CAGR through the long-term forecast period.
- Another industry forecast estimates the IoT market at $1.60 trillion in 2025, reaching $3.27 trillion by 2033.
- Statista estimates worldwide IoT revenue at $1.18 trillion during 2026.
- North America remained the largest regional market, accounting for 32.4% of global revenue in 2025.
- Cloud deployment, AI analytics, and industrial automation remain the strongest contributors to market expansion.
- Manufacturing, healthcare, transportation, retail, and energy continue attracting the highest enterprise IoT investments.
- Continued improvements in connectivity, semiconductor costs, and software platforms are accelerating IoT adoption worldwide.
IoT Spending and Revenue
- Global IoT revenue is forecast to reach $1.3 trillion in 2026, driven by widespread digital transformation.
- The worldwide IoT market was valued at $864.3 billion in 2025, indicating strong year-over-year market momentum.
- Enterprise IoT spending is projected to grow rapidly, advancing at a 13.9% CAGR to reach $774.5 million by 2031.
- Industrial IoT stands as the largest ecosystem segment, valued at $514 billion in 2025 and crossing $600 billion in 2026.
- North America dominates global IoT investments, capturing a 32.4% market share and generating $279.7 billion in 2025.
- Smart city infrastructure spending reached $312 billion globally in 2025, fueled by intelligent transportation and utility grids.
- By 2026, cloud-based deployments are expected to account for exactly 54.3% of the IoT solutions and services market.
- The Internet of Medical Things market is expected to climb rapidly, reaching an estimated $257 billion valuation in 2026.
- The global IoT analytics market size is actively expanding, valued at $35.4 billion in 2026 with a 21.2% CAGR.
Global IoT Use Case Adoption
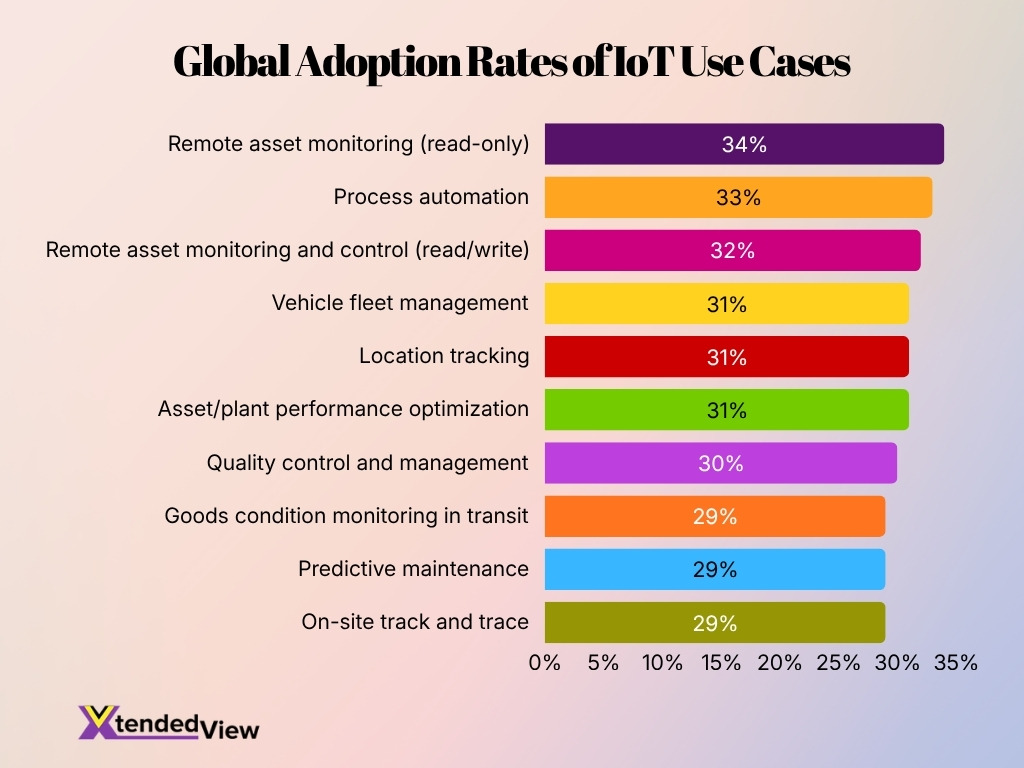
- Remote asset monitoring leads global IoT adoption at 34%, showing strong demand for real-time visibility into equipment and operations.
- Process automation ranks second at 33%, highlighting the growing use of IoT to improve efficiency and reduce manual workloads.
- Remote asset monitoring and control records a 32% adoption rate, as businesses increasingly manage connected assets from a distance.
- Vehicle fleet management, location tracking, and asset or plant performance optimization each reach 31% adoption worldwide.
- Quality control and management is adopted by 30% of organizations, reflecting IoT’s expanding role in maintaining production standards.
- Goods condition monitoring in transit reaches 29%, helping companies track temperature, handling, and product conditions during transportation.
- Predictive maintenance also stands at 29%, allowing businesses to detect equipment issues before costly failures occur.
- On-site track and trace records 29% adoption, supporting better inventory visibility, workflow management, and asset identification.
- Overall adoption rates range from 29% to 34%, indicating that businesses are using IoT across a broad mix of operational applications.
IoT Connections Worldwide
- Global connected IoT devices are expected to increase from 21.1 billion in 2025 to approximately 24.1 billion in 2026.
- Worldwide IoT connections are projected to reach 39 billion by 2030, highlighting sustained long-term growth.
- Enterprise deployments represented roughly 45% of all connected IoT devices in 2025, reflecting strong commercial adoption.
- In the European Union, 70.9% of individuals used internet-connected devices during 2024.
- The Netherlands recorded the highest connected-device usage in the EU at 94.8%, followed by Ireland (90.6%) and Denmark (87.0%).
- Growth in 5G, Wi-Fi 6, LPWAN, and edge computing continues to accelerate IoT connectivity worldwide.
- Enterprise logistics, utilities, and manufacturing continue adding millions of connected sensors every year.
- New GSMA eSIM standards are expected to simplify large-scale IoT deployments, with enterprise sectors driving most new activations in 2026.
IoT in Consumer Applications
- The global consumer IoT market is expected to grow from $215.46 billion in 2025 to $249.82 billion in 2026.
- The global smart home market is forecast to surge from $162.8 billion in 2025 to $207.0 billion in 2026.
- Smart home device shipments are expected to increase from 931.1 million units in 2025 toward a one-billion-unit milestone.
- The security and access control segment captured the largest smart home share at 31.0% in 2025.
- Cloud-connected smart home devices accounted for a dominant 62.6% market share in 2025.
- Wireless connectivity leads the consumer IoT sector with a massive 80% market share in 2025.
- Consumer electronics represent the largest IoT application segment with a 36% market share in 2025.
- The global consumer IoT market is projected to reach an impressive $830.24 billion by 2035.
- The home healthcare IoT segment is anticipated to witness a massive 32% CAGR from 2025 to 2033.
- North America dominated the global Internet of Things market with a 32.40% market share in 2025.
Leading IoT Connectivity Technologies by Market Share
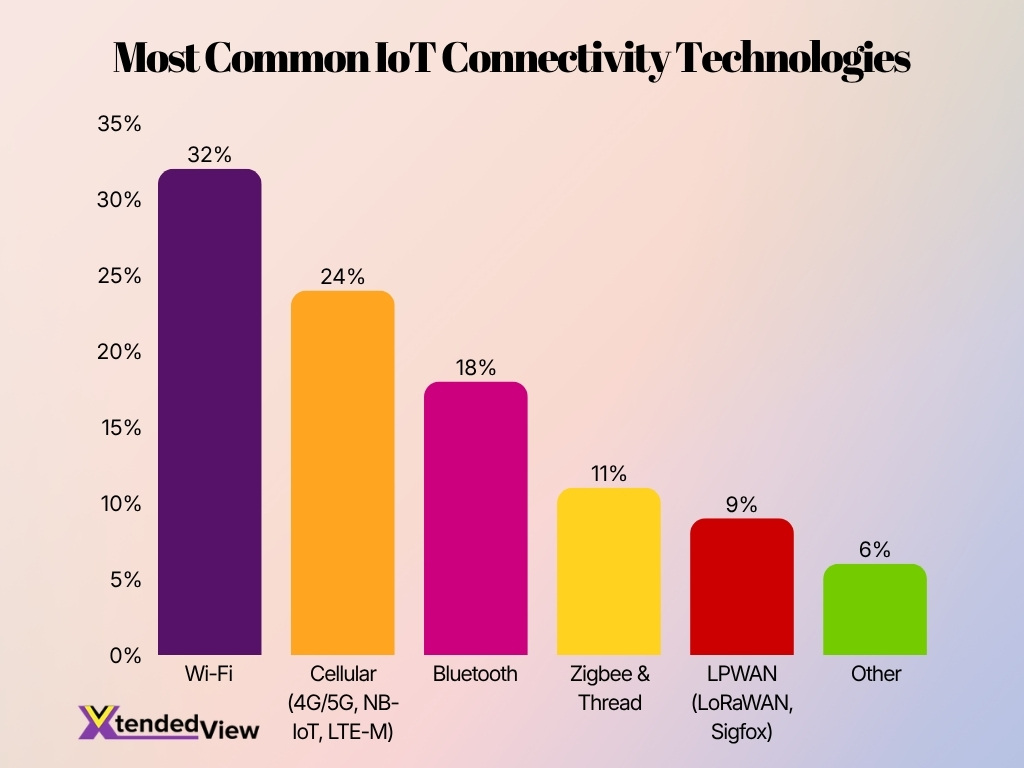
- Wi-Fi leads IoT connectivity with a 32% share, making it the most widely used technology.
- Cellular networks, including 4G, 5G, NB-IoT, and LTE-M, account for 24% of IoT connections.
- Bluetooth represents 18%, supported by its widespread use in short-range consumer and wearable devices.
- Zigbee and Thread hold an 11% share, mainly serving smart home and low-power connected ecosystems.
- LPWAN technologies, including LoRaWAN and Sigfox, contribute 9% of the connectivity market.
- Other connectivity technologies collectively account for the remaining 6% of IoT connections.
IoT in Smart Homes
- 45% of U.S. internet households own at least one smart home device.
- The global smart home market is projected to reach approximately $207 billion in 2026.
- ENERGY STAR-certified smart thermostats reduce heating bills by 8%, saving households $50 annually.
- The average household contains 22 connected devices that face almost 29 cyber attacks daily.
- The security and access control segment accounted for a dominant 31.0% of market revenue in 2025.
- North America dominated the global smart home market with a massive 39.45% market share in 2025.
- More than 90% of individuals in China currently own one or more smart home devices.
- Around 40% of U.S. households utilize AI-powered security features such as person detection.
- The global smart home market is expected to experience a CAGR of 23.1% between 2026 and 2033.
- The hybrid protocols segment captured a leading 41.1% market share in 2025 by combining wired and wireless technologies.
IoT in Smart Cities
- The global IoT smart cities market is projected to hit $329.41 billion in 2026.
- Smart traffic management systems are expected to save cities $277 billion globally.
- Advanced smart street lighting reduces municipal electricity consumption by 50% to 80%.
- The average IoT device density in leading smart cities exceeds 10,000 devices per square mile.
- Smart utility applications dominate the sector with a 27.3% market share globally.
- Connected traffic signal controls can decrease vehicle wait times by over 40%.
- Urban digital twins and AI platforms will represent a $73.5 billion market by 2027.
- Cloud infrastructure deployments captured 66.3% of all smart city operations in 2025.
IoT Market by Industry
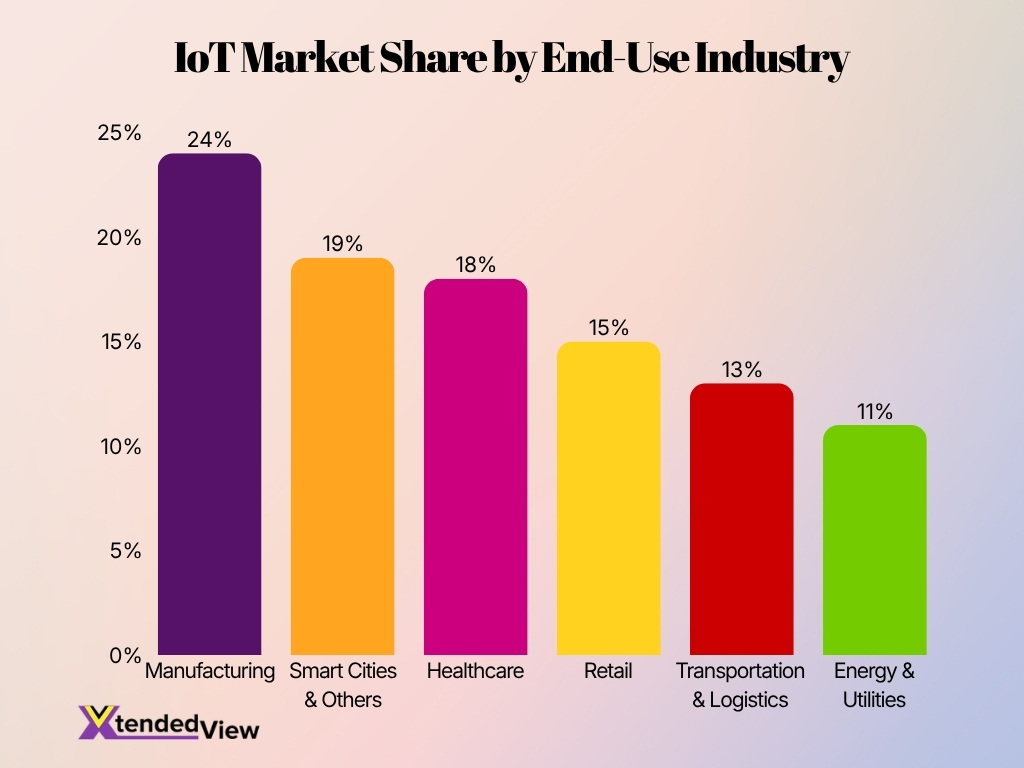
- Manufacturing leads the IoT market with a 24% share, reflecting strong adoption of automation, predictive maintenance, and connected production systems.
- Smart cities and other applications account for 19%, making them the second-largest segment in the end-use market.
- Healthcare holds an 18% market share, driven by remote patient monitoring, connected medical devices and digital health systems.
- Retail represents 15% of the market, supported by smart inventory management, personalized shopping and automated checkout technologies.
- Transportation and logistics contribute 13%, as companies use IoT for fleet tracking, route optimization and real-time shipment monitoring.
- Energy and utilities hold an 11% share, with adoption focused on smart grids, asset monitoring and energy efficiency.
- The top three segments, manufacturing, smart cities and healthcare, together account for 61% of the total IoT market.
IoT in Healthcare
- The global IoT in healthcare market is projected to reach $483.72 billion by 2031.
- Asia Pacific leads the global healthcare IoT sector with a dominant 40.8% market share.
- Approximately 64% of patients actively use at least one IoMT device in their daily lives.
- Remote patient monitoring (RPM) systems are currently utilized by over 50 million people in the U.S.
- Implementing IoT-enabled RPM solutions has been proven to reduce hospital readmission rates by up to 76%.
- Connected healthcare hardware, including wearables, accounts for a massive 46% of the total IoMT market.
- Around 79% of patients are willing to share data generated by their wearable devices with healthcare providers.
- Over 75% of doctors have adopted some form of remote patient monitoring to manage chronic health conditions.
IoT in Automotive
- The global connected car market is projected to grow from $98.6 billion in 2025 to $121.8 billion in 2026.
- More than 95% of new passenger vehicles shipped in North America will include embedded cellular connectivity by 2026.
- Global connected vehicle subscriptions are forecast to exceed 500 million worldwide by the end of 2026.
- Original Equipment Manufacturers (OEMs) dominated the automotive IoT sector with a commanding 63.27% market share in 2025.
- The telematics segment accounted for a dominant 33.20% revenue share in 2025 due to real-time diagnostics demand.
- Over-the-air (OTA) software updates are projected to experience rapid growth at a 26.15% CAGR through 2031.
- Global electric vehicle sales topped 20 million in 2025, driving heavy demand for IoT battery monitoring platforms.
- Vehicle-to-vehicle (V2V) communication technologies are expected to register a strong growth rate of 17.9% globally.
IoT in Retail
- The global IoT retail market is projected to grow from $46.41 billion in 2025 to $55.26 billion in 2026.
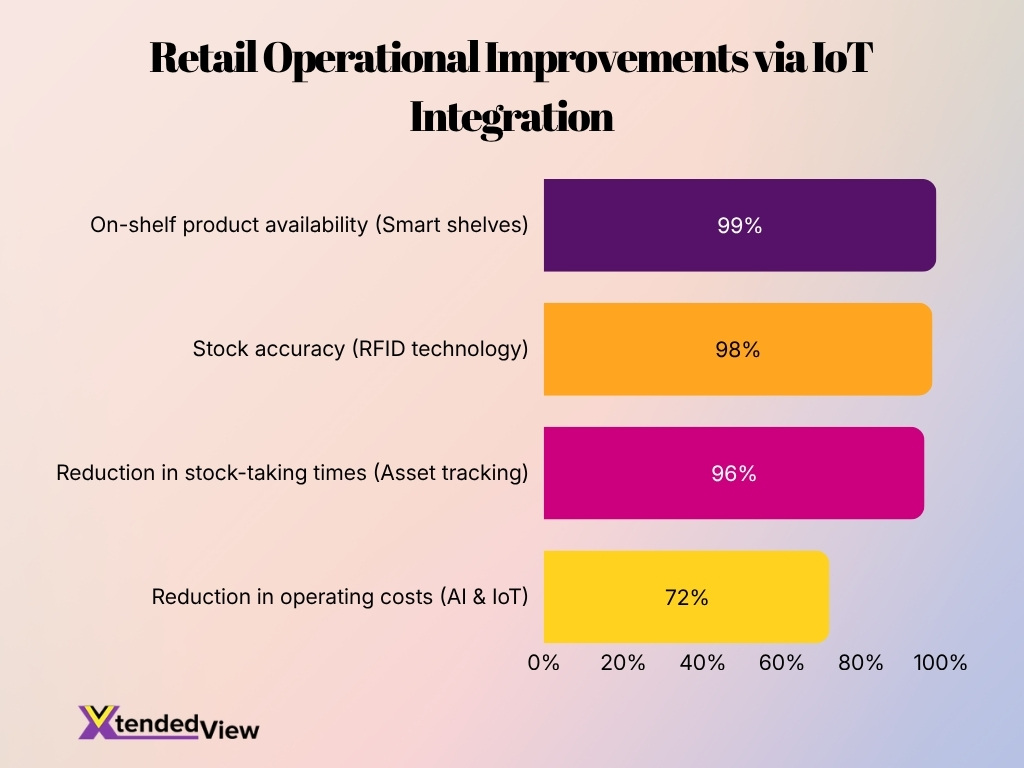
- Deploying IoT-enabled smart shelves allows grocery retailers to improve on-shelf product availability to 99%.
- The adoption of RFID technology across retail inventories can improve overall stock accuracy by up to 98%.
- Implementing IoT-powered asset tracking helps distribution centers reduce manual stock-taking times by 96%.
- The hardware segment of retail IoT solutions is expected to capture a 42.92% global market share in 2026.
- Utilizing AI and IoT data for retail operational management leads to a 72% reduction in operating costs.
- Nearly 49% of customers become repeat buyers when retailers leverage data for personalized shopping experiences.
- Cloud-based IoT deployments for supply chain visibility are anticipated to dominate with a 50% market share in 2025.
IoT Security Statistics
- A staggering 98% of all IoT device traffic is transmitted unencrypted.
- Threat actors launch an average of 820,000 malicious IoT hacking attempts daily.
- The manufacturing and transportation sectors absorb 40% of all IoT malware incidents.
- Global IoT malware attacks recently spiked by 124% year-over-year.
- Nearly 99% of healthcare organizations operate medical devices with known exploited vulnerabilities.
- Standard routers now account for over 50% of devices harboring critical security vulnerabilities.
- The global IoT security market is projected to rapidly expand to $45.11 billion by 2030.
- The number of connected IoT devices is forecast to reach 39 billion active endpoints by 2030.
- The energy sector recently saw a staggering 459% increase in IoT-targeted cyberattacks.
IoT Implementation Challenges
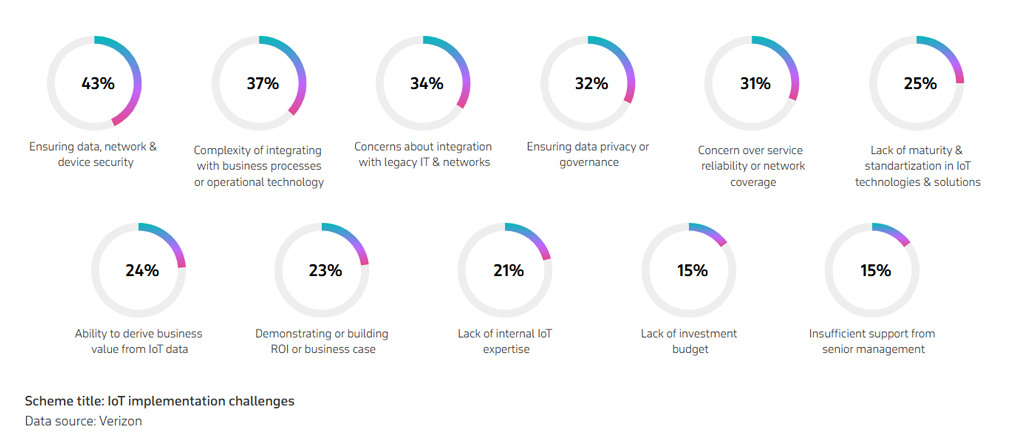
- Data, network, and device security is the biggest IoT implementation challenge, cited by 43% of respondents.
- Integration complexity with business processes or operational technology affects 37% of organizations.
- Legacy IT and network integration remains a major barrier for 34% of respondents.
- Data privacy and governance concerns are reported by 32% of organizations.
- Service reliability and network coverage create difficulties for 31% of IoT adopters.
- Technology maturity and standardization gaps are a concern for 25% of respondents.
- Deriving business value from IoT data remains challenging for 24% of organizations.
- Building a clear ROI or business case is difficult for 23% of respondents.
- Limited internal IoT expertise affects 21% of organizations.
- Investment budget constraints are reported by 15% of respondents.
- Insufficient senior management support is also cited by 15% of organizations.
Future IoT Forecasts
- The global IoT market size is projected to reach $865.20 billion by 2030, growing at a CAGR of 9.6%.
- The global Industrial Internet of Things (IIoT) market is estimated to hit $130.10 billion by 2030 with a 6.50% CAGR.
- The smart cities market is anticipated to expand to $3,757.9 billion by 2030, driven by a massive CAGR of 29.4%.
- The number of connected IoT devices in smart cities is forecast to exceed 50 billion by 2030.
- The Internet of Medical Things (IoMT) market is projected to reach $658.6 billion by 2030, growing at an 18.2% CAGR.
- The Asia-Pacific IoT market is expected to surge to $392.76 billion by 2030 at a CAGR of 12.4%.
- The US IoT market is forecast to reach $220.47 billion by 2030, expanding at a CAGR of 7.7%.
- The wearable and IoMT medical devices sector is projected to reach $26.8 billion by 2030 with a 14.1% CAGR.
Frequently Asked Questions (FAQs)
The global Internet of Things (IoT) market is projected to generate $1.18 trillion in revenue in 2026, representing an 11.6% year-over-year increase.
The global IoT market is forecast to grow at a compound annual growth rate (CAGR) of 8.91% between 2026 and 2031.
Industrial IoT is expected to be the largest segment, generating approximately $321.68 billion in revenue worldwide during 2026.
The United States is projected to lead the global IoT market with approximately $420.03 billion in revenue in 2026.
The worldwide IoT market is projected to expand from $1.18 trillion in 2026 to approximately $1.81 trillion by 2031, reflecting sustained long-term market growth.
Conclusion
The Internet of Things continues to reshape industries by connecting billions of devices that generate real-time insights and automate decision-making. Organizations accelerated IoT investments across manufacturing, healthcare, transportation, retail, and smart cities while integrating AI, edge computing, and 5G to unlock greater operational efficiency. At the same time, stronger cybersecurity practices and improved interoperability have become critical as device deployments continue to expand.
Looking ahead, IoT will remain a foundational technology for digital transformation. As connected devices approach 39 billion by 2030, enterprises and governments will increasingly rely on intelligent IoT ecosystems to improve productivity, sustainability, customer experiences, and data-driven innovation across the global economy.
