


Social media entered the year as a core part of how people discover information, watch video, communicate, shop and interact with brands. Global social media user identities now number in the billions, while established platforms such as YouTube, Facebook, Instagram and TikTok continue to command large audiences across the U.S. and other major markets. At the same time, newer platforms, creator-led content and short-form video are changing where people spend attention and how they search for products and recommendations.
For businesses, this shift has practical consequences. Retailers increasingly use social platforms to move customers from product discovery to checkout, while marketers rely on social campaigns for customer acquisition, brand awareness and measurable revenue. Media companies and creators also compete for viewing time that once belonged mainly to television and traditional websites. These statistics show how social media usage, demographics, engagement, advertising and commerce are evolving.
Editor’s Choice
- Active social media user identities reached 5.79 billion worldwide by April 2026, putting social platforms within reach of roughly seven in 10 people globally.
- Global social media user identities rose 5.4% year over year to April 2026, faster than the 4.1% annual growth reported at the start of 2025.
- Meta’s family of apps averaged 3.60 billion daily active people in June 2026, up 3% from a year earlier.
- Snapchat reached 971 million monthly active users in Q2 2026, up from 932 million in Q2 2025.
- YouTube Shorts averaged more than 200 billion views per day in 2026, highlighting how short-form video now operates at global mass-market scale.
- Among U.S. adults in 2025, Instagram reached 50%, TikTok 37%, WhatsApp 32% and Reddit 26%.
- Among Americans ages 18 to 29, Instagram usage reached 80%, TikTok 63%, Snapchat 58% and Reddit 48%.
Recent Developments
- By April 2026, global social media user identities had increased by 294 million in 12 months, compared with the 206 million annual increase reported at the start of 2025.
- Meta’s daily audience across its major apps reached 3.60 billion people in June 2026, compared with 3.58 billion in December 2025.
- Meta’s Q2 2026 ad impressions increased 14% year over year, while its average price per ad rose 12%, indicating continued advertiser demand despite the enormous scale of its existing audience.
- Snapchat’s monthly active users increased from 932 million in Q2 2025 to 971 million in Q2 2026, a gain of roughly 39 million users.
- Snapchat’s daily active users reached 493 million in Q2 2026, up 5% year over year from 469 million in Q2 2025.
- Pinterest surpassed 600 million monthly active users worldwide by 2026, extending its role beyond inspiration into visual search, shopping and product discovery.
- TikTok reported serving more than 170 million Americans in 2025, while more than 7.5 million U.S. businesses used the platform.
- YouTube Shorts crossed an average of 200 billion daily views in 2025 and maintained that scale into 2026, reinforcing the shift toward vertical, short-form video.
- In August 2026, Meta agreed to a settlement worth up to $18 billion with U.S. states over allegations involving youth social media harms, with provisions that include teen time limits and additional protections.
- Under those planned safeguards, teen accounts would face a default two-hour daily usage limit, alongside school-hour notification restrictions and overnight access controls.
Global Social Media Usage Statistics
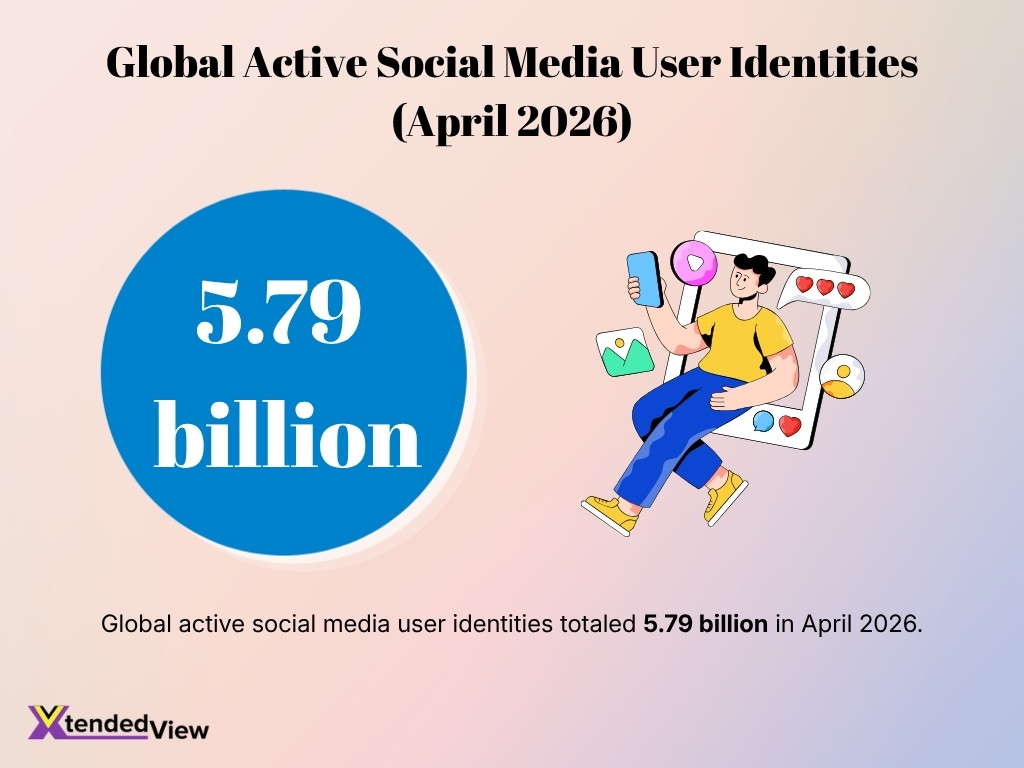
- Global active social media user identities totaled 5.79 billion in April 2026.
- Those identities represented 69.9% of the world’s population, meaning social media had reached almost seven in 10 people globally.
- At the start of 2025, social media identities stood at 5.24 billion, or 63.9% of the global population.
- By October 2025, the global total had already climbed to 5.66 billion, equivalent to 68.7% of the population.
- Between October 2024 and October 2025, social media user identities increased by 259 million, or 4.8%.
- The April 2026 global total represented a further 5.4% annual increase, showing that social media adoption continued to expand even from an already large base.
- Internet adoption also supports further social expansion: 6.12 billion people were online by April 2026, equal to 73.8% of the global population.
- Roughly 2.2 billion people remained offline in early 2026, leaving a large population outside the addressable social media market.
- At the beginning of 2025, internet users totaled 5.56 billion, so the global online population expanded substantially before April 2026.
- More than two-thirds of the world’s population now uses social media each month based on the latest global identity estimates.
Social Media User Demographics
- In the U.S., 95% of adults ages 18 to 29 used YouTube in 2025, compared with 64% of adults ages 65 and older.
- Instagram showed an even wider age gap: 80% of 18- to 29-year-olds used it, versus 19% of adults 65 and older.
- TikTok usage reached 63% among Americans ages 18 to 29, compared with only 12% among adults 65 and older.
- Facebook differed from many newer platforms: its highest U.S. usage rate was 80% among adults ages 30 to 49, compared with 68% among those ages 18 to 29.
- Women were more likely than men to use Instagram in 2025, at 55% versus 44%.
- TikTok also skewed toward women: 42% of U.S. women used the platform, compared with 30% of men.
- Reddit showed the opposite pattern, reaching 29% of men and 23% of women in the U.S.
- Instagram usage reached 62% among Hispanic U.S. adults, compared with 54% of Black adults, 58% of Asian adults and 45% of White adults.
- TikTok reached 57% of Hispanic adults and 53% of Black adults, compared with 28% of White adults in the 2025 U.S. survey.
- Reddit use rose with education: 37% of college graduates used the platform, compared with 28% of adults with some college education and 15% with a high school education or less.
Time Spent on Social Media
- At the start of 2025, the typical internet user spent 2 hours and 21 minutes per day using social media.
- That daily average was 10 minutes lower than two years earlier, indicating that growing user numbers do not necessarily translate into more time per individual.
- Daily social media time had recovered by about two minutes over the preceding three months when the 2025 benchmark was published, after a sustained decline.
- Women ages 16 to 24 spent just under three hours per day on social platforms in the 2025 global dataset.
- Among users ages 16 to 24, women spent approximately 25 minutes more per day on social media than men of the same age.
- U.S. platform frequency data showed that about half of adults used Facebook daily in 2025, with 37% saying they visited it several times each day.
- Roughly half of U.S. adults also used YouTube daily, and 33% reported using it several times a day.
- TikTok had a smaller total U.S. audience but high repeat usage: 24% of U.S. adults used it daily in 2025.
- Around half of U.S. adults ages 18 to 29 used TikTok daily, compared with just 5% of adults ages 65 and older.
- Video also commands substantial viewing beyond mobile feeds: YouTube remained the No. 1 U.S. streaming service by watch time for nearly three years as of January 2026.
Top Social Media Platforms by Monthly Active Users
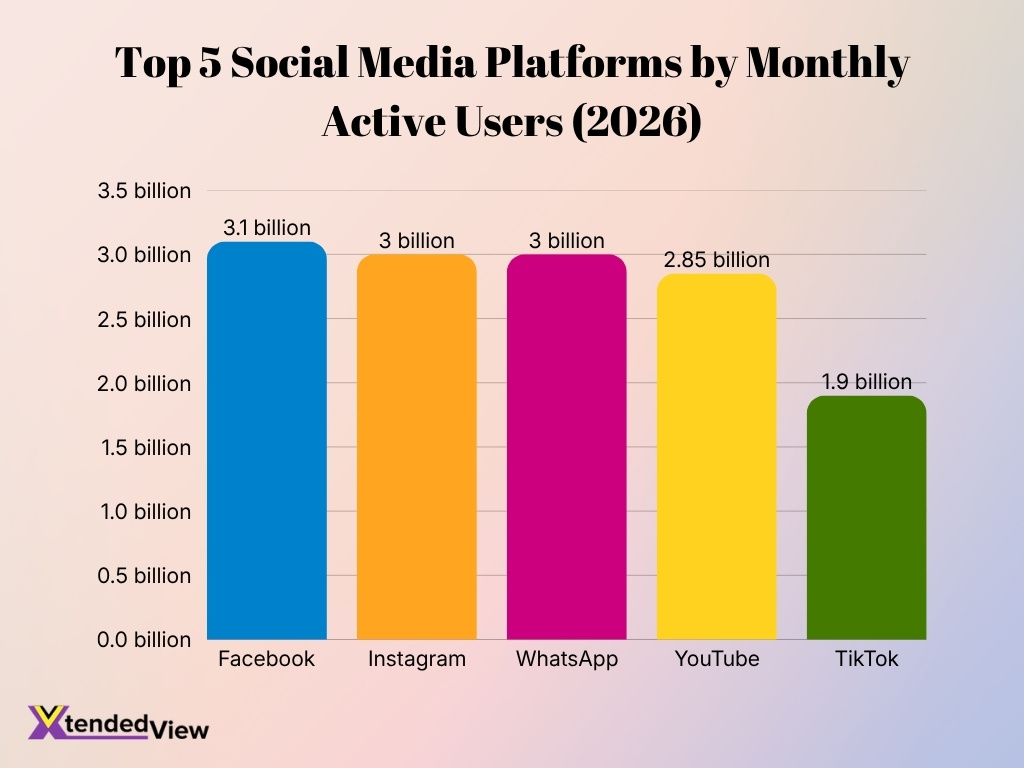
- Facebook leads the global social media landscape with 3.10 billion monthly active users, making it the largest platform among the top five.
- Instagram ranks second with 3.00 billion monthly active users, just 100 million users behind Facebook.
- WhatsApp also reaches 3.00 billion monthly active users, putting it level with Instagram in overall audience size.
- YouTube records 2.85 billion monthly active users, trailing Instagram and WhatsApp by approximately 150 million users.
- TikTok has 1.90 billion monthly active users, giving it a massive global audience despite ranking fifth among the platforms listed.
- The top three platforms, Facebook, Instagram, and WhatsApp, each have at least 3 billion monthly active users, highlighting the enormous scale of Meta-owned services.
- The gap between Facebook and TikTok stands at approximately 1.20 billion monthly active users, showing the substantial difference between first and fifth place.
Social Media Growth Statistics
- Global social media user identities reached 5.79 billion in April 2026, after adding 294 million identities over the previous 12 months. That represented annual growth of 5.4%.
- Social media added more than 800,000 user identities per day during the latest 12-month period, equivalent to roughly 9.3 new identities every second.
- At the start of 2025, the worldwide social media audience stood at 5.24 billion identities, after gaining 206 million, or 4.1%, over the prior year.
- Meta’s family of apps averaged 3.60 billion daily active people in June 2026, up 3% from 3.48 billion in June 2025.
- Snapchat reached 493 million daily active users in Q2 2026, an increase of 23 million, or 5%, from Q2 2025.
- Snapchat’s growth remained concentrated outside its more mature markets: daily active users in its Rest of World segment grew 12% year over year in Q2 2026.
- Pinterest reached an all-time high of 640 million monthly active users in Q2 2026, an 11% year-over-year increase.
- U.S. social media user identities increased by approximately 1 million, or 0.4%, between late 2024 and late 2025, showing slower growth in a mature market.
- Japan added about 2 million social media identities between late 2024 and late 2025, representing growth of 2.1%.
- Nigeria recorded one of the stronger regional gains, adding roughly 12 million social media identities, or 34.7%, between late 2024 and late 2025.
Social Media Usage by Country and Region
- The U.S. had 254 million social media user identities in October 2025, equal to 73% of its population. The country also had 324 million internet users.
- China had approximately 1.28 billion social media user identities in October 2025, representing 90.3% of its population and making it one of the world’s largest social markets.
- India’s Instagram advertising audience alone reached 481 million users in late 2025, equivalent to 43.9% of adults ages 18 and older.
- Indonesia recorded 180 million social media user identities in October 2025, equal to 62.9% of its total population.
- Japan had 99 million social media user identities, equal to 80.5% of its population and 92.6% of its internet user base in October 2025.
- Mexico also recorded 99 million social media user identities in October 2025, but its population penetration stood slightly lower at 74.9%.
- Germany had 64.7 million social media user identities in October 2025, equivalent to 77.1% of its population and 82.5% of its internet audience.
- The U.K. recorded 55.5 million social media user identities in October 2025, representing 79.7% of the country’s population.
- Brazil’s Instagram advertising audience alone reached 147 million users in late 2025, equivalent to 87.3% of adults ages 18 and older.
- Nigeria illustrates the continuing digital divide: it had 47.8 million social media identities in October 2025, equal to 20% of the population and 44% of internet users.
Global Social Media Audience by Age Group
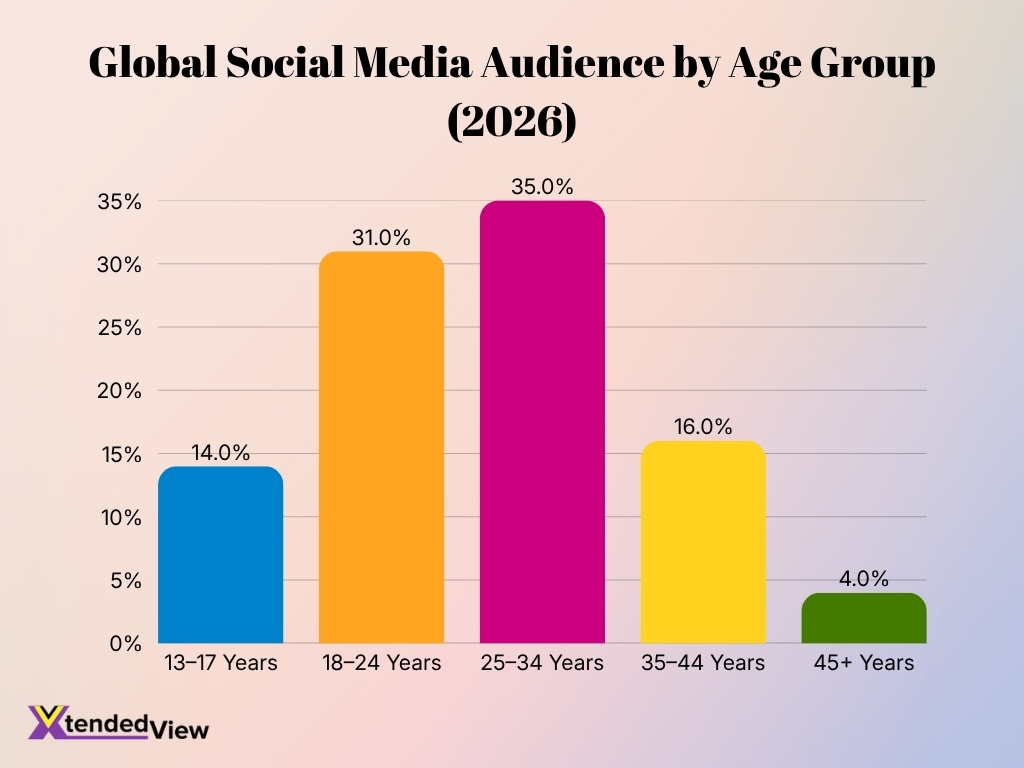
- Adults aged 25–34 years represent the largest social media audience, accounting for 35.0% of total users.
- The 18–24 age group follows closely with a 31.0% share, highlighting the strong presence of younger adults across social platforms.
- Combined, users aged 18–34 years make up 66.0% of the global social media audience, nearly two-thirds of all users.
- People aged 35–44 years account for 16.0% of social media users, showing meaningful engagement among mid-age audiences.
- Teenagers aged 13–17 years represent 14.0% of the total social media audience in 2026.
- Users aged 45 years and older have the smallest share at 4.0%, significantly below younger age groups.
Social Media Usage by Gender
- Facebook showed one of the largest gender differences among U.S. adults in 2025: 78% of women used Facebook, compared with 63% of men.
- Instagram reached 55% of U.S. women and 44% of men, giving the platform an 11-percentage-point gender gap.
- TikTok showed a similar pattern, with 42% of women reporting use compared with 30% of men.
- Snapchat reached 28% of U.S. women in 2025 versus 22% of men, maintaining a modest female skew.
- Reddit leaned in the opposite direction: 29% of U.S. men used it, compared with 23% of women.
- X also had a larger male audience, reaching 25% of U.S. men and 16% of women in 2025.
- YouTube remained comparatively balanced by gender, reaching 86% of men and 83% of women among U.S. adults.
- Among U.S. teens, Snapchat reached 61% of girls compared with 49% of boys in 2025. In contrast, YouTube reached 94% of boys and 89% of girls.
- International differences can run much wider. In India, 69.7% of Instagram’s adult advertising audience was male in late 2025, while 29.9% was female.
- Brazil showed the opposite Instagram pattern: 57.1% of its adult advertising audience was female, compared with 42.8% male in late 2025.
Mobile vs Desktop Social Media Usage
- Mobile remains the primary social media access environment. At the start of 2025, 99.3% of users across Meta platforms accessed them through mobile devices.
- Globally, 96% of online adults reported using some type of mobile phone for at least part of their internet activity in 2025.
- Smartphones accounted for most of that access: 93.7% of connected adults said they used a smartphone for at least some online activity.
- By April 2026, the world had about 7.64 billion smartphones in use, representing roughly 89% of mobile handsets.
- In the U.S., 91% of adults owned a smartphone in 2025, compared with 35% when smartphone ownership was first measured in 2011.
- Smartphone ownership reached 97% among U.S. adults ages 18 to 29 and 96% among ages 30 to 49, compared with 78% among adults 65 and older.
- 16% of U.S. adults were smartphone-dependent in 2025, meaning they owned a smartphone but did not subscribe to home broadband. Among 18- to 29-year-olds, the rate climbed to 27%.
- Mobile devices accounted for 51.48% of worldwide website traffic in Q2 2026, excluding tablets. This web measure does not include activity that remains entirely inside native social apps, so mobile’s full role in social use is larger than browser traffic alone suggests.
- Native apps also dominate smartphone behavior. In the 2025 global benchmark, browsers and search apps accounted for less than 6% of total smartphone time, leaving most mobile activity inside apps and other services.
- Social networking represented the second-largest category of cellular data traffic in the 2025 benchmark, accounting for more than 11.5 exabytes per month, behind video.
Organic Social Media Engagement Rate Statistics
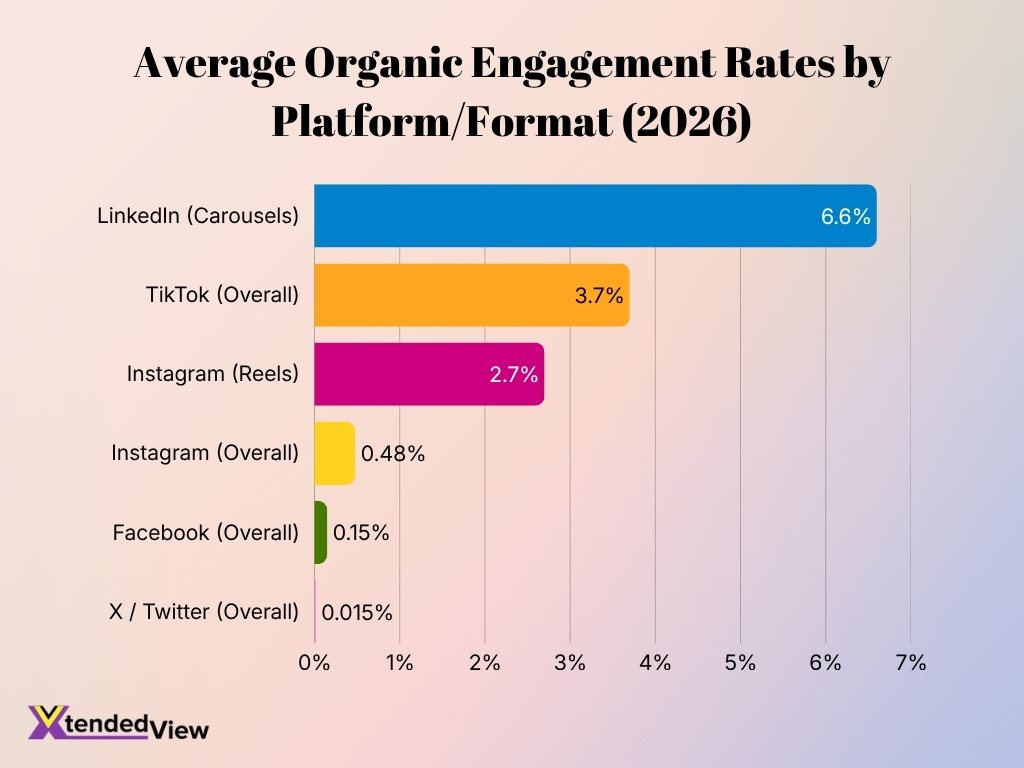
- LinkedIn carousels lead all measured formats with an average organic engagement rate of 6.60%, making them the strongest performer in the comparison.
- TikTok ranks second with an overall engagement rate of 3.70%, highlighting its ability to generate relatively high organic audience interaction.
- Instagram Reels achieve an average engagement rate of 2.70%, substantially outperforming Instagram’s overall platform average.
- Instagram’s overall engagement rate stands at just 0.48%, meaning Reels generate more than 5 times the platform-wide average.
- Facebook records a relatively low organic engagement rate of 0.15%, trailing LinkedIn, TikTok, and Instagram.
- X / Twitter has the lowest average engagement rate at only 0.015%, approximately 10 times lower than Facebook’s 0.15% rate.
- The data shows a significant engagement gap across platforms, ranging from 6.60% for LinkedIn carousels to just 0.015% for X / Twitter.
Social Media Advertising Statistics
- U.S. social media advertising revenue reached $117.7 billion in 2025, up from approximately $88.7 billion in 2024.
- Social media advertising revenue grew 32.6% year over year in 2025, adding about $29 billion in annual revenue.
- Social ad revenue totaled $52.9 billion in the first half of 2025 and increased to $64.9 billion in the second half, showing stronger monetization later in the year.
- Total U.S. digital advertising revenue reached $294.6 billion in 2025, meaning social media represented roughly 40% of the reported digital advertising total.
- Worldwide social media advertising spending is projected to reach $338.75 billion in 2026, with the U.S. expected to account for about $126 billion.
- U.S. creator advertising spending reached an estimated $37 billion in 2025, up 26% year over year from $29.5 billion in 2024.
- Creator advertising spending in the U.S. is projected to rise further to $44 billion in 2026, extending its role alongside traditional paid social campaigns.
- Meta delivered 14% more ad impressions across its family of apps in Q2 2026 than a year earlier, while its average price per ad increased 12%.
- Snapchat generated $1.60 billion in Q2 2026 revenue, up 19% from $1.34 billion in Q2 2025. Advertising remained its primary monetization source.
- Pinterest generated $1.18 billion in Q2 2026 revenue, an 18% year-over-year increase, while its monthly active audience grew 11% to 640 million.
Social Media Marketing Statistics
- In 2026, 70% of brands use Instagram for marketing, narrowly ahead of Facebook at 69.6%. Instagram became the most-used social marketing platform in the latest global marketer survey.
- Organic social media content forms part of the marketing strategy for 40.3% of brands, while 39.4% use paid social media content.
- Paid social ranks among the most impactful marketing channels for 25.9% of brands in 2026. Organic social follows at 23.5%, while social shopping tools reach 22.7%.
- Among marketers tracking traffic, engagement and audience growth, 79.5% identify Instagram as a leading platform for improving these metrics. Facebook follows at 66%, YouTube at 59.9% and TikTok at 56.7%.
- LinkedIn remains an important B2B channel, with 42.1% of surveyed marketers using it in 2026. Its professional targeting and expanding video ecosystem continue to support business-focused campaigns.
- TikTok recorded the strongest growth in marketing adoption going into 2026, with 62% more marketing teams using the platform than in the previous survey period.
- Marketers identify keeping up with new social trends as their biggest challenge in 2026, cited by 32%. Another 30% struggle with changing platform features and algorithms.
- Reaching the intended audience remains difficult for 27% of social marketers, while 24% cite gaining and retaining followers as a major challenge.
- In 2025, 36.5% of marketers planned to increase their social media budgets, while 39.5% planned to keep them unchanged and only 6% expected cuts.
- Creator advertising has become a larger part of social marketing. U.S. creator ad spending reached $37 billion in 2025 and is expected to reach $44 billion in 2026.
Social Media Search and Discovery Statistics
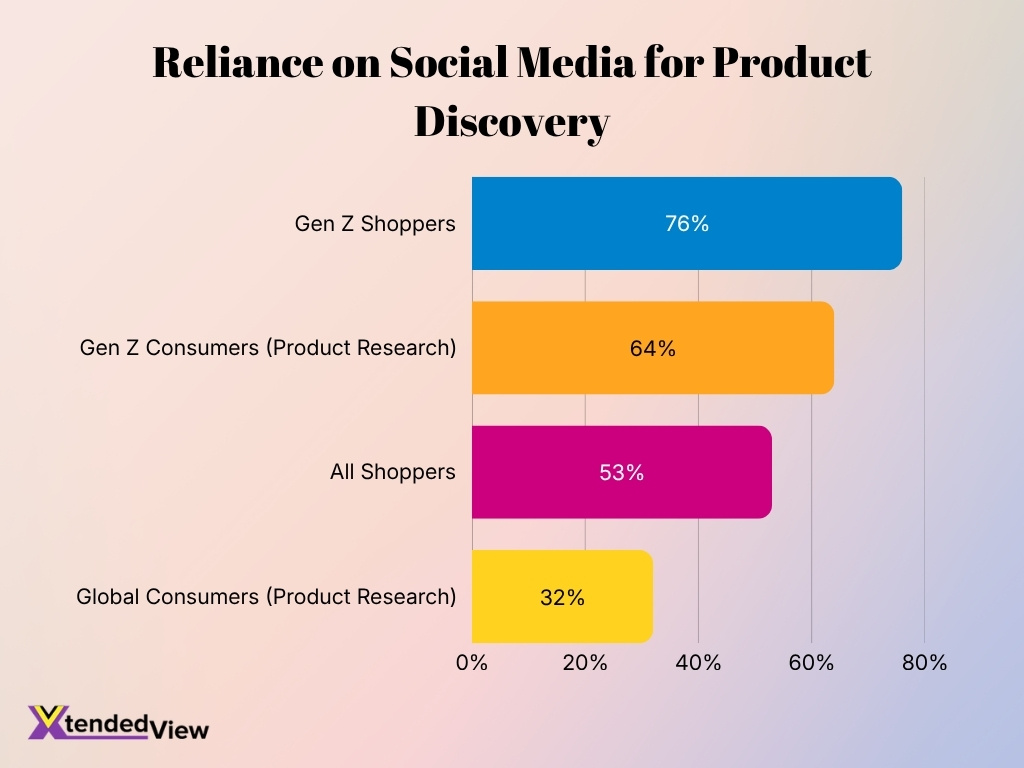
- 53% of shoppers said they discovered products through social platforms in 2025, up from 46% in 2023. The increase shows how social feeds increasingly function as product-search environments.
- Among Gen Z shoppers, 76% use social media for product discovery, substantially exceeding the overall shopper rate.
- Gen Z consumers also show a strong preference for social-first search: 41% turn to social platforms first when they need information, compared with 32% who turn first to traditional search engines.
- Across generations, 37% of consumers prefer social platforms first when searching for product reviews and recommendations.
- Another 35% of consumers use social first when looking for local restaurants, activities and related recommendations, extending social search beyond product shopping.
- In the U.S., 64% of Gen Z consumers use social media to research products, while 35% discover products through influencers or bloggers.
- Global product research through social media reached an average of 32% of consumers in 2025, up from 27% in 2023. In India, roughly half of surveyed consumers researched products through social channels.
- Social media advertising accounts for 29.7% of new brand and product discovery among connected consumers globally, placing it close behind search, TV advertising and word-of-mouth recommendations.
- Consumers encounter brands across multiple touchpoints rather than one channel. The typical adult internet user discovers products and brands through an average of 5.8 different sources.
- An analysis of 1.5 billion commercially oriented searches found that consumers used an average of 3.6 platforms before making a purchase, highlighting the increasingly fragmented path from discovery to conversion.
Social Media Impact on Business and ROI
- 60% of marketing leaders credit social media with contributing to customer acquisition, making acquisition the most frequently cited business outcome in a 2025 global study.
- Another 58% of marketing leaders say social media contributes to customer loyalty, while 56% connect it with revenue generation.
- Reflecting those outcomes, 80% of marketing leaders planned to move money from other marketing channels into social media.
- Paid social investment remains a priority: 87% of marketing leaders planned to increase paid social spending, while more than 80% expected to increase influencer marketing and organic social investment.
- Three-quarters of marketing leaders planned to expand their social media teams, indicating that social investment includes staffing as well as advertising and content budgets.
- Among global marketers surveyed about 2025 performance, 54% ranked Facebook among their highest-ROI social platforms, compared with 43% for Instagram and 33% for YouTube.
- The 2026 marketer benchmark shifts that ranking: 48% place Instagram among their top three platforms for ROI, compared with 42.7% for Facebook.
- Social content has a measurable relationship with purchasing behavior. 76% of surveyed social users said social content influenced a purchase within the previous six months, rising to 90% among Gen Z and 84% among millennials.
- Social commerce affects purchasing even when transactions occur elsewhere. 29% of consumers in the U.S., U.K. and Germany reported buying a brand they originally learned about through social media.
- Measurement remains an obstacle. Although 85% of marketers say they feel confident measuring ROI, only 32% actually measure ROI holistically across both traditional and digital channels.
Emerging Social Media Platforms Statistics
- Threads reached 500 million monthly active users in June 2026, less than three years after its July 2023 launch.
- Threads also recorded particularly rapid engagement growth in Asia. By mid-2026, time spent on the service had increased more than 130% year over year in Japan and about 80% in South Korea.
- Third-party mobile measurements placed Threads at roughly 147 million daily active users in July 2026, an increase of 21.3% from a year earlier.
- Threads web traffic was also expanding quickly, with monthly website visits increasing 112% year over year to about 471.6 million in July 2026.
- Bluesky expanded from 25.94 million registered users to 41.41 million during 2025, representing growth of nearly 60%.
- By mid-2026, Bluesky reported nearly 46 million registered accounts, although its mobile active-user numbers remained considerably smaller than its registration total.
- Bluesky’s mobile app recorded approximately 10.4 million monthly active users worldwide in June 2026, down 27.2% from the previous year as its post-2024 surge cooled.
- Bluesky mobile daily active users stood near 3 million in July 2026, down 25.6% year over year. However, its daily-to-monthly user ratio remained around 29%, indicating a smaller but comparatively active core audience.
- Pinterest continues to evolve from an established visual network into a discovery and commerce platform. It reached a record 640 million monthly active users in Q2 2026, up 11% year over year.
- Gen Z now accounts for 42% of Pinterest’s worldwide user base, making it the platform’s fastest-growing generational audience and an important indicator of changing visual-search behavior.
Key Reasons People Use Social Media
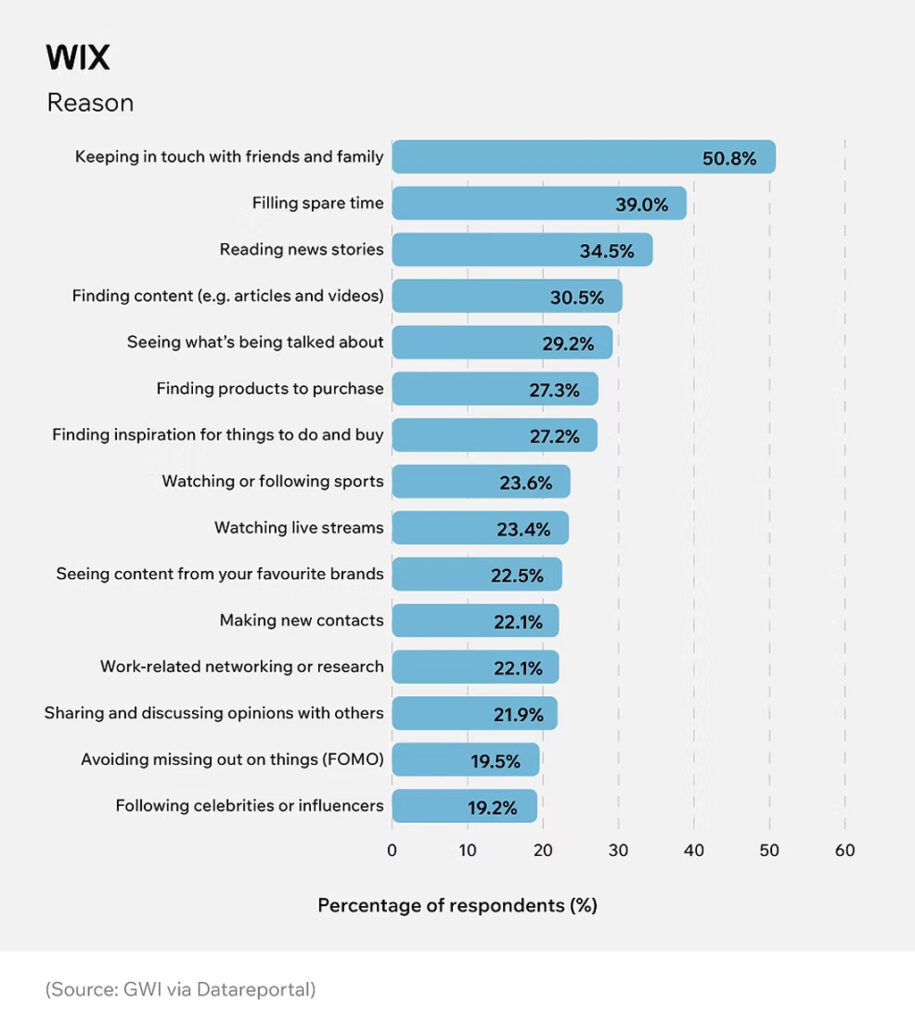
- Keeping in touch with friends and family is the leading reason for using social media, cited by 50.8% of respondents.
- Filling spare time ranks second, with 39.0% of respondents using social platforms for entertainment during free time.
- Reading news stories is a major use case, accounting for 34.5% of respondents.
- Around 30.5% use social media to find content such as articles and videos, highlighting its role in content discovery.
- 29.2% of respondents use social platforms to see what’s being talked about, making them important for following trends and conversations.
- Shopping-related activity is significant, with 27.3% using social media to find products to purchase and 27.2% seeking inspiration for things to do and buy.
- Sports and streaming also attract sizable audiences, with 23.6% using social media to watch or follow sports and 23.4% to watch live streams.
- Brand content attracts 22.5% of respondents, indicating that more than one in five users actively follow content from their favorite brands.
- Social media supports professional and personal connections, with 22.1% using it for making new contacts and another 22.1% for work-related networking or research.
- 21.9% use social platforms for sharing and discussing opinions, while 19.5% use them to avoid FOMO (fear of missing out).
- Following celebrities or influencers ranks lowest among the listed motivations but still accounts for 19.2% of respondents.
Social Media Trends and Future Projections
- U.S. creator advertising spending is expected to reach $44 billion in 2026, up from $37 billion in 2025. The 2025 total had already risen 26% year over year.
- Nearly 48% of creator ad buyers now classify creators as a “must buy,” placing creator partnerships just behind paid search and social media among essential advertising channels.
- AI will play a larger role in creator operations: three in four brands either use or plan to use AI for creator-marketing tasks such as identification, campaign management and content workflows.
- Short-form video remains a defining 2026 format. YouTube Shorts alone averages 200 billion daily views, demonstrating the scale available to creators and advertisers through vertical video.
- Marketers plan to concentrate incremental social investment around video-friendly platforms. 19% plan to prioritize additional investment in TikTok, 19% in Instagram, 18% in Facebook and 18% in YouTube during 2026.
- Instagram ranks as the top 2026 social priority for 48% of marketers in one industry survey. LinkedIn follows at 37%, Facebook at 35% and TikTok at 32%.
- Community-led platforms also continue attracting marketer attention. One in five marketers in that same survey said they intended to increase their focus on Reddit.
- U.S. social commerce continues moving toward creator-led shopping. More than 51% of U.S. social buyers are forecast to shop on TikTok in 2026, showing how video, creators and native commerce increasingly overlap.
- Broader e-commerce conditions provide room for social commerce to expand. U.S. retail e-commerce sales reached $340.2 billion in Q2 2026, up 12.2% from Q2 2025 and accounting for 17.1% of total retail sales.
- Measurement will become more important as spending fragments. 38% of marketers now identify sales or ROI as their primary success metric, while 60% combine reach or frequency measures with ROI when assessing cross-media performance.
Frequently Asked Questions (FAQs)
There were 5.79 billion active social media user identities worldwide as of April 2026, equivalent to 69.9% of the global population.
Global social media user identities grew 5.4% year over year, adding approximately 294 million identities in the 12 months to April 2026.
YouTube reached 84% of U.S. adults, followed by Facebook at 71%, Instagram at 50%, TikTok at 37% and WhatsApp at 32%.
U.S. social media advertising revenue reached $117.7 billion in 2025, up 32.6% year over year from $88.7 billion in 2024.
U.S. creator ad spending is expected to reach $44 billion in 2026, up from $37 billion in 2025 and $29.5 billion in 2024.
Conclusion
Social media sits at the intersection of discovery, entertainment, commerce, communication and customer acquisition. More than half of shoppers now discover products through social platforms, while 41% of Gen Z users turn to social media first for information. This behavior shows that social networks now compete directly with search engines, marketplaces and media platforms for consumer attention.
For marketers, the opportunity continues to expand, but so does the need for stronger measurement. Instagram and Facebook remain major marketing channels, while TikTok, Threads, creators and social commerce continue to reshape where brands invest. U.S. creator advertising spending is projected to reach $44 billion in 2026, and 60% of marketing leaders connect social media with customer acquisition.
The broader trend is clear: businesses can no longer judge social performance only by followers, likes or impressions. Stronger strategies connect social activity with product discovery, customer loyalty, sales, brand visibility and ROI. As audiences continue to fragment across platforms and formats, brands that understand where their customers spend time and how social activity contributes to business outcomes will be better positioned to allocate budgets effectively.
