



Twitter, now branded as X, remains a major real-time social platform, even as its audience, ownership structure, and competitive position continue to change. Businesses use X for customer support and rapid-response marketing, while journalists, government agencies, investors, and public figures use it to distribute breaking information and track live conversations. Current figures require careful interpretation because X is privately held and no longer publishes the standardized quarterly user disclosures Twitter once provided.
Editor’s Choice
- X reported an advertising audience of 586 million users worldwide in January 2025. Importantly, advertising reach does not equal monthly active users, so this figure should not be treated as a direct MAU count.
- In April 2025, then-CEO Linda Yaccarino said X had more than 600 million monthly active users. The figure was company-reported rather than independently audited.
- Independent mobile data showed X at roughly 132 million daily iOS and Android users worldwide in June 2025, down 15.2% year over year. At the same point, Threads reached 115.1 million daily mobile users.
- The United States remained X’s biggest individual advertising market, with 99 million reachable users in late 2025. That represented 28.5% of the total U.S. population and 30.6% of U.S. internet users.
- Japan remained X’s second major market, with 71.2 million users in its advertising audience in late 2025. X ads could reach 66.6% of Japan’s internet users, highlighting the platform’s unusually strong position in the country.
- X’s potential U.S. advertising reach fell by 3.79 million users, or 3.7%, between the end of 2024 and late 2025. The change provides a useful directional signal, although adjustments to advertising tools can affect reported reach.
- X’s global audience still skews male. Early-2025 advertising data placed men ages 25 to 34 at 24.5% of the global ad audience, making them the single largest age-and-gender segment.
- The platform’s ownership changed twice in roughly a year. xAI acquired X in 2025 at an implied equity value of $33 billion, and SpaceX then acquired xAI in February 2026 as part of a transaction that created a combined company valued at about $1.25 trillion.
Recent Developments
- In March 2025, xAI acquired X in an all-stock transaction. The deal valued xAI at $80 billion and X at $33 billion in equity value, or $45 billion before accounting for $12 billion of debt.
- The corporate structure changed again in February 2026 when SpaceX acquired xAI. The transaction created a combined business valued at roughly $1.25 trillion, bringing X indirectly into a much larger group spanning social media, AI, satellite communications and space technology.
- SpaceX’s June 2026 prospectus confirmed that it acquired xAI in February 2026 as the foundation of its new AI segment. The filing also described integration, scaling and execution risks associated with combining the businesses.
- The European Commission opened a new formal investigation in January 2026 into risks connected with Grok features deployed on X. Under the Digital Services Act, a confirmed breach can expose a provider to fines of up to 6% of worldwide annual turnover.
- Leadership also changed during the transition. Linda Yaccarino stepped down as X CEO in July 2025 after about two years in the position and only months after xAI acquired the social network.
- X experienced a major service disruption on March 10, 2025. At one point, about 40,000 U.S. outage reports appeared, while Musk attributed the disruption to a cyberattack; cybersecurity specialists questioned whether the available evidence supported his characterization.
- Another U.S. outage later that month generated more than 53,000 incident reports by 2:46 p.m. ET on March 28. The service recovered shortly afterward.
- Meanwhile, competition intensified. Threads passed 400 million monthly active users by August 2025, while X’s former CEO had previously put X above 600 million MAUs. The gap in mobile daily use had become much narrower than the MAU claims suggested.
How Many People Use Twitter (X) in 2026?
- The clearest recent company claim puts X at more than 600 million monthly active users worldwide. Yaccarino disclosed that figure publicly in April 2025, but X has not returned to the standardized public MAU reporting used before Twitter became private.
- X’s advertising tools reported 586 million reachable users globally in January 2025. This remains one of the strongest independently compiled measures based directly on the platform’s own advertising resources.
- The 586 million advertising audience represented roughly 7% of the world’s population at the time. However, advertising reach may include accounts that do not behave like conventional monthly active users.
- Mobile-only figures paint a smaller picture. X averaged about 132 million daily mobile app users worldwide in June 2025 across iOS and Android.
- X’s web presence remains significant as well. The platform averaged approximately 145.8 million daily web visits worldwide in June 2025, compared with 6.9 million for Threads. Visits should not be added to app users because the same person can appear in both datasets.
- The United States alone accounted for 99 million potential X ad users in late 2025. That equals almost one-third of the country’s internet population, although it does not mean 99 million Americans use X every month.
- Japan added another 71.2 million potential ad users in late 2025, giving X one of its highest national penetration rates among large economies.
- India illustrates why global totals need context. X’s late-2025 advertising audience in India stood at 22.2 million, equal to just 2.2% of the country’s internet population despite India’s enormous online market.
- Therefore, a defensible 2026 assessment is that X operates at a scale of hundreds of millions of users, while its precise MAU total remains uncertain. The company’s 600 million-plus claim, its 586 million early-2025 advertising audience, and lower independent daily-use figures measure different behaviors and should not be presented as interchangeable statistics.
X (Twitter) Monthly Active User Trends
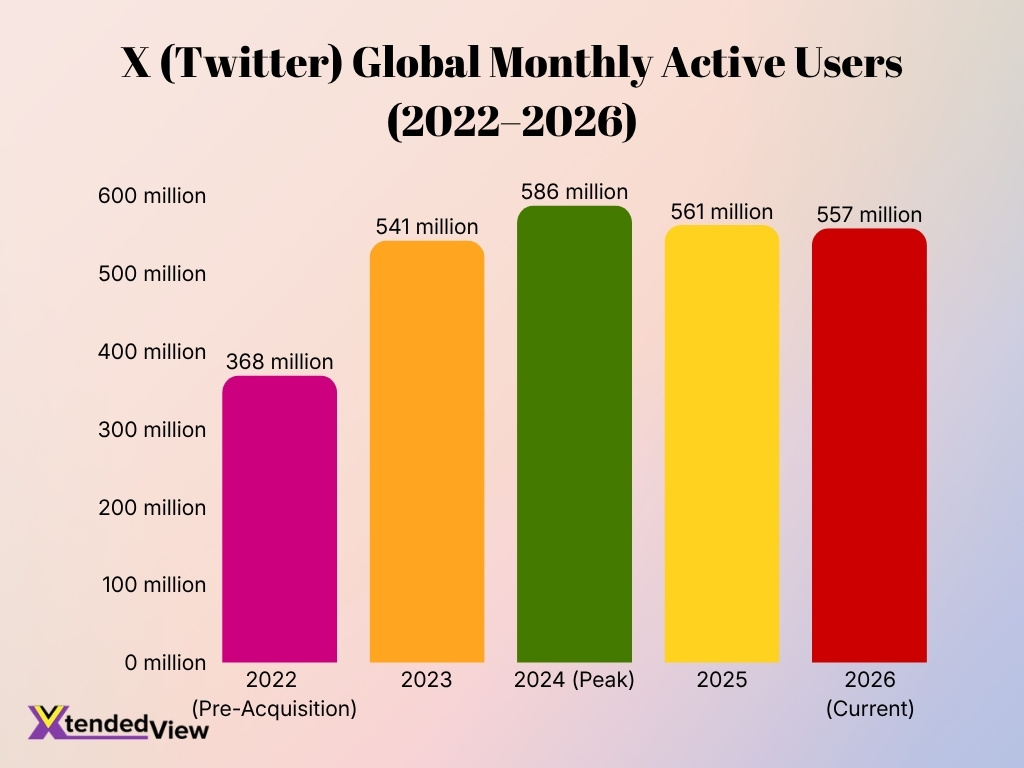
- X’s global monthly active users increased from 368 million in 2022 to 557 million in 2026, representing growth of about 51.4% over the period.
- The platform recorded its strongest annual increase in 2023, when monthly active users jumped to 541 million, up by 173 million from 2022.
- X reached its highest estimated audience in 2024, with approximately 586 million monthly active users worldwide.
- Monthly active users declined to 561 million in 2025, a decrease of 25 million, or about 4.3%, from the 2024 peak.
- In 2026, X has an estimated 557 million monthly active users, down slightly by 4 million from 2025.
- Despite the recent slowdown, X’s 2026 user base remains substantially larger than its 2022 pre-acquisition level, indicating significant net audience growth across the five-year period.
Twitter User Growth and Decline Trends
- X’s global advertising audience stood at 586 million in January 2025, providing a useful baseline for measuring the platform’s post-rebrand scale.
- Company-reported MAUs subsequently moved above 600 million by April 2025. Because the two figures use different methodologies, the increase should not be interpreted as a precise 14 million-user gain.
- Independent mobile measurements pointed in the opposite direction. X’s worldwide daily mobile audience reached about 132 million in June 2025, down 15.2% year over year.
- Another independent estimate put X at 217 million daily users across its measured audience in mid-2025, about 10% lower than a year earlier. Differences between independent estimates reflect their distinct coverage and methodologies.
- In the United States, X’s potential advertising reach decreased by 3.79 million users between the end of 2024 and late 2025, equivalent to a 3.7% decline.
- The UK recorded a steeper change. Potential X advertising reach dropped by 5.05 million, or 21%, between the end of 2024 and late 2025.
- India also contracted, with potential ad reach declining by 3.10 million, or 12.3%, between the end of 2024 and late 2025. From July to October 2025 alone, reported reach fell another 9.6%.
- Brazil showed another large annual decline: potential X ad reach fell by 4.04 million, or 19.1%, between the end of 2024 and late 2025.
- These declines need qualification. X’s advertising planning figures can change because of account removals, revised measurement methods and corrections for duplicate or inauthentic activity. Consequently, a fall in ad reach does not necessarily translate one-for-one into lost human users.
- Competitive pressure is increasing at the same time. Threads’ daily mobile audience grew to 115.1 million in June 2025, up 127.8% year over year, compared with X’s 132 million. This narrowed X’s mobile lead to roughly 17 million daily users in that dataset.
Daily Active Users vs Monthly Active Users
- Independent app tracking placed X at about 302 million monthly active mobile users worldwide in June 2026. This figure covers mobile app activity rather than X’s entire web-and-app audience.
- X recorded approximately 123.7 million mobile daily active users worldwide in July 2026. Daily mobile usage fell 7% from a year earlier, showing that monthly reach and everyday engagement can move at different rates.
- X’s worldwide monthly mobile audience declined by roughly 3% year over year in June 2026. The smaller MAU decline compared with the DAU decline suggests that some users still visit during a month but return less frequently.
- By contrast, X’s website generated about 4.7 billion visits in July 2026, up 5.3% year over year. Web traffic therefore remains an important part of X’s overall audience that mobile-app DAU figures do not capture.
- U.S. unique visitors changed little over nine months, rising from 132.5 million in June 2025 to 132.8 million in March 2026. That represents growth of only about 0.2%, which points to a largely stable U.S. reach footprint.
- During the second quarter of 2025, 48% of X’s global monthly app users used the service daily. In practical terms, almost one in two monthly mobile users returned on an average day.
- Earlier in January 2025, estimated U.S. and global daily active users were each down by roughly 13% year over year. This decline preceded the more moderate annual MAU decrease recorded during 2026.
- Competition has changed the daily-use picture faster than the monthly-use picture. Threads reached about 147 million mobile DAUs in July 2026, 21.3% higher year over year and above X’s 123.7 million in the same independent dataset.
Twitter Users by Country and Region
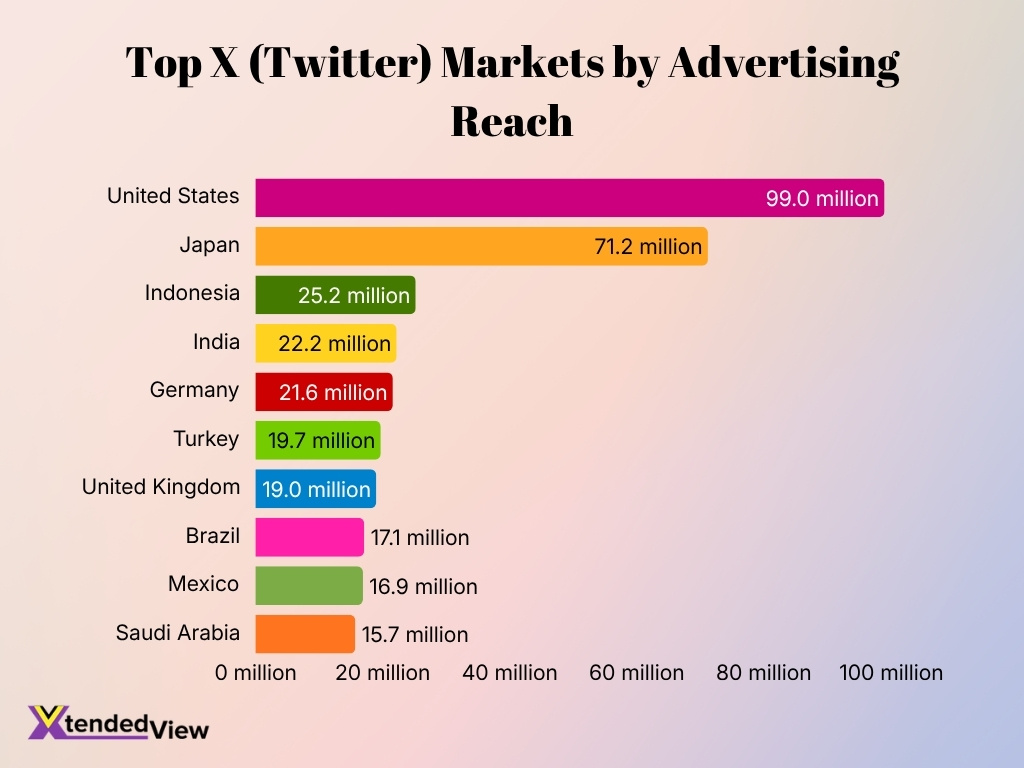
- The United States ranked first among X’s major national markets, with 99 million users reachable through advertising tools in late 2025. X ads could reach 34.3% of U.S. adults and 30.6% of the country’s internet users.
- Japan reached 71.2 million users in late 2025, making it one of X’s most important markets both in absolute size and penetration. Advertising reach equaled 63.9% of Japanese adults and 66.6% of internet users.
- India had 22.2 million potential X ad users in late 2025. Despite ranking among X’s larger markets by absolute audience, the platform reached only 2.0% of Indian adults and 2.2% of internet users.
- The United Kingdom had 19 million potential X ad users in late 2025. That represented 33.1% of adults and 27.8% of the country’s internet population.
- Brazil had 17.1 million X users in its late-2025 advertising audience, equal to 10% of Brazilian adults and 9.3% of local internet users.
- Earlier January 2025 data placed Indonesia at 25.2 million users, making it X’s third-largest advertising market at that point, ahead of India, the UK and Germany.
- January 2025 figures placed Germany at 21.6 million, Turkey at 19.7 million, Mexico at 16.9 million and Saudi Arabia at 15.7 million potential users. These markets illustrate X’s reach beyond its two dominant markets, the U.S. and Japan.
- At the regional level, North America accounted for 115 million users, or 19.6% of X’s global advertising audience, in January 2025.
- Eastern Asia contributed 102 million users, or 17.4% of the global advertising audience, while Southeast Asia accounted for another 73.5 million, or 12.5%. Together, the two regions represented nearly 30% of X’s reported worldwide ad audience.
- Western Asia represented 50 million users, while Western Europe accounted for 52.2 million in January 2025. Southern America contributed another 39.1 million, showing that X’s audience remains geographically diversified despite substantial country-level differences in penetration.
Average Time Spent on Twitter Per Day
- Active U.S. X users spent approximately 34 minutes per day on the platform in 2026, according to the latest media-consumption forecast. That level has remained surprisingly stable despite shifts in ownership, advertising demand and competition.
- The same 2026 analysis indicates that the 34-minute daily average has held roughly steady since 2022. Stable time spent suggests that remaining U.S. users continue to use X intensively even as other audience measurements fluctuate.
- In the second quarter of 2025, users spent an estimated 31 minutes per day on X. Therefore, current U.S. estimates sit several minutes above that earlier worldwide app benchmark, although the populations and measurement methods differ.
- A separate 2025 estimate put average daily usage among U.S. adults who use X at 34.1 minutes. This closely aligns with the latest 2026 U.S. estimate and supports the view that usage time has remained relatively stable.
- Worldwide Android users spent about 29 minutes per day in the X app in May 2025. Mobile-only global averages typically differ from U.S. all-device estimates, so marketers should not treat the two figures as interchangeable.
- In December 2025, an average visit to X lasted about 16 minutes and 5 seconds in one web-traffic dataset. Average visit duration measures a session rather than total daily time, which explains why it sits below the daily-use figure.
- Active Android users worldwide opened X an average of 120.4 times per month in the available country-level app dataset. That equates to roughly four app sessions per day in a 30-day month.
- Usage frequency varies widely by country. Android users in Japan averaged 211.1 monthly X app sessions, versus 92.5 in the United States, indicating that daily time alone does not capture differences in how often users return.
Twitter User Demographics
- X’s global advertising audience has a clear male skew. In early 2025, men accounted for roughly 62.6% of the age-and-gender audience segments reported in the global dataset, while women accounted for about 36.6%; rounding and source inconsistencies prevent the values from summing cleanly to 100%.
- Men ages 25 to 34 represented 24.5% of X’s global advertising audience, the largest individual demographic segment in the early-2025 dataset.
- Men ages 18 to 24 made up another 18.9% of the global advertising audience, meaning younger adult men alone accounted for a substantial share of X’s addressable market.
- Women ages 18 to 24 represented 13.2% of the global advertising audience, narrowly exceeding the 13.0% share recorded for women ages 25 to 34.
- Users ages 25 to 34 accounted for about 37.5% of the audience when male and female segments were combined. That made the 25-to-34 group X’s largest adult age bracket.
- Users ages 18 to 24 represented approximately 32.1% of X’s global advertising audience. Combined with ages 25 to 34, people ages 18 to 34 represented nearly 70% of the age-and-gender audience measured in the dataset.
- Adults ages 35 to 49 accounted for roughly 21.1% of the audience, including 14.2% male and 6.9% female users.
- Users age 50 and older represented about 6.5% of the global advertising audience in the early-2025 demographic breakdown, while ages 13 to 17 represented roughly 2%.
- U.S. mobile behavior provides a useful independent check on the global profile. Android audience analysis for Q2 2025 placed women at roughly one-third of U.S. X mobile users, while about 60% of users were younger than 35.
- Gender patterns vary sharply by country. In India, X’s own late-2025 advertising data classified 87.4% of its adult ad audience as male and 12.6% as female. However, X infers gender from profile and behavioral signals, so these figures require more caution than self-declared demographic data.
Tweet Volume and Posting Frequency Statistics
- The median X account in a major 2025 brand benchmark posted about 2.2 times per week, or roughly nine times per month. In 2021, the comparable figure was approximately five posts per week.
- Overall Twitter/X posting frequency fell 33% year over year in the 2025 industry study, the steepest posting-frequency decline among the social platforms analyzed.
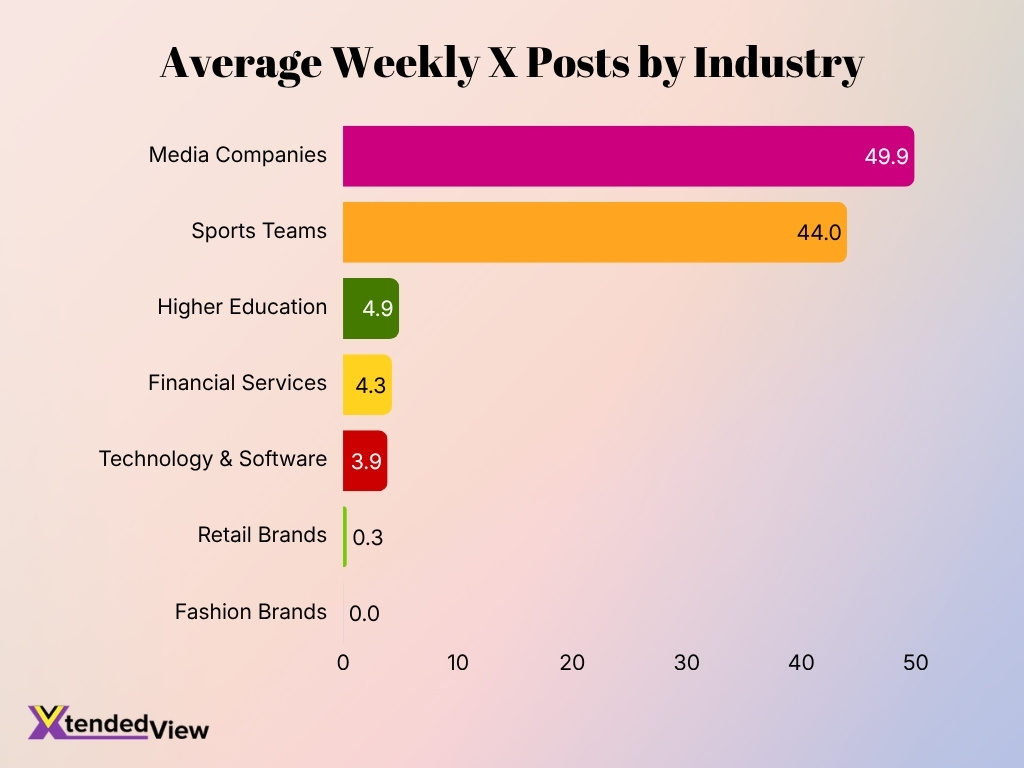
- Media companies remained extreme outliers, publishing an average of about 49.9 X posts per week in the 2024 activity period reported in 2025. That equals slightly more than seven posts per day.
- Sports teams also posted at high volume, averaging roughly 44 posts per week in the latest industry benchmark. Their cadence reflects the live nature of games, scores, player news and fan conversations.
- Higher education accounts averaged approximately 4.9 X posts per week, offering a middle ground between high-volume media accounts and industries that rarely use the platform.
- Financial services brands averaged about 4.27 posts per week, while technology and software companies averaged 3.89. Both sectors continue to maintain regular X publishing schedules despite broader declines in brand activity.
- Retail brands averaged only 0.33 posts per week, equivalent to roughly one or two posts per month. This places retail far below industries tied to news, sports and real-time information.
- Fashion brands posted only around 0.02 times per week in the measured period. At that rate, the average account published approximately one X post per year, showing how sharply some visual-first industries have reduced activity.
- The latest Q2 2026 industry benchmark now tracks 755 company accounts on X, with all measured accounts holding at least 1,000 followers. This expanded current dataset confirms that posting frequency continues to vary significantly by account size and sector.
Twitter Advertising Statistics and Ad Spend
- X’s worldwide advertising revenue was forecast to reach $2.26 billion in 2025, an increase of 16.5% from the previous year. It marked the first projected annual increase since the 2022 acquisition.
- U.S. X advertising revenue was projected at $1.31 billion in 2025, up 17.5% year over year. Based on those projections, the U.S. would account for about 58% of worldwide X ad revenue.
- Even after the 2025 recovery, X remained well below Twitter’s pre-acquisition advertising scale. Twitter generated $4.51 billion in ad revenue in 2021, nearly twice the projected global 2025 level.
- Independent advertising-intelligence data found that U.S. advertiser spending on X increased 62% year over year during the first half of 2025. This growth was substantially stronger than the full-year revenue growth forecast.
- That rebound followed a severe contraction: approximately 89% of U.S. advertising dollars disappeared between the third quarter of 2022 and the third quarter of 2024 in the same tracking dataset.
- Advertiser participation improved during 2025, with company leadership claiming that 96% of advertisers had returned by May. That number measures advertiser return, not whether spending returned to previous levels.
- Advertiser sentiment remains more cautious than revenue growth suggests. In a 2025 global survey, a net 29% of marketers planned to reduce X spending in 2026, while nearly one in eight planned to stop investing entirely.
- Marketer favorability toward advertising on X fell from a net +15% in 2022 to -31% in 2025. This indicates that improving ad revenue and advertiser sentiment can move in different directions at the same time.
- For context, social advertising represented 12.2% of digital marketing budgets among surveyed marketing leaders in 2025. Paid media overall accounted for 30.6% of total marketing budgets, leaving social platforms competing intensely for allocation.
Twitter Engagement Statistics and Benchmarks
- A 2026 analysis of more than 52 million social posts found that X’s median engagement rate increased from about 2.0% in 2024 to 2.8% in 2025, a 44% year-over-year gain under that study’s engagement methodology.
- However, follower-based brand benchmarking produced a much lower 0.029% median engagement rate for X. The large gap shows why marketers must check whether a benchmark divides interactions by impressions, reach, or followers before comparing results.
- In a separate 2025 brand dataset, the average engagement rate across X accounts was 0.16%. Enterprise accounts averaged 27 daily engagements, compared with 24 for midmarket companies and 13 for small businesses.
- X experienced the largest engagement-rate decline among four major platforms in one 2025 industry analysis, with engagement dropping 48% year over year. Facebook fell 36%, TikTok 34%, and Instagram 16% in the same study.
- Very large X accounts show particularly low follower-based engagement. For accounts with 1 million to 5 million followers, the median was 0.027% during the 30 days ending Aug. 20, 2026.
- Accounts with 5 million to 20 million followers recorded a 0.019% median engagement rate in that same August 2026 dataset, indicating a clear decline in engagement percentage as account size grows.
- For accounts with 20 million to 50 million followers, median engagement fell further to 0.011%. The lower quartile stood at 0.005%, while the upper quartile reached 0.031%.
- Industry differences remain substantial. Sports teams recorded follower-based engagement near 0.07%, while several categories, including fashion and health and beauty, rounded to nearly zero in the 2025 brand benchmark.
- Weekly follower growth also remains modest for established brand accounts. A Q4 2024 benchmark published during 2025 placed overall X follower growth at approximately 0.11% per week.
Twitter Video, Image, and Content Format Performance
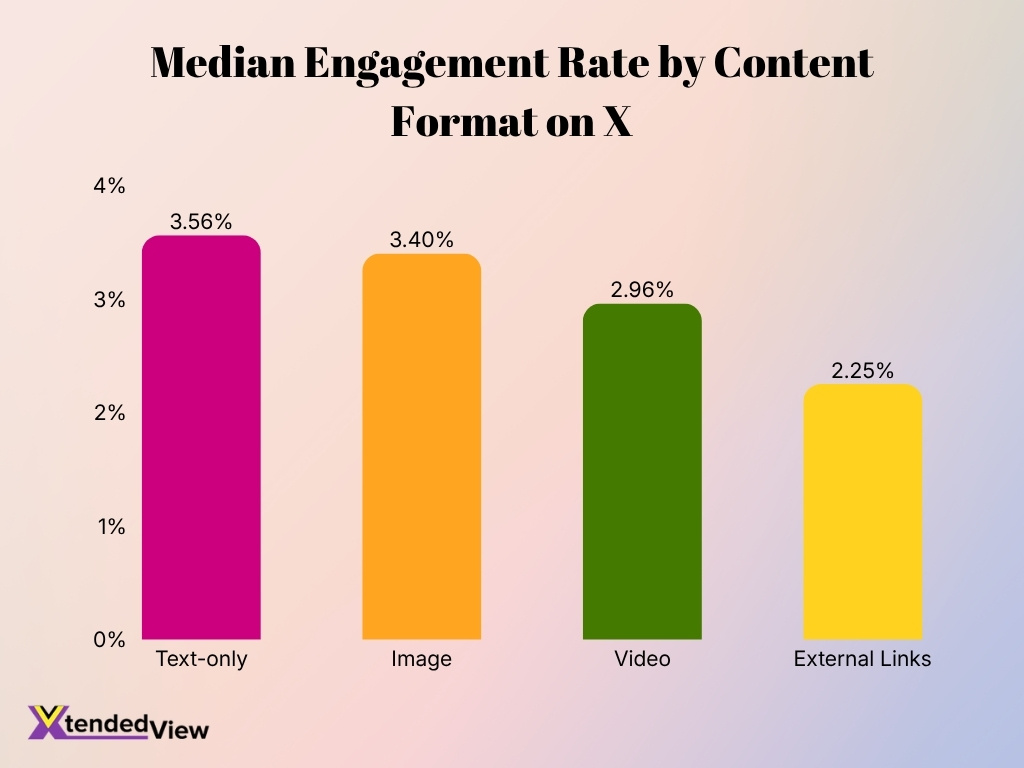
- In the 2026 engagement study, text-only X posts produced the highest median engagement rate at 3.56%. That result challenges the assumption that adding media automatically improves performance on X.
- Image posts ranked a close second with a 3.40% median engagement rate. The narrow 0.16-percentage-point gap suggests that both text and static visuals can perform well when the underlying message fits the audience.
- Video posts generated a 2.96% median engagement rate in the same analysis. Video therefore trailed both text and images on X even though it leads engagement strategies on several other social platforms.
- Posts containing external links produced the weakest result among the four primary formats, with a 2.25% median engagement rate. This was about 37% below the 3.56% text-only benchmark.
- Content-format performance changes by industry. Media brands posted links heavily, yet video posts generated about 2.5 times more engagement than their link posts in the 2025 industry benchmark.
- For higher education accounts, photos generated the highest engagement and were published roughly three times more often than any other post format. This indicates that campus imagery continues to suit X’s education audience.
- Among travel brands, photo and video posts produced approximately twice the engagement of link and status posts. Visual storytelling therefore performs materially better in travel than the overall platform average might imply.
- Nonprofit accounts saw their strongest engagement from video posts, even though organizations published photos and links more frequently. The gap suggests production cost, rather than weak performance, may limit nonprofit video volume.
- Influencer accounts showed a different pattern: plain status updates slightly outperformed photos even though influencers posted images nearly three times as often. Format performance on X therefore depends heavily on audience and account type.
Twitter CPM, CPC, and CTR Benchmarks
- A 2025 analysis across thousands of advertising accounts placed median X cost per click at approximately $0.18. Actual CPC varies substantially with objective, audience, geography, and bidding competition.
- Internal campaign data from another 2025 advertiser produced a higher X CPC of $0.74. The fourfold difference between major datasets shows why a single CPC figure should never function as a guaranteed planning cost.
- The same campaign data recorded an X CPM of $2.09, meaning advertisers paid about $2.09 for 1,000 impressions in that account sample.
- Median cost per engagement came in at approximately $0.13 in the broader 2025 agency analysis. Engagement pricing can include interactions such as clicks, likes, reposts, and replies depending on campaign configuration.
- Median cost per acquisition reached $21.55 in that dataset. CPA should receive more weight than low CPC when a campaign’s goal involves leads, registrations, or purchases rather than traffic alone.
- Paid X campaigns in the same benchmark produced an engagement rate of 0.59%. Advertisers should keep this separate from organic engagement benchmarks because paid distribution reaches a deliberately targeted audience.
- A separate 2025 paid-social benchmark placed X’s typical CTR near 0.86%, with CPC commonly ranging from $0.26 to $1.50. The range reinforces how campaign mix and targeting can move costs far from an overall median.
- Regional 2026 results show large geographic differences. X campaigns measured in India produced CPMs of $2.50 to $6, CPCs of $0.25 to $0.80, and CTRs of 0.6% to 1.1% during the first half of 2026.
- In Southeast Asia, the corresponding 2026 X ranges were $3.50 to $8 CPM, $0.35 to $1 CPC, and 0.5% to 0.9% CTR. Advertisers targeting the U.S. should not directly apply these lower-cost regional benchmarks to domestic campaigns.
Twitter Revenue and Financial Performance
- X’s worldwide advertising revenue was projected to reach $2.26 billion in 2025, up 16.5% year over year. That marked the first expected annual ad-revenue increase since Elon Musk acquired Twitter in 2022.
- U.S. advertising revenue was forecast to reach $1.31 billion in 2025, representing 17.5% annual growth. Based on those estimates, the U.S. contributed roughly 58% of X’s worldwide advertising revenue.
- The 2025 recovery still left X’s advertising business far below its pre-acquisition peak. Twitter generated $4.51 billion in advertising revenue in 2021, almost twice the estimated 2025 total.
- Put another way, projected 2025 global ad revenue equaled only about 50% of Twitter’s 2021 advertising revenue. The comparison illustrates how much financial ground X still needed to recover despite renewed advertiser spending.
- X received an equity valuation of $33 billion when xAI acquired it in March 2025. Including approximately $12 billion of debt, the transaction assigned X an enterprise value of about $45 billion.
- The $33 billion equity valuation was 25% below the $44 billion Musk paid for Twitter in 2022. However, valuation comparisons require caution because the 2025 transaction involved related companies controlled by Musk rather than an arm’s-length public sale.
- X’s corporate position changed again in February 2026 when SpaceX acquired xAI. The transaction valued SpaceX at approximately $1 trillion and xAI at $250 billion, creating a combined $1.25 trillion company that also contains X.
- Consequently, there is no audited standalone X revenue figure for 2026 available to the public. X remains a private business inside a larger corporate structure, so current financial assessments depend heavily on advertising forecasts, transaction disclosures and private-company reporting.
X Premium Subscriber Penetration Statistics
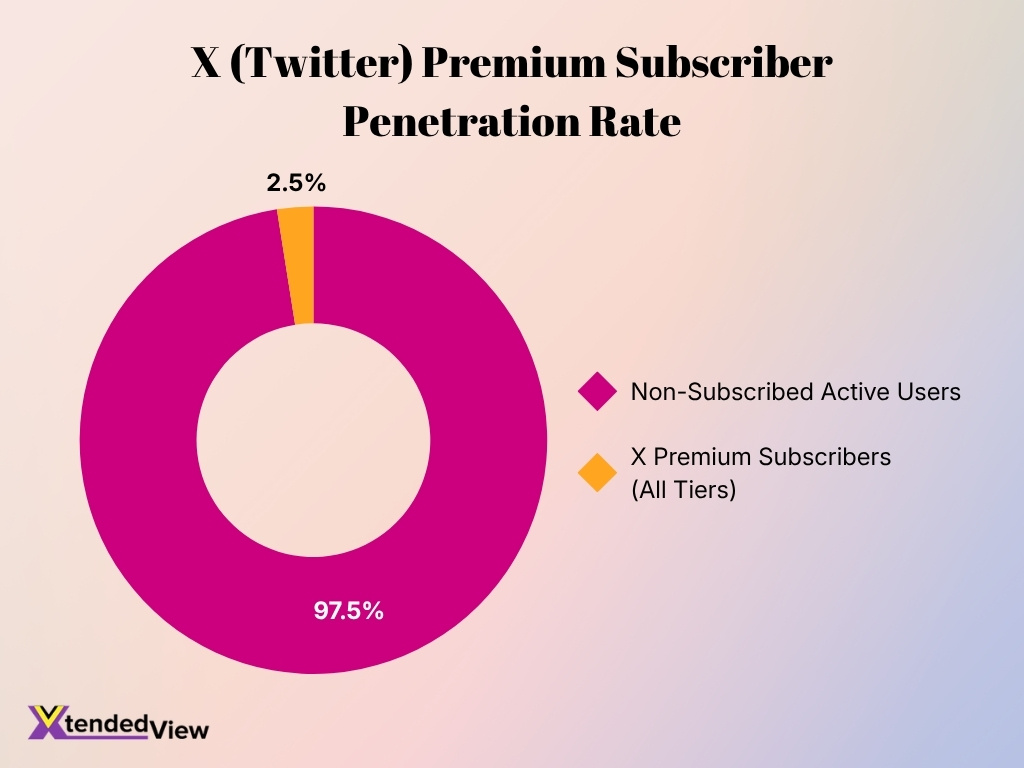
- X Premium subscribers account for just 2.5% of the platform’s active user base in 2026, representing an estimated 14.2 million users.
- Non-subscribed users dominate X, accounting for approximately 97.5% of active users, or around 546.8 million people.
- For roughly every 39 active X users, only one is estimated to subscribe to an X Premium tier.
- The gap between paid and non-paid users remains substantial, with approximately 532.6 million more non-subscribers than Premium subscribers.
- Based on these estimates, X has about 561 million total active users, highlighting the relatively limited penetration of its paid subscription offering.
Twitter Creator Economy and Monetization Data
- X said it ended 2025 with its highest creator payouts since launching its monetization program. It did not publish a complete audited dollar total for those 2025 payouts.
- At the beginning of 2026, X said it had more than doubled the Revenue Sharing pool, linking the increase partly to growth in Premium subscriptions during 2025.
- Under the Revenue Sharing program, creators needed at least 5 million organic impressions during the previous three months and 500 verified followers, in addition to a qualifying Premium subscription.
- Revenue Sharing payouts were processed every two weeks, with a minimum payment threshold of $30. Creators also had to connect an eligible payout account and complete identity verification.
- In 2026, payout calculations increasingly emphasized views from verified users. X said Verified Home Timeline impressions carried weight, while views from higher Premium tiers could have greater value.
- X stopped accepting new Creator Revenue Sharing enrollments on Aug. 7, 2026 and scheduled the old program to end Sept. 7, 2026. Existing members were allowed to continue earning until that cutoff.
- The replacement, Original Content Rewards, begins its rollout to existing eligible creators on Sept. 8, 2026. The new model places greater emphasis on original reporting, analysis, images, videos and other creator-produced material.
- Eligibility for the replacement program includes at least 500 verified followers and 500,000 qualifying Home Timeline impressions from verified users within 90 days. That represents a significant change from the 5 million-organic-impression requirement under the outgoing system.
- X also offers paid Creator Subscriptions. Eligible creators can receive up to about 97% of gross subscription revenue, subject to payment-processing, app-store, refund and related deductions.
- Creator Subscription payouts require at least $50 in attributed earnings. Payments are generally made through Stripe, with the earnings threshold rolling into subsequent periods when creators fall below the minimum.
Twitter vs Competitors
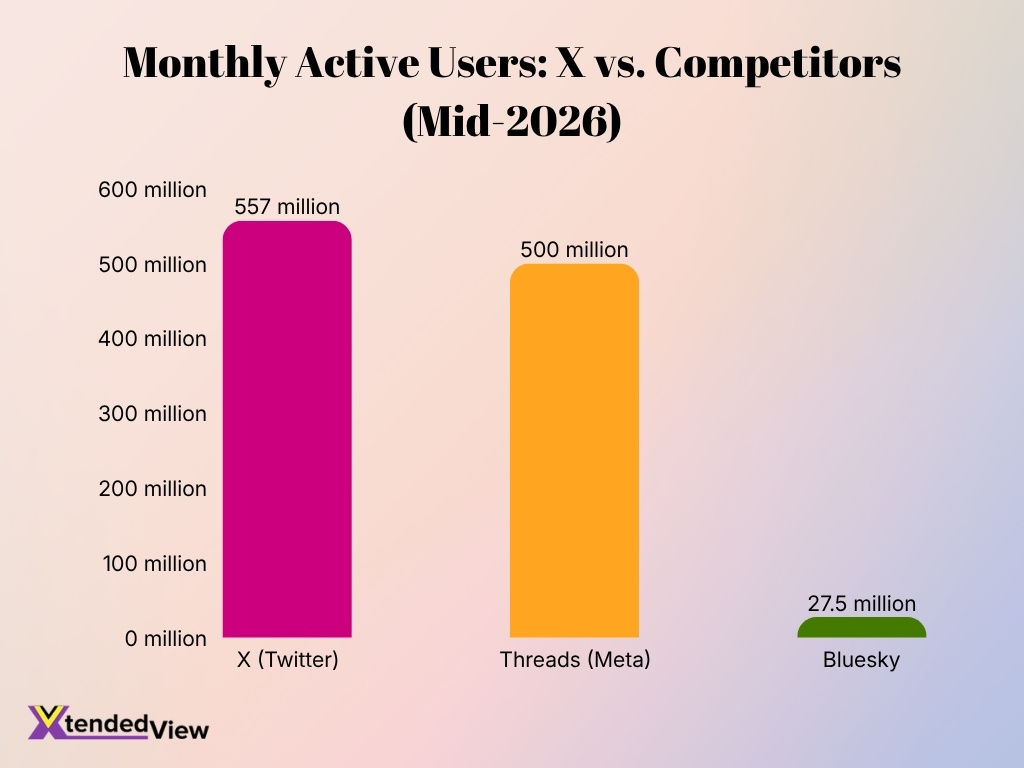
- X (Twitter) leads the comparison with an estimated 557 million monthly active users as of mid-2026.
- Threads has surpassed 500 million monthly active users, putting Meta’s platform within roughly 57 million users of X.
- X’s audience is about 11% larger than Threads’ 500 million baseline, showing that the two platforms are now relatively close in scale.
- Bluesky remains considerably smaller, with approximately 27.5 million monthly active users.
- X has roughly 20 times more monthly active users than Bluesky, highlighting the substantial audience gap between the platforms.
- Together, the figures show that X and Threads dominate the comparison, while Bluesky currently represents a much smaller share of the social media audience.
Twitter Business and B2B Marketing Statistics
- 61% of B2B marketers reported using X/Twitter in the 2025 B2B content-marketing benchmark, down from 73% in the previous year’s study. This 12-percentage-point drop made X the clearest declining major organic B2B channel in that dataset.
- Correspondingly, 39% of B2B marketers said they did not use X, compared with 27% a year earlier. This suggests many organizations have shifted resources toward other professional and video-led channels.
- Only 7% of B2B marketers said X delivered the best value for their organization. LinkedIn dominated the same measure at 85%.
- Just 6% of B2B marketers increased their use of X during the year covered by the 2025 study. By comparison, 68% increased LinkedIn use and 31% increased YouTube use.
- Across marketers globally, X was used by 27% for marketing purposes in a January 2025 survey of 1,435 respondents. Facebook reached 83%, Instagram 78%, LinkedIn 69%, and YouTube 53%.
- Another global 2025 marketer study found that only 17% planned to increase organic X activity, while 14% intended to decrease it. X had the highest planned organic decrease among the major platforms measured.
- Despite lower organic enthusiasm, 68% of surveyed marketers planned to continue or expand investment in X during 2025. This indicates that reduced organic platform use does not necessarily mean complete withdrawal from paid or targeted campaigns.
- Only 18% of marketers ranked X among their three highest-ROI social platforms in that 2025 research. This leaves X competing for budget against platforms with stronger reported marketing returns.
- A 2026 B2B marketing mix study showed 37% of respondents using boosted or paid X advertising, compared with just 18% using organic X posts. This suggests that some B2B teams now see X more as a targeted paid channel than a core organic publishing platform.
- The same 2026 study placed LinkedIn boosted or paid advertising at 64%, well ahead of X’s 37%. For B2B marketers, X therefore remains relevant for live industry conversations and paid reach but no longer matches LinkedIn’s strategic importance.
Frequently Asked Questions (FAQs)
X and Grok had approximately 550 million monthly active users as of March 31, 2026, up from about 520 million at the end of 2025.
X had about 123.7 million mobile daily active users worldwide in July 2026, down 7% year over year.
Users generate roughly 350 million posts per day on X, according to 2026 company disclosures.
X’s worldwide advertising revenue was estimated at $2.26 billion in 2025, representing 16.5% year-over-year growth.
X had an estimated 99 million reachable users in the United States in late 2025, equal to 30.6% of the country’s internet users.
Conclusion
Twitter, now X, remains a large global platform, with hundreds of millions of users, strong web traffic, and continued importance in real-time news, politics, technology, and live events. However, its mobile audience faces pressure from Threads, advertiser recovery remains incomplete compared with Twitter’s pre-acquisition peak, and B2B marketers have reduced their reliance on the platform. At the same time, X continues to reshape Premium, creator monetization, and verification as it tries to diversify beyond advertising. Overall, the 2026 data shows a platform that still commands significant attention but now competes in a more fragmented and demanding social media market.
