


Online and in-store shopping continue to shape how consumers discover, compare, and purchase products. Retailers now blend digital and physical experiences through services such as Buy Online, Pick Up In Store (BOPIS), mobile apps, and omnichannel fulfillment to meet changing customer expectations. These trends influence inventory planning, marketing strategies, pricing, and customer loyalty across industries including retail, grocery, fashion, and consumer electronics. Explore the statistics below to understand how shopping behavior continues to evolve.
Editor’s Choice
- E-commerce accounted for 16.9% of total U.S. retail sales in Q1 2026, up from 16.6% in Q4 2025 and 16.8% on a nonadjusted basis, highlighting continued online retail growth.
- Online retail represented 16.4% of total U.S. retail sales in 2025, compared with 16.1% in 2024, based on annual estimates.
- U.S. retail e-commerce sales reached an estimated $326.7 billion during the first quarter of 2026, growing 9.8% year over year, while overall retail sales increased 3.9%.
- During the 2025 Thanksgiving shopping weekend, 202.9 million consumers shopped across online and physical channels, setting a new holiday shopping record.
- Physical stores still generated roughly 84% of total U.S. retail sales during 2025, showing that brick-and-mortar retail remains the dominant purchasing channel despite digital growth.
- Retailers projected that consumers would return $849.9 billion worth of merchandise in 2025, representing 15.8% of annual retail sales.
- Mobile shopping continues to lead digital commerce adoption, with smartphones remaining the preferred device for U.S. online purchases throughout 2025.
Recent Developments
- The U.S. Census Bureau reported that first-quarter 2026 e-commerce sales increased 2.7% quarter over quarter, reaching $326.7 billion.
- E-commerce sales grew 9.8% year over year in Q1 2026, significantly faster than the 3.9% increase recorded for total retail sales.
- Online purchases represented 16.9% of all retail sales in Q1 2026, marking another increase in digital retail penetration.
- Annual estimates show online retail’s share climbed from 16.1% in 2024 to 16.4% in 2025, extending its long-term upward trend.
- Holiday shoppers spent a record $44.2 billion online during the 2025 Cyber Week period, up 7.7% from the previous year.
- Cyber Monday 2025 generated approximately $14.25 billion in U.S. online sales, making it one of the largest digital shopping days on record.
- Physical stores attracted 129.5 million shoppers during the 2025 Thanksgiving shopping weekend, reflecting continued consumer demand for in-store experiences.
- Average holiday spending increased to $337.86 per shopper in 2025, compared with $315.56 in 2024.
- AI-powered shopping assistants became more widely used in 2025 as consumers increasingly relied on them for product comparisons and deal discovery.
Online vs. In-Store Sales Statistics
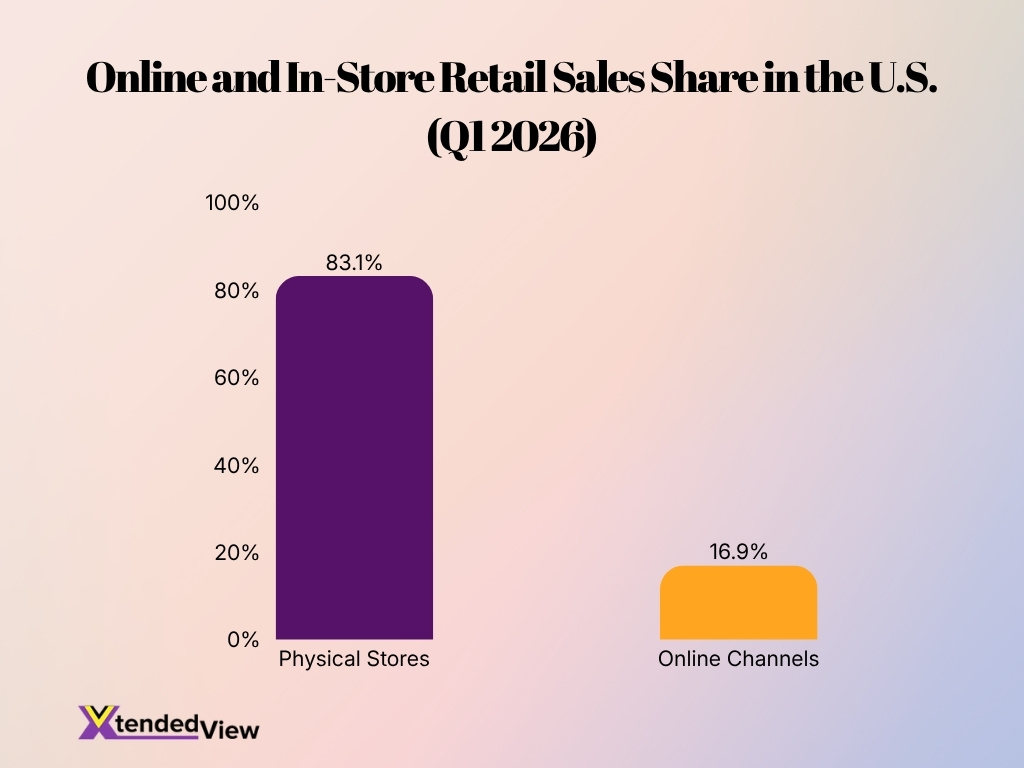
- Online channels accounted for 16.9% of U.S. retail sales in the first quarter of 2026, leaving approximately 83.1% to physical stores.
- Annual estimates place online retail at 16.4% of total U.S. retail sales during 2025, compared with 16.1% in 2024.
- U.S. online retail sales totaled $326.7 billion during Q1 2026.
- Total U.S. retail sales reached approximately $1.929 trillion during Q1 2026.
- Online sales increased 9.8% year over year in Q1 2026, more than double the overall retail growth rate.
- Total retail sales increased 3.9% year over year during the same period, demonstrating continued resilience in physical retail.
- Fourth-quarter 2025 online retail sales reached $316.1 billion, accounting for 16.6% of total retail sales.
- General merchandise stores generated roughly $940 billion in U.S. sales during 2024, reinforcing the scale of physical retail operations.
- Despite rapid digital growth, physical stores continued to capture the majority of retail spending across most product categories in 2025.
Online Shopping Statistics
- Smartphones remained the primary device for online shopping in the United States throughout 2025.
- U.S. online retail sales exceeded $326 billion in Q1 2026 alone.
- Online retail expanded 9.8% year over year in the first quarter of 2026.
- Annual online retail penetration increased from 16.1% in 2024 to 16.4% in 2025.
- The most downloaded shopping app in the U.S. during 2024 recorded approximately 87 million downloads, illustrating growing mobile commerce adoption.
- Online spending during the 2025 Thanksgiving shopping weekend reached a record $44.2 billion.
- Cyber Monday 2025 generated $14.25 billion in online sales, outperforming previous years.
- AI-assisted shopping became increasingly mainstream in 2025 as shoppers used conversational tools to compare products, prices, and promotions before purchasing.
- U.S. customer satisfaction for online retail remained strong, reaching an ACSI score of 79 in 2025.
In-Store Shopping Statistics
- Physical stores continued to account for roughly 83% to 84% of total U.S. retail sales in 2025 and early 2026.
- 129.5 million consumers shopped in physical stores during the 2025 Thanksgiving weekend.
- In-store holiday shopping traffic increased 3% compared with the previous year during the 2025 holiday shopping weekend.
- General merchandise stores generated approximately $940 billion in U.S. sales during 2024.
- Clothing and clothing accessories stores recorded roughly $304 billion in sales during 2024.
- Retail vacancy rates remained near historic lows as demand for well-performing physical locations stayed resilient.
- Many retailers increasingly used physical stores as local fulfillment hubs for online orders, improving delivery speed and reducing shipping costs.
- Experience-driven retail formats, discount stores, and omnichannel fulfillment continued to strengthen the role of physical shopping in 2025.
Hybrid Shopping Statistics
- Over 50% of consumers regularly utilize BOPIS services for digital convenience.
- Retailers currently fulfill up to 60% of their online orders directly from physical stores.
- Nearly 40% of modern shoppers leverage AI-powered tools to compare retail products.
- A record 202.9 million shoppers mixed online and offline channels during the 2025 holidays.
- More than 75% of in-store purchases are now completed using contactless payment methods.
- Approximately 65% of retail brands offer same-day pickup to avoid centralized warehouse delays.
- Up to 80% of buyers heavily research products online before visiting physical store locations.
- Omnichannel shoppers exhibit a 25% increase in price sensitivity during in-store visits.
E-Commerce as a Share of Total Retail Sales
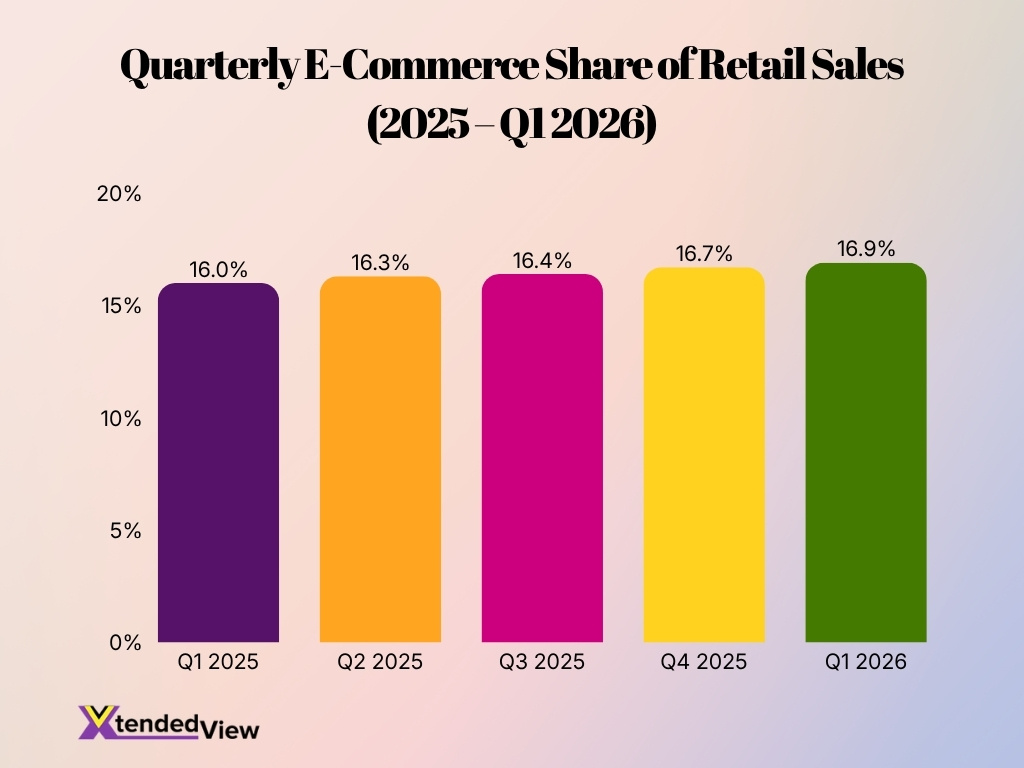
- E-commerce represented 16.9% of seasonally adjusted U.S. retail sales in Q1 2026, the latest official quarterly figure available as of August 2026.
- The online share stood at 16.0% in Q1 2025, meaning e-commerce gained 0.9 percentage points within one year.
- E-commerce’s share increased to 16.3% in Q2 2025 and 16.4% in Q3, showing steady adoption throughout the year.
- Online sales accounted for 16.7% of retail sales in Q4 2025, boosted by Black Friday, Cyber Monday, and year-end holiday demand.
- Based on the Q1 2026 share, physical retail still generated approximately 83.1% of U.S. retail sales, keeping stores central to the overall market.
- On a nonadjusted basis, online transactions represented 16.8% of total sales in Q1 2026. The slight difference reflects seasonal adjustments rather than conflicting market estimates.
- E-commerce’s 9.8% annual growth exceeded total retail growth by 5.9 percentage points in Q1 2026, allowing online channels to gain additional market share.
- Worldwide, e-commerce was projected to account for approximately 24% of retail sales by 2026, placing the global digital share above the current U.S. figure calculated under official U.S. retail definitions.
- Even with continued online expansion, more than four out of every five U.S. retail dollars still flowed through store-based or other non-e-commerce transactions in early 2026.
Online vs. In-Store Shopper Statistics
- 59% of consumers still prefer shopping in a physical store, showing that product inspection, immediate possession, and face-to-face service remain important in 2026.
- Meanwhile, 61% prefer home delivery over collecting an online order from a store. This preference supports continued investment in residential fulfillment and last-mile logistics.
- More than 78% of U.S. shoppers say they enjoy using a mix of online and in-store channels rather than relying on only one shopping method.
- 33% of shoppers begin their buying journey with a general online search, while another 28% start on an online retailer or marketplace.
- Only 12% of consumers begin product discovery by visiting a physical store, even though many later complete their purchases there.
- During the 2025 Super Saturday period, 45% of expected shoppers planned to use both online and physical stores, up from 44% in 2024.
- Another 29% of Super Saturday shoppers planned to shop exclusively in stores, compared with 26% who planned to shop only online.
- More than 85% of U.S. consumers have purchased an item online, confirming that e-commerce now reaches most of the country’s adult shopping population.
- In a global consumer study, only 9% reported satisfaction with the in-store experience, while 14% expressed satisfaction with online shopping. The findings point to improvement opportunities across both channels.
Market Share and Sales Performance
- Seasonally adjusted U.S. e-commerce sales reached approximately $326.7 billion in Q1 2026, representing a 2.7% increase from the preceding quarter.
- Online sales grew 9.8% year over year in Q1 2026, compared with 3.9% growth for total retail sales.
- On a nonadjusted basis, consumers spent $302.3 billion online during Q1 2026, up 9.7% from the same quarter in 2025.
- U.S. online retail sales totaled an estimated $1.234 trillion in 2025, rising from about $1.170 trillion in 2024.
- The 2025 increase added approximately $64 billion in annual e-commerce sales, although the 5.4% growth rate remained below the double-digit increases recorded earlier in the decade.
- Consumers spent a record $257.8 billion online between Nov. 1 and Dec. 31, 2025, a 6.8% increase from the 2024 holiday season.
- Online holiday revenue exceeded $4 billion per day on 25 days in 2025, compared with 18 such days in 2024.
- The four-day July 2025 Prime Day sales period was projected to generate $23.8 billion in U.S. online spending, up 28.4% from the comparable 2024 period.
- Mobile devices generated 56.4% of online holiday revenue in 2025, the highest seasonal share recorded and a sign that smartphones now drive most digital retail spending.
Top Purchase Decision Factors: Online vs. In-Store
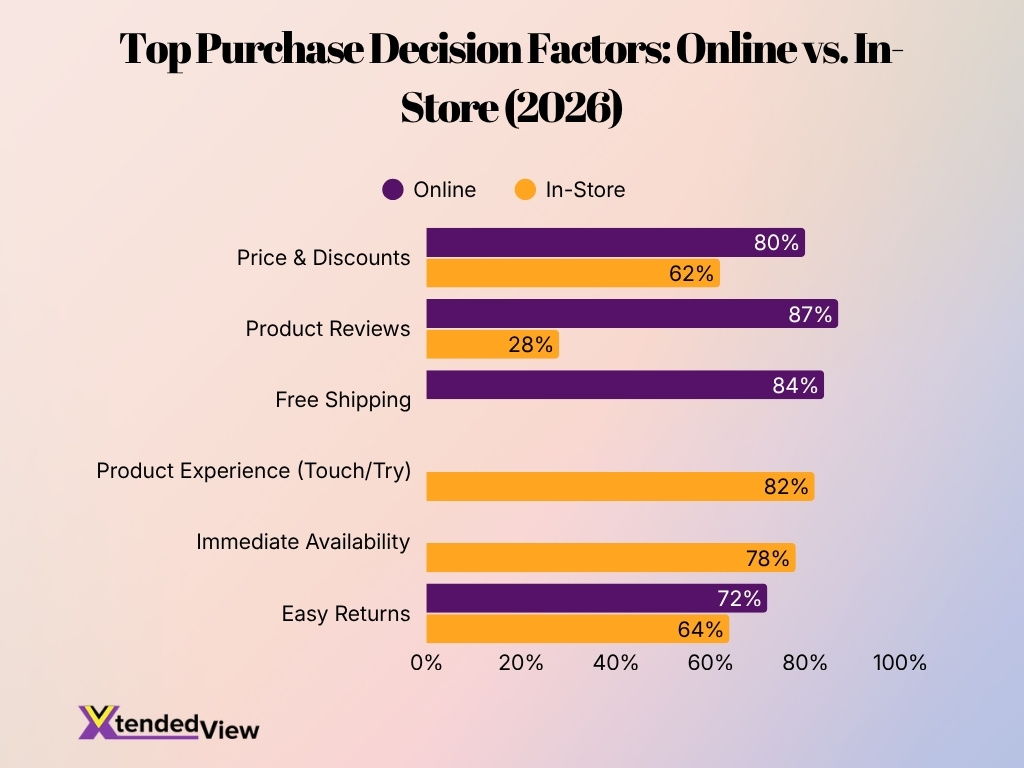
- Product reviews are the most influential online purchase factor, with 87% of online shoppers relying on them before making a buying decision.
- Free shipping ranks as another major online driver, influencing 84% of consumers, making it one of the strongest incentives for online purchases.
- Price and discounts remain highly important across both channels, affecting 80% of online shoppers compared to 62% of in-store shoppers.
- Product experience, such as the ability to touch or try items, is the leading in-store purchase factor, influencing 82% of shoppers.
- Immediate availability is a key advantage for physical stores, with 78% of consumers preferring to buy in-store when they can take products home immediately.
- Easy returns matter to shoppers regardless of channel, cited by 72% of online shoppers and 64% of in-store shoppers.
- The data highlights that online shopping decisions are primarily driven by reviews, free shipping, and discounts, while in-store purchases are influenced more by hands-on product experience and instant product access.
- Overall, the comparison shows that digital convenience factors dominate online buying behavior, whereas physical shopping benefits continue to give brick-and-mortar stores a competitive advantage.
Shopping Behavior and Preferences
- 78% of American consumers prefer combining online and in-store shopping for flexibility.
- Only 12% of shoppers begin product discovery in-store, while most finish purchases there.
- In 2025, 38% of U.S. consumers used generative AI for shopping, while 52% planned to.
- 72% of AI-assisted shoppers are less likely to return products due to better research.
- AI-driven traffic to U.S. retail websites surged by 4,700% year-over-year in July 2025.
- Only 14% of global consumers feel completely satisfied with online shopping experiences.
- 55% of consumers want virtual AI assistants, and 59% want broader AI shopping apps.
- 47% of back-to-school consumers waited for the best deals, showing high price awareness.
- 24% of back-to-school shoppers delayed purchases to better manage their budget spending.
Shopping Frequency: Online vs. In-Store
- Approximately 65% of Americans shop in physical stores weekly.
- By July 2026, about two-thirds of U.S. households (86 million) shopped online at least once per week.
- Weekly online shopping grew from two in five households in 2019 to about two in three in 2026.
- Among consumers ages 18 to 24, 31% shop online two or three times per month.
- The average consumer makes approximately six impulse purchases per month across various channels.
- 37% of consumers are more likely to buy impulsively online, compared to 35% in physical stores.
- During the 2025 back-to-school season, 55% of shoppers started buying products by early July.
- Despite early shopping, 84% of back-to-school shoppers still had at least half of their planned purchases left.
- The 2025 holiday season saw 25 separate days with over $4 billion in U.S. online spending, up from 18 days in 2024.
Online vs. In-Store Shopping by Generation
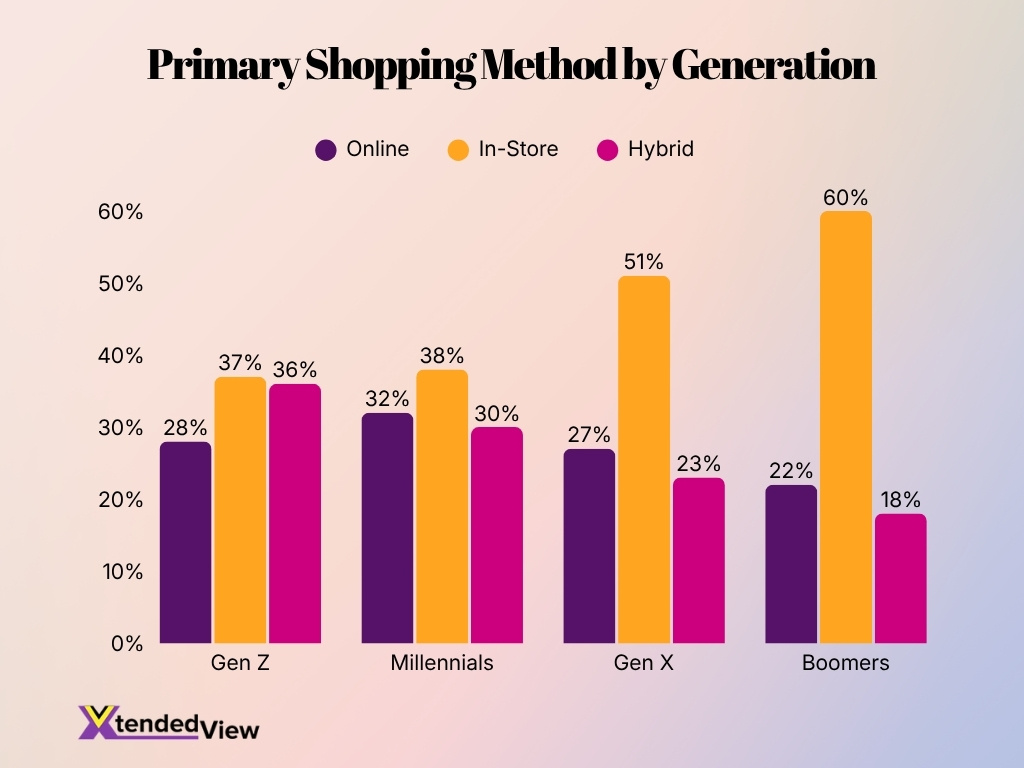
- Boomers are the most in-store focused shoppers, with 60% preferring physical stores, the highest share among all generations.
- Gen X ranks second for in-store shopping, with 51% choosing brick-and-mortar stores as their primary shopping method.
- Millennials show a more balanced shopping pattern, with 38% preferring in-store, 32% shopping online, and 30% using hybrid methods.
- Gen Z has the most evenly distributed shopping preferences, with 37% preferring in-store, 36% hybrid, and 28% online shopping.
- Hybrid shopping is most popular among Gen Z (36%), followed by Millennials (30%), indicating younger consumers are more likely to combine digital and physical shopping experiences.
- Online shopping reaches its highest share among Millennials at 32%, compared with 28% for Gen Z, 27% for Gen X, and 22% for Boomers.
- The preference for in-store shopping increases with age, rising from 37% among Gen Z to 60% among Boomers.
- Boomers have the lowest hybrid adoption at 18%, suggesting they are less likely to switch between online and physical channels during the shopping journey.
- Millennials are the generation with the most balanced channel mix, with only an 8 percentage point difference between their highest and lowest shopping preferences.
- The data highlights a clear generational divide, with younger consumers embracing hybrid and online shopping, while older generations continue to favor traditional in-store retail.
Consumer Demographics
- An estimated 288 million Americans shop online, generating about $1.43 trillion in spending over a recent 12-month period. This reach makes digital shopping a mainstream activity across income and age groups.
- 59% of Generation Z consumers shop online at least once per week, reflecting the group’s comfort with mobile apps, digital wallets, and social product discovery.
- About 28.4% of Americans prefer to complete most or all of their shopping online. However, this figure also shows that most consumers continue to use stores for at least part of their purchasing.
- U.S. consumers ages 18 to 30 made an average of 7.7 online returns during the 12 months covered by a 2025 study, more than any other age group.
- Higher-income households gain more financial value from access to e-commerce. One study estimated benefits equal to 1.3% of consumption for wealthier households, compared with 0.45% among households earning $50,000 or less.
- Researchers analyzing the purchase histories of 4,248 U.S. online shoppers found that buying patterns could reveal personal characteristics such as age, gender, race, health, and lifestyle.
- The same research achieved predictive accuracy above 0.90 AUC for gender and above 0.80 for diabetes status, illustrating the privacy implications of demographic targeting in e-commerce.
- Roughly 11% of Americans use GLP-1 medications, creating a growing shopper segment with changing apparel sizes and fit requirements.
- More than two-thirds of GLP-1 users say sizing changes make them more likely to shop for clothing in person, demonstrating how health and lifestyle changes can influence channel preferences.
Consumer Reasons for Online vs. In-Store Shopping
- 61% of consumers prefer home delivery to in-store pickup, making convenience and direct-to-door fulfillment key reasons for choosing online shopping.
- In contrast, 59% still prefer shopping in stores, where they can examine products, confirm fit, and receive items without waiting for delivery.
- 67% of surveyed U.S. shoppers said they preferred click-and-collect services, which combine online ordering with the speed of local store pickup.
- Fast delivery remains especially important to younger shoppers: 44% of consumers ages 18 to 24 prioritize same-day or next-day delivery.
- Product research and recommendations rank among the leading reasons consumers use generative AI while shopping, alongside list creation and virtual try-ons. In 2025, 52% planned to use these tools.
- Price remains a central online-shopping motivator. During the 2025 back-to-school season, 47% of consumers who had not finished shopping said they were waiting for better deals.
- Physical shopping maintains an advantage for categories such as apparel because customers can test fit and sizing. In 2026, more than two-thirds of GLP-1 users said they were more likely to shop in person because of sizing changes.
- Consumers often favor stores for immediate ownership, while online channels appeal to people seeking broader product access, easier comparison, and home delivery. The result is a market in which 78% prefer mixing channels.
- Returns can reduce online convenience: retailers expected 19.3% of online sales to be returned in 2025, making accurate sizing, detailed product information, and easy return policies important purchase factors.
Online vs. In-Store Shopping by Product Category
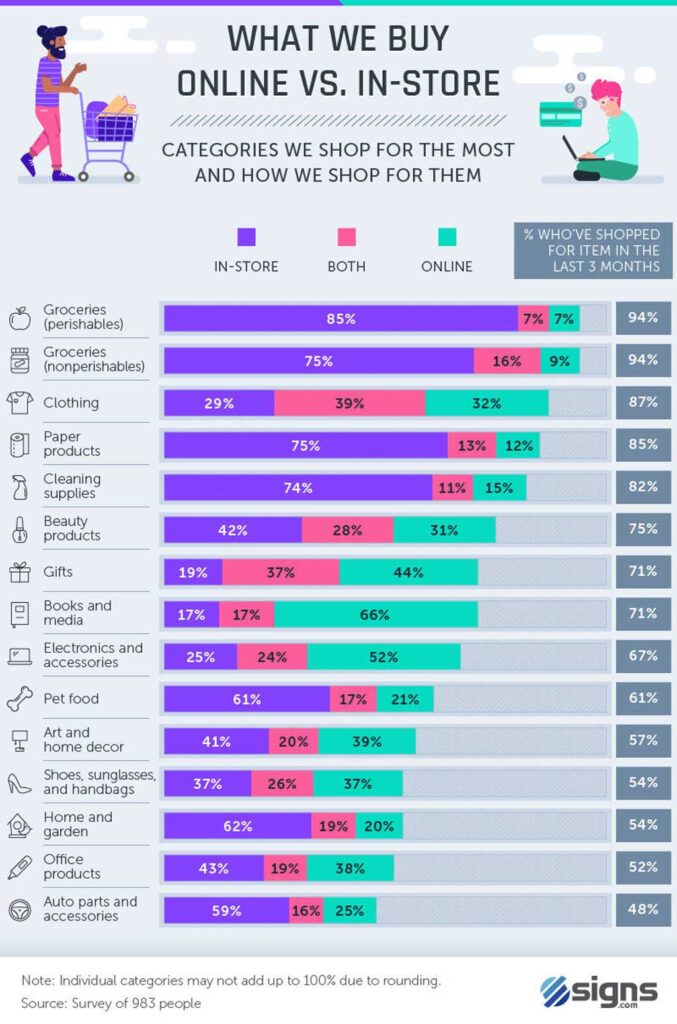
- Perishable groceries are overwhelmingly purchased in-store (85%), while only 7% buy them online, although 94% of consumers purchased them within the last three months.
- Nonperishable groceries also remain primarily in-store purchases (75%), compared to 9% online, with 94% of shoppers buying these items recently.
- Clothing shopping is more balanced, with 39% using both online and in-store, 32% shopping online only, and 29% preferring in-store.
- Paper products continue to favor physical stores, with 75% of purchases made in-store, while 12% are bought online.
- Cleaning supplies are largely purchased in-store (74%), although 15% of shoppers now buy them online.
- Beauty products show a mixed purchasing pattern, with 42% shopping in-store, 31% online, and 28% using both channels.
- Gifts are predominantly purchased through digital channels, with 44% buying online, while 37% use both online and in-store shopping.
- Books and media are the most online-oriented category, with 66% of purchases made online compared to just 17% in-store.
- Electronics and accessories are also primarily bought online, with 52% of shoppers choosing online channels versus 25% shopping in-store.
- Pet food remains an in-store-focused category, with 61% of purchases occurring in physical stores and 21% online.
- Art and home decor purchasing is nearly split between in-store (41%) and online (39%), indicating strong omnichannel demand.
- Shoes, sunglasses, and handbags are evenly divided between in-store (37%) and online (37%), while 26% of shoppers use both methods.
- Home and garden products are mainly purchased in-store (62%), with only 20% of consumers buying them online.
- Office products show a relatively balanced shopping pattern, with 43% purchased in-store and 38% online.
- Auto parts and accessories are still mostly purchased in-store (59%), while 25% of consumers prefer buying them online.
Online vs. In-Store Shopping by Geography
- U.S. e-commerce sales reached $326.7 billion in Q1 2026, growing from $297.7 billion in Q1 2025.
- Online transactions made up 16.8% of total U.S. retail sales during Q1 2026.
- U.S. e-commerce saw a 9.7% year-over-year growth in Q1 2026, compared to a 4% increase in total retail sales.
- Australia registered online purchases from approximately 9.3 million households in a single quarter.
- Australian online spending surged by 14% year over year during that recent quarter.
- Nearly 60% of Australian shoppers avoided paying full price, relying heavily on discount events.
- The average Australian online basket decreased to a record-low $90 as consumers made more selective purchases.
- Global retail e-commerce sales officially surpassed an estimated $3.6 trillion in 2025.
- Business e-commerce sales across 43 measured countries expanded by nearly 60% between 2016 and 2022.
Mobile Commerce and Digital Adoption
- Mobile devices generated 56.4% of U.S. online holiday revenue in 2025, confirming that smartphones now account for most seasonal e-commerce spending.
- Mobile purchasing has moved beyond browsing. Shoppers now use smartphones to research products, compare prices, access loyalty accounts, make payments, and track deliveries within the same purchase journey.
- An estimated 288 million U.S. consumers shop online, creating a large addressable audience for mobile apps, digital wallets, and mobile-optimized checkout experiences.
- 59% of Gen Z consumers shop online weekly, making younger shoppers an important audience for mobile-first storefronts and app-based loyalty programs.
- Traffic from generative AI services to retail websites increased sharply in 2025, although referrals from these tools still represented less than 1% of traffic to several major online marketplaces during the holiday period.
- The projected 2025 holiday e-commerce market reached about $253 billion, while traditional search, direct visits, and retailer websites continued to generate most online sales.
- One 2025 security study evaluated 92 top-grossing Android commerce apps, including 58 U.S.-based applications and 34 international applications.
- Approximately 92% of the assessed apps used at least one unsecured HTTP connection, highlighting the need for stronger mobile security as digital shopping expands.
- The applications earned an average mobile security score of 40.92 out of 100, while 77 apps requested more permissions than researchers considered necessary.
- E-commerce companies using a diversified social media presence achieved 2% to 5% higher web sales than companies concentrating on fewer platforms, according to a 2025 longitudinal study.
Top Concerns About AI-Powered Tools When Shopping Online
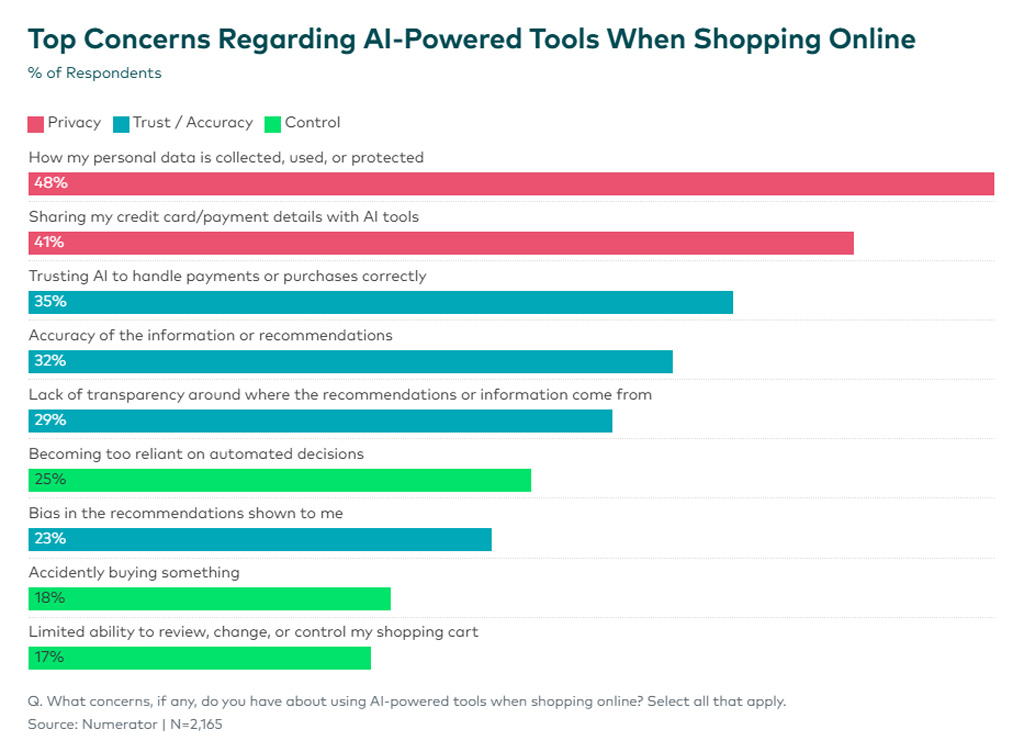
- 48% of consumers said their biggest concern is how their personal data is collected, used, or protected, making privacy the leading issue with AI-powered shopping tools.
- 41% of respondents are worried about sharing their credit card or payment details with AI tools, highlighting continued concerns around financial security.
- 35% of shoppers are concerned about trusting AI to handle payments or purchases correctly, indicating that confidence in AI-driven transactions remains limited.
- 32% of consumers questioned the accuracy of AI-generated information and product recommendations, emphasizing the importance of reliable AI outputs.
- 29% cited a lack of transparency about where AI recommendations or information come from, reflecting demand for greater explainability.
- 25% of respondents feared becoming too reliant on automated decisions, showing concerns about losing human control over shopping choices.
- 23% were concerned about bias in AI recommendations, suggesting that fairness and personalization remain important issues.
- 18% worried about accidentally buying something because of AI assistance, pointing to concerns over unintended purchases.
- 17% reported concerns about having limited ability to review, change, or control their shopping cart, underscoring the need for stronger user control features.
- Overall, privacy, trust, and control emerged as the three major themes influencing consumer confidence in AI-powered online shopping tools.
Future Projections and Growth Trends
- The share of U.S. consumers who shop online could reach 95% by 2040, which would make digital purchasing nearly universal among active shoppers.
- U.S. e-commerce entered 2026 with strong momentum. Q1 sales increased 9.7% year over year, compared with 4% growth for total retail sales.
- Seasonally adjusted quarterly e-commerce revenue climbed from $297.7 billion in Q1 2025 to $326.7 billion in Q1 2026.
- U.S. online retail sales have now surpassed $1 trillion for four consecutive years, demonstrating that e-commerce has established a durable place in the retail economy.
- Online retail sales in 2025 were more than three times their 2015 level, although annual growth has normalized from the exceptional increase recorded during 2020.
- The broader digital economy continues to expand at an estimated 10% to 12% per year, outpacing global gross domestic product growth.
- Artificial intelligence represents a major long-term commerce catalyst. The global AI market could increase from $189 billion in 2023 to $4.8 trillion by 2033.
- AI-referred shoppers remain a small share of online traffic, but their strong purchase intent may encourage retailers to improve product data for conversational search and shopping assistants.
- Physical stores will remain central to retail strategy because they support product trials, immediate possession, local fulfillment, and returns. Early 2026 data still placed non-e-commerce sales above 83% of total U.S. retail sales.
- The likely direction is not an online-only market. Retailers will continue combining mobile commerce, home delivery, pickup, local stores, and digital product discovery into connected shopping journeys.
Frequently Asked Questions (FAQs)
E-commerce accounted for 16.9% of total U.S. retail sales in Q1 2026, leaving about 83.1% to stores and other non-e-commerce channels.
Seasonally adjusted U.S. e-commerce sales reached $326.7 billion in Q1 2026, up 9.8% year over year.
During the 2025 Thanksgiving-to-Cyber-Monday period, 134.9 million consumers shopped online, while 129.5 million shopped in stores.
Retailers estimated that 19.3% of online sales would be returned in 2025, compared with a 15.8% overall retail return rate.
Smartphones generated a record 56.4% of U.S. online holiday revenue in 2025, making mobile the leading digital shopping channel.
Conclusion
Online and in-store shopping continue to complement rather than replace one another, creating a retail environment where consumers expect flexibility across every stage of the buying journey. While online shopping continues to grow faster and capture a larger share of retail spending through mobile commerce, AI-powered discovery, and home delivery, physical stores remain essential for product evaluation, immediate ownership, customer service, and omnichannel fulfillment.
The latest statistics also show that shoppers increasingly move between digital and physical channels depending on the product category, pricing, convenience, and delivery options. As technology advances and consumer expectations continue to evolve, retailers that successfully integrate online and in-store experiences will be better positioned to improve customer satisfaction, strengthen loyalty, and drive long-term growth in an increasingly competitive retail market.
