


The Google Play Store sits at the center of the Android ecosystem, shaping how billions of users discover apps, games, and services. From mobile banking apps powering digital payments to streaming platforms delivering on-demand entertainment, its influence spans industries and user behaviours. As developers compete for visibility and revenue, understanding Play Store trends becomes essential for growth. Let’s explore the latest statistics that define the platform.
Editor’s Choice
- The Google Play Store hosts over 3.6 million apps as of early 2026, reflecting a slight decline from peak levels due to quality enforcement measures.
- Android continues to dominate globally with ~71% mobile OS market share in 2025, maintaining its lead into 2026.
- Users downloaded more than 113 billion apps from Google Play in 2025, showing steady year-over-year growth.
- Google Play generated approximately $48 billion in gross revenue in 2025, including in-app purchases and subscriptions.
- Around 97% of apps on the Play Store are free, highlighting the dominance of freemium models.
- Gaming accounts for over 70% of total Play Store revenue, making it the most profitable category.
- The platform supports over 2.5 billion active Android devices globally, driving massive distribution scale.
Recent Developments
- Google removed over 1.4 million policy-violating apps in 2024, improving store quality entering 2026.
- AI-driven app discovery features increased user engagement by 15–20% in 2025, especially in personalized recommendations.
- Privacy updates led to 30% fewer apps requesting unnecessary permissions compared to 2023.
- Play Store introduced enhanced subscription transparency tools, reducing churn rates by about 5% in 2025.
- Google Play Protect scans over 125 billion apps daily for malware and security threats.
- The introduction of app archiving helped users save up to 60% storage space on average for unused apps.
- Developers adopting Play Integrity API saw a 20% drop in fraudulent installs.
- Regional compliance policies expanded, affecting over 50 countries’ app distribution rules by 2026.
App Count on Google Play Store
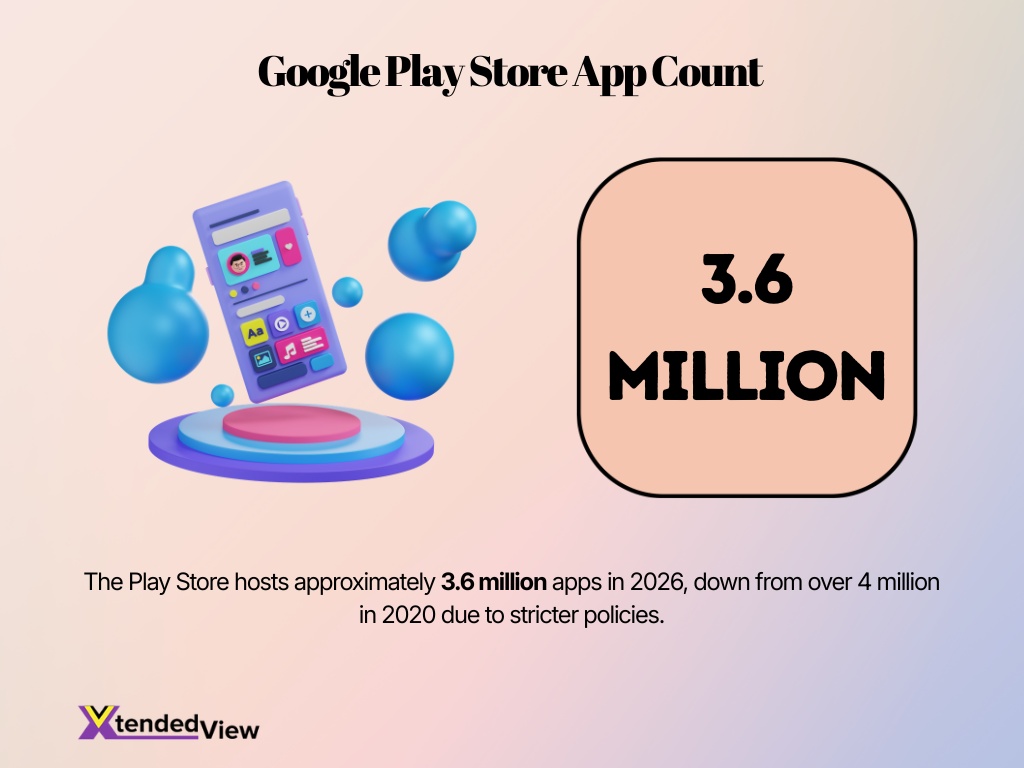
- The Play Store hosts approximately 3.6 million apps in 2026, down from over 4 million in 2020 due to stricter policies.
- Around 1 million apps were removed between 2020–2024 to improve quality and security.
- New app submissions average 30,000–40,000 per month globally.
- Games represent roughly 12–15% of total apps, yet dominate revenue share.
- Utility and productivity apps make up over 20% of total listings, reflecting demand for everyday tools.
- The number of active developers exceeds 3 million worldwide, contributing to app diversity.
- The U.S. accounts for nearly 15% of total published apps, making it one of the largest contributor markets.
- About 85% of apps receive fewer than 5,000 downloads, highlighting visibility challenges.
Growth of Google Play Store Over Time
- The Play Store launched in 2012 with fewer than 500,000 apps, growing rapidly over the next decade.
- It crossed 1 million apps in 2013, doubling within a year of launch.
- By 2017, app count reached 3.5 million, marking peak expansion.
- Growth slowed after 2019 due to stricter review policies and quality controls.
- App count declined by ~25% between 2020 and 2024 due to mass removals of low-quality apps.
- Downloads grew from ~50 billion in 2016 to over 110 billion in 2025, showing sustained demand.
- Revenue increased nearly 3x from 2018 to 2025, driven by subscriptions and in-app purchases.
- Emerging markets contributed to over 60% of new user growth since 2020, especially in Asia and Africa.
Category Breakdown on Google Play Store
- Games remain the largest category by revenue, contributing over 70% of total earnings.
- Tools and productivity apps account for nearly 20% of total app listings.
- Education apps saw a ~25% increase in downloads in 2025, driven by remote learning trends.
- Health and fitness apps grew by over 20% year-over-year, fueled by wearable integrations.
- Finance apps experienced 18% growth in installs, reflecting rising digital payment adoption.
- Entertainment and streaming apps contribute heavily to user engagement, with average session times exceeding 20 minutes.
- Shopping apps account for over 10% of total downloads, especially during seasonal sales.
- Social networking apps maintain high retention, with daily active usage rates above 60%.
- Travel apps rebounded with a 30% increase in installs in 2025, following post-pandemic recovery.
Free vs Paid Apps on Google Play Store
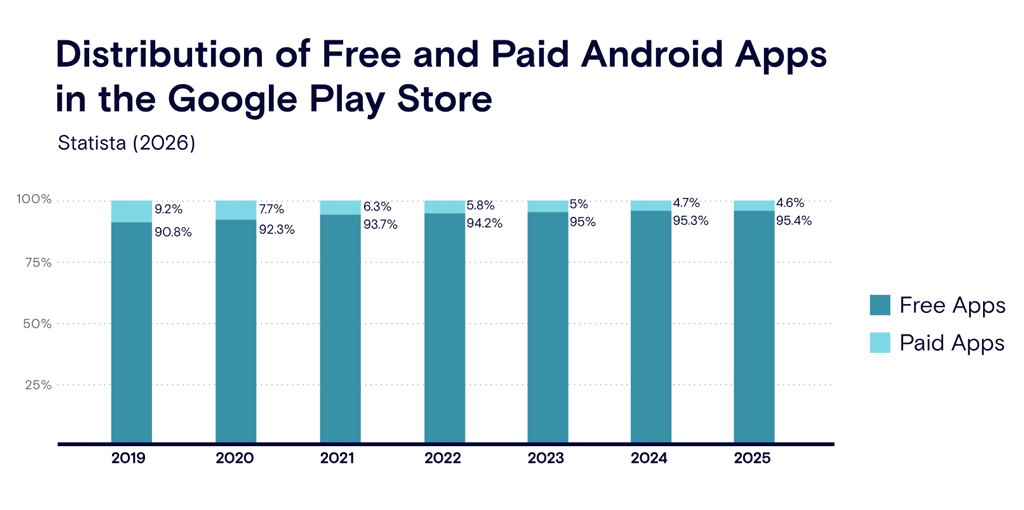
- Free apps made up the majority of Android apps, rising from 90.8% in 2019 to 95.4% in 2025.
- The share of paid apps declined steadily from 9.2% in 2019 to only 4.6% in 2025.
- In 2025, nearly 19 out of every 20 Android apps on the Google Play Store were free.
- The biggest drop in paid apps happened between 2019 and 2020, when the share fell from 9.2% to 7.7%.
- Free app availability crossed 95% for the first time in 2023.
- From 2019 to 2025, the free app share increased by 4.6 percentage points.
- The paid app share was almost cut in half, dropping from 9.2% to 4.6% over the same period.
- The data shows that developers increasingly rely on free downloads, ads, subscriptions, and in-app purchases instead of upfront pricing.
- The Google Play Store has become heavily dominated by the freemium model, where users download apps for free and pay later for premium features.
- By 2025, paid Android apps represented a very small portion of the store, showing a strong shift toward free-first app distribution.
New App Releases on Google Play Store
- Developers release an estimated 35,000+ new apps monthly on the Play Store.
- In 2025, over 400,000 new apps were launched globally, showing consistent supply growth.
- About 60% of new apps originate from independent developers and small studios.
- The approval process typically takes less than 3 days, making it faster than many competing platforms.
- Apps integrating AI features increased by over 25% in 2025, especially in productivity and photo editing categories.
- Roughly 50% of new apps fail to reach 1,000 downloads within their first year.
- Gaming and entertainment categories account for nearly 40% of new app releases.
- Localization efforts improved performance, with apps targeting multiple languages seeing up to 2x higher installs.
- Around 20% of new apps are updated or iterated within their first month, reflecting rapid testing cycles.
App Downloads from Google Play Store
- Google Play recorded over 113 billion downloads in 2025, maintaining its position as the largest app distribution platform.
- Downloads grew by approximately 2–3% year-over-year, indicating market maturity but steady demand.
- Emerging markets contribute over 65% of total downloads, led by countries in Asia and Latin America.
- The average smartphone user downloads 30–40 apps per year on Android devices.
- Games account for over 40% of total downloads, despite being a smaller share of total apps.
- Social and communication apps consistently rank among the top 5 most downloaded categories globally.
- The U.S. contributes roughly 10–12 billion downloads annually, making it a key revenue market.
- Users spend an average of 4–5 hours per day on mobile apps, driving sustained download activity.
- Seasonal spikes, such as holidays, can increase downloads by 20–30% in short periods.
Revenue Generated by Google Play Store
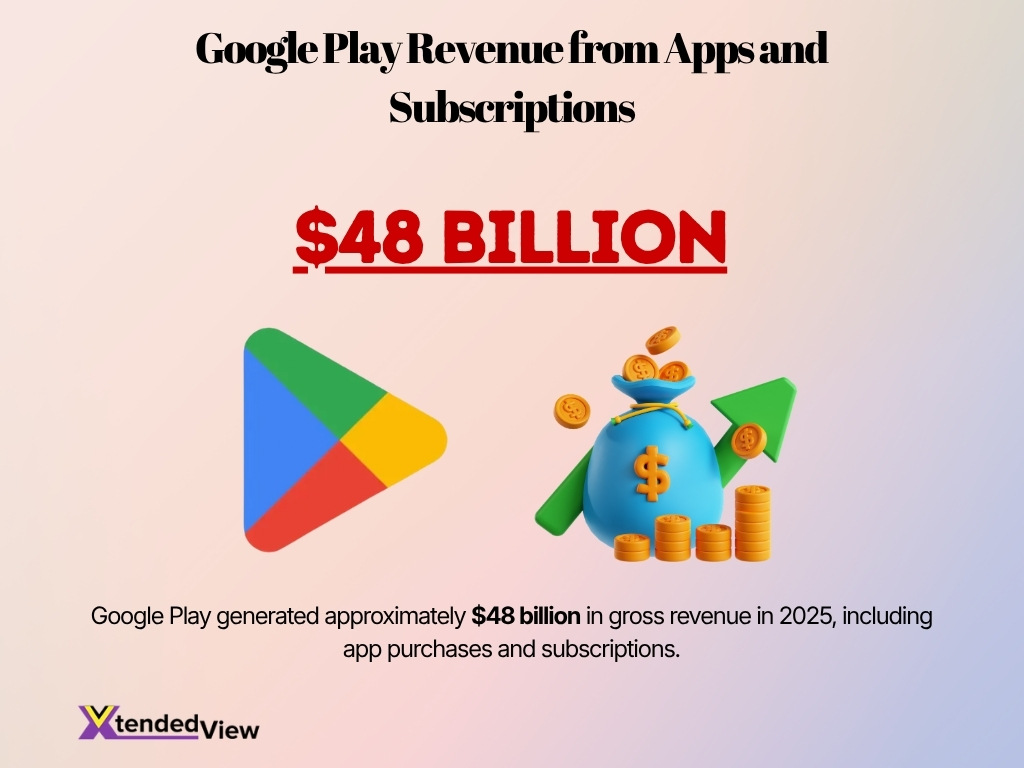
- Google Play generated approximately $48 billion in gross revenue in 2025, including app purchases and subscriptions.
- In-app purchases account for over 70% of total revenue, making them the primary monetization method.
- Subscription revenue grew by over 25% year-over-year, particularly in streaming and productivity apps.
- Gaming alone contributes nearly 70% of Play Store revenue, dominating monetization trends.
- The U.S. remains the top revenue-generating market, contributing over 30% of total global revenue.
- Average revenue per user increased by ~10% in 2025, driven by higher subscription adoption.
- Advertising revenue linked to Play Store apps exceeds $60 billion globally, including off-store monetization.
- Paid app revenue continues to decline, accounting for less than 5% of total earnings.
- Top 1% of publishers generate over 80% of total revenue, highlighting a highly concentrated market.
Top Free Apps on Google Play Store
- Social media and messaging apps consistently rank among the most downloaded free apps globally.
- Free apps account for over 98% of total downloads, emphasizing accessibility.
- The top 10 free apps often exceed 500 million downloads each.
- Communication apps dominate U.S. charts, with daily active users in the hundreds of millions.
- Short-form video apps saw over 30% growth in installs in 2025, driven by content consumption trends.
- Utility apps like file managers and cleaners remain popular, especially in emerging markets.
- Free gaming apps account for over 80% of total game downloads.
- App store featuring can increase downloads by up to 300% within a week.
- Apps optimized for low storage and data usage see higher adoption rates in developing regions.
Top Paid Apps on Google Play Store
- Paid apps represent only ~3% of total apps, yet they still attract niche audiences willing to pay upfront.
- The average price of top paid apps ranges between $0.99 and $9.99, depending on functionality and category.
- Productivity and utility apps dominate paid charts, accounting for over 40% of top paid downloads.
- Paid games make up nearly 25% of top paid apps, often offering ad-free experiences.
- The U.S. leads paid app purchases, contributing over 35% of global paid app revenue.
- Paid app downloads account for less than 2% of total installs, reflecting user preference for free options.
- Premium apps with one-time purchases saw a decline of ~10% in 2025, as subscriptions gained popularity.
- Educational and professional apps maintain stable demand, with consistent yearly growth of 5–8%.
- Apps offering bundled features (no ads + offline access) see higher conversion rates among paid users.
Top Android Apps By Google Play Store Revenue
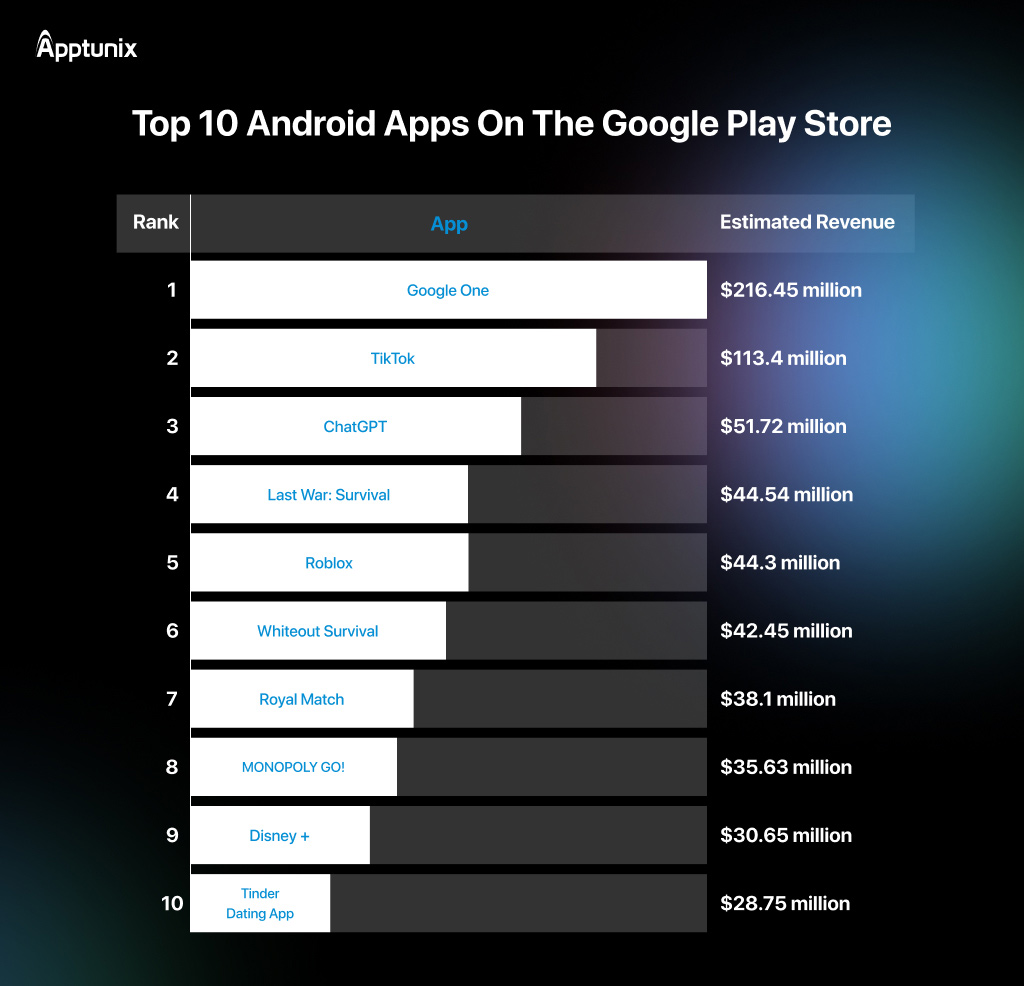
- Google One leads the ranking with the highest estimated revenue of $216.45 million.
- TikTok ranks second with $113.4 million, making it the only other app above $100 million.
- ChatGPT holds the third position with $51.72 million in estimated revenue.
- The gap between Google One and TikTok is significant at $103.05 million.
- Last War: Survival ranks fourth with $44.54 million, slightly ahead of Roblox at $44.3 million.
- Gaming apps perform strongly, with Last War: Survival, Roblox, Whiteout Survival, Royal Match, and MONOPOLY GO! in the top 10.
- Whiteout Survival generated $42.45 million, placing it sixth among Android apps.
- Royal Match and MONOPOLY GO! earned $38.1 million and $35.63 million, respectively.
- Disney+ ranked ninth with estimated revenue of $30.65 million.
- Tinder Dating App completed the top 10 list with $28.75 million in estimated revenue.
User Base of Google Play Store
- Android powers over 2.5 billion active devices worldwide, forming the core Play Store user base.
- The Play Store reaches users in 190+ countries, making it the largest app distribution platform globally.
- Over 70% of global smartphone users rely on Android devices as of 2025.
- The U.S. has over 130 million Android users, contributing significantly to app revenue.
- Emerging markets account for over 60% of new Android users, especially in India, Brazil, and Indonesia.
- Average session time per user exceeds 4 hours daily across apps, indicating high engagement.
- Over 80% of Android users download at least one app per month, maintaining steady activity.
- Younger demographics (18–34) represent the largest segment of active users, especially in gaming and social apps.
- Multi-device usage increased, with 30% of users accessing apps across phones, tablets, and wearables.
Search Ranking Factors on Google Play Store
- App title and keyword relevance remain primary ranking factors, influencing visibility in search results.
- Apps with higher ratings (4.0+) rank significantly better than lower-rated competitors.
- Download velocity impacts rankings, with apps gaining rapid installs seeing up to 2x visibility boosts.
- User retention and engagement metrics influence ranking, especially 30-day retention rates.
- Regular updates improve rankings, with frequently updated apps seeing up to 20% better discoverability.
- App description optimization contributes to ~10–15% ranking improvements when aligned with search intent.
- Localization increases search visibility, with translated apps gaining up to 2.5x more installs.
- Back-end signals like uninstall rates negatively affect rankings if churn exceeds 20% early usage.
- Visual assets (icons, screenshots) impact conversion rates, influencing ranking indirectly by boosting install rates.
Distribution of Google Play Store App Ratings
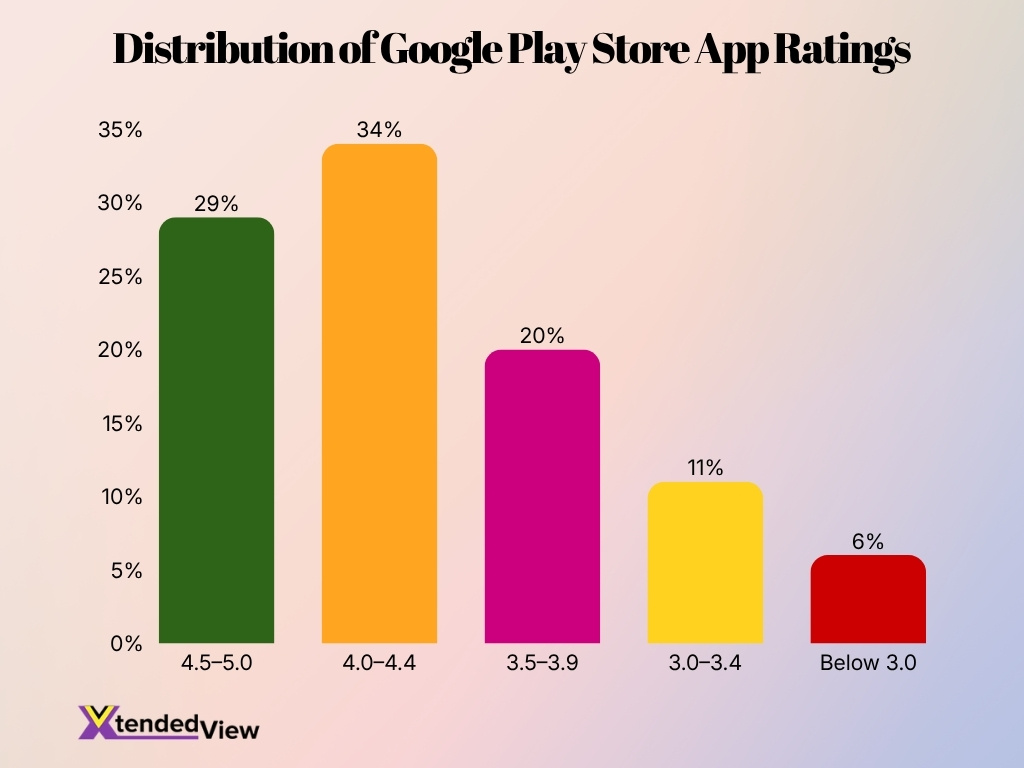
- Apps rated 4.0–4.4 hold the largest share, accounting for 34% of Google Play Store apps.
- The 4.5–5.0 rating range represents 29% of apps, showing a strong presence of highly rated apps.
- Together, apps rated 4.0 and above make up 63% of the total app ratings distribution.
- Apps rated 3.5–3.9 account for 20%, indicating a moderate-quality segment of the store.
- The 3.0–3.4 rating range represents 11% of apps, showing a smaller share of lower-rated apps.
- Apps rated below 3.0 have the lowest share at just 6%.
- The data shows that most Google Play Store apps maintain ratings above 4.0, reflecting generally positive user feedback.
- Lower-rated apps below 3.5 together account for only 17%, suggesting that poorly rated apps form a limited portion of the store.
- The highest concentration of apps falls between 4.0 and 4.4, making it the most common rating range.
- Overall, the chart highlights that Google Play Store app ratings are heavily concentrated in the upper rating bands.
Developer Earnings from Google Play Store
- The top 1% of developers generate over 80% of total revenue, highlighting market concentration.
- Google Play’s revenue share model typically allows developers to keep 70–85% of earnings, depending on program eligibility.
- Small developers earning under $1 million annually qualify for reduced service fees (15%), improving profitability.
- Subscription-based apps generate recurring monthly revenue, with retention rates driving long-term earnings.
- Indie developers contribute to over 60% of new app releases, though they capture a smaller revenue share.
- The average revenue per app remains low, with most apps earning under $1,000 annually.
- Gaming developers earn the highest returns, accounting for nearly 70% of total Play Store revenue.
- Developers using hybrid monetization models report 15–25% higher earnings than single-method approaches.
- Regional pricing strategies increase revenue potential, with localized pricing improving conversions by up to 30%.
Regional Statistics of Google Play Store
- Asia-Pacific accounts for over 50% of total downloads, making it the largest regional market.
- North America contributes over 30% of total revenue, despite having fewer downloads.
- India leads in downloads, with over 25 billion installs annually, driven by a large user base.
- The U.S. remains the #1 revenue-generating country, with high spending per user.
- Latin America shows strong growth, with downloads increasing by over 10% year-over-year.
- Europe contributes a balanced share, accounting for ~20% of global revenue.
- Africa is one of the fastest-growing regions, with smartphone adoption rising by over 15% annually.
Top Google Play Categories by App Count
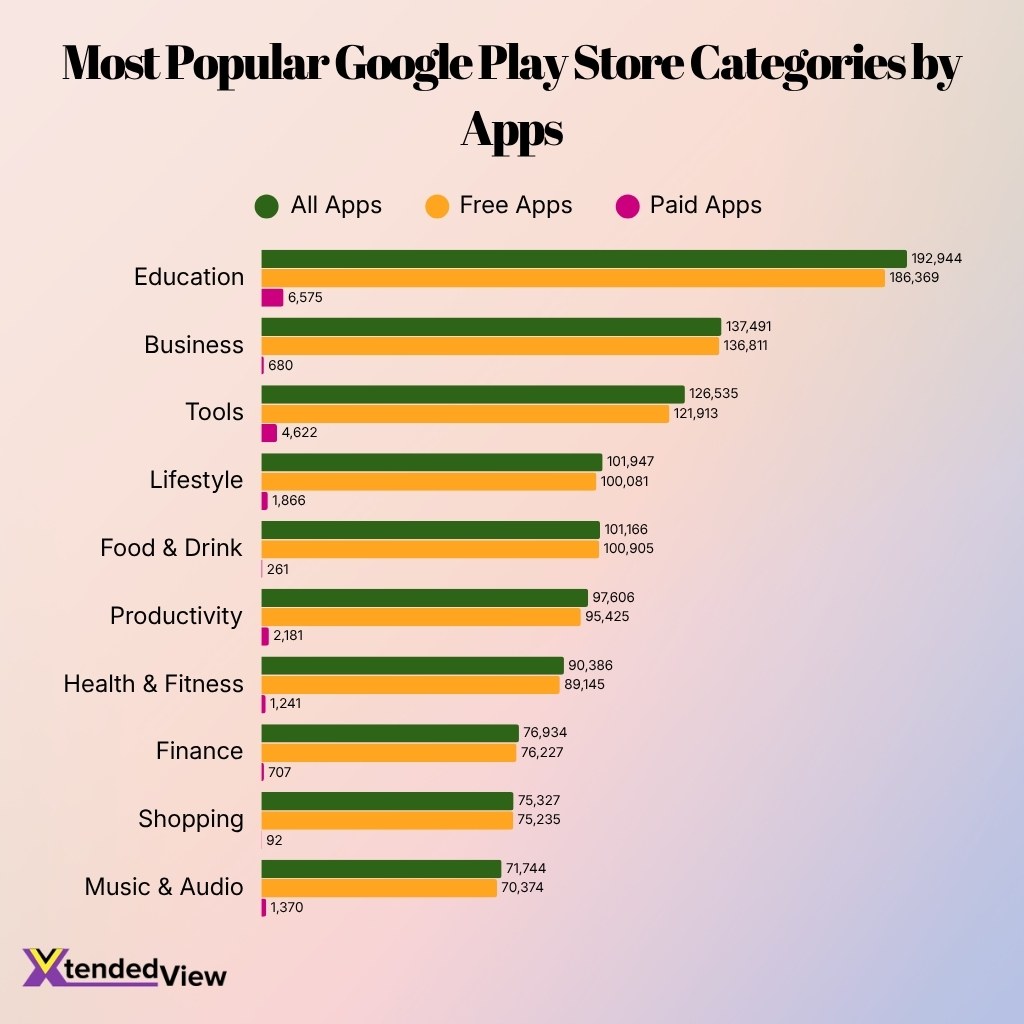
- Education leads Google Play with 192,944 apps, making it the largest category overall.
- The Education category also has the most free apps, with 186,369 free apps available.
- Business ranks second with 137,491 total apps, showing strong demand for workplace and productivity tools.
- Tools is the third-largest category, with 126,535 apps and 121,913 free apps.
- Lifestyle and Food & Drink are close in size, with 101,947 and 101,166 apps, respectively.
- Productivity has 97,606 total apps, highlighting steady interest in task management and work efficiency apps.
- Health & Fitness includes 90,386 apps, showing continued growth in wellness, workout, and tracking solutions.
- Finance has 76,934 apps, with most of them available as free apps.
- Shopping has the fewest paid apps among the top categories, with only 92 paid apps.
- Education has the highest paid app count, with 6,575 paid apps, far ahead of other categories.
- Across all top categories, free apps dominate, while paid apps make up only a small portion.
- Music & Audio ranks tenth with 71,744 total apps, including 70,374 free apps.
Frequently Asked Questions (FAQs)
As of April 2026, the Google Play Store hosts around 1.8 million apps, reflecting Google’s continued quality and policy enforcement efforts.
Google Play generated approximately $49.2 billion in revenue during 2025, representing a 13% year-over-year increase.
Google Play recorded approximately 142.2 billion app and game downloads worldwide in 2025.
The Google Play Store serves more than 2.5 billion monthly users worldwide in 2026.
About 46.8% of Google Play apps have received at least one user rating, with roughly 1.13 million rated apps out of approximately 2.41 million tracked apps.
Conclusion
The Google Play Store continues to evolve as a massive global marketplace, balancing scale with quality and monetization opportunities. While free apps dominate downloads, revenue increasingly comes from subscriptions and in-app purchases, particularly in gaming and entertainment. At the same time, stricter policies and AI-driven discovery are reshaping how users find and trust apps. For developers and businesses, these trends highlight a clear path, focus on user experience, retention, and smart monetization strategies to succeed in a competitive ecosystem.
