


Mobile applications have become one of the largest digital revenue engines in the global economy. They generate income through subscriptions, in-app purchases, advertising, and paid downloads across industries such as streaming, gaming, fintech, retail, and healthcare. Businesses use app revenue insights to refine pricing strategies, while investors rely on these metrics to evaluate growth opportunities in the digital economy. Explore the statistics below to understand how application revenue continues to evolve.
Editor’s Choice
- Global consumer spending across iOS and Google Play reached $167 billion in 2025, marking a 10.6% year-over-year increase and setting a new industry record.
- Consumers downloaded approximately 149 billion mobile apps worldwide in 2025, highlighting sustained demand despite a more mature market.
- For the first time, non-gaming apps generated more revenue than mobile games in 2025, driven by AI, streaming, productivity, and social applications.
- Revenue from non-game applications climbed to roughly $85.6 billion, overtaking mobile gaming revenue globally.
- Generative AI emerged as the fastest-growing app segment, with annual app revenue reaching $6.1 billion between Q2 2025 and Q1 2026.
- Users spent more than 5 trillion hours using mobile applications during 2025, reinforcing mobile’s central role in digital engagement.
- Industry forecasts estimate annual app store consumer spending could reach $288 billion by 2030, supported by expanding monetization models and AI-powered services.
Recent Developments
- Throughout 2025, AI-powered applications became one of the largest contributors to new mobile revenue growth worldwide.
- Generative AI app revenue increased by 232% year over year between Q2 2025 and Q1 2026.
- AI mobile applications generated more than $4.4 billion in incremental revenue during the same period.
- Revenue from non-gaming applications surpassed gaming revenue for the first time, signaling a structural shift in consumer spending.
- Sensor improvements introduced during 2025 combined multiple data pipelines to produce more accurate app revenue estimates across app stores.
- India’s mobile app market exceeded $300 million in quarterly revenue during Q1 2026, representing 33% annual growth driven largely by AI and short-form content apps.
- AI application downloads in India increased 69% during the first quarter of 2026 compared with the previous year.
- Global app publishers increasingly prioritized monetization efficiency instead of download growth, focusing on subscriptions, AI features, and higher user lifetime value.
Global Application Revenue Overview
- Worldwide consumer spending across the two leading app stores totaled $167 billion during 2025.
- Global app revenue increased 10.6% from 2024 to 2025, representing one of the strongest annual gains in recent years.
- Mobile app downloads reached approximately 149 billion worldwide in 2025.
- Consumers now spend over 3.5 hours per day using mobile apps on average, supporting continued monetization opportunities.
- More than 30 apps per user are actively used every month on average, an increase from the previous year.
- App revenue growth increasingly comes from premium digital services rather than paid downloads alone.
- Subscription services, AI assistants, streaming platforms, and productivity tools ranked among the fastest-growing revenue categories entering 2026.
- Long-term projections indicate mobile consumer spending could approach $288 billion annually by 2030 if current growth trends continue.
Mobile App Market Revenue Growth Trends
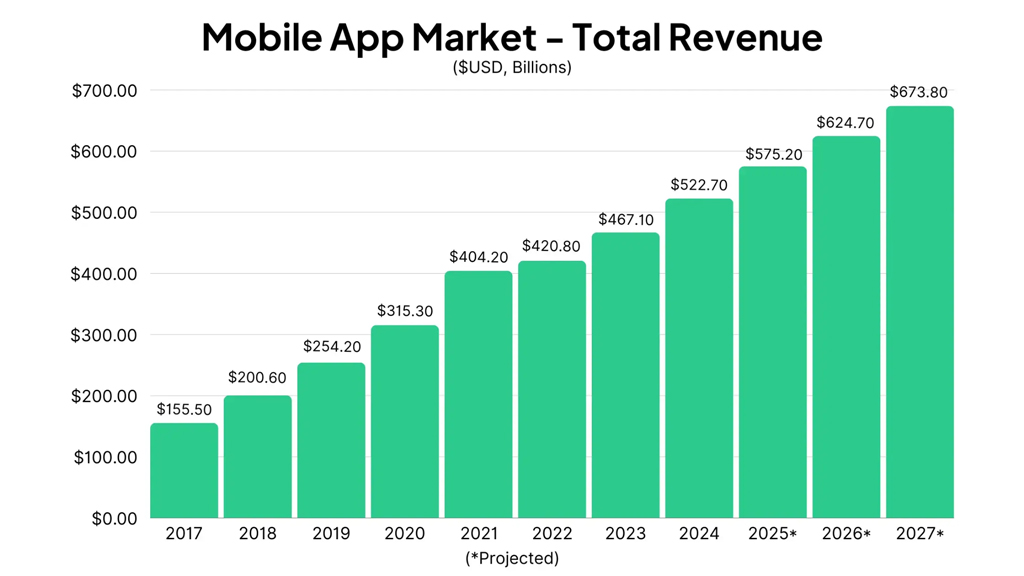
- The mobile app market revenue increased from $155.50 billion in 2017 to $522.70 billion in 2024.
- Revenue is projected to reach $673.80 billion by 2027, showing continued market expansion.
- The market is expected to grow by $151.10 billion between 2024 and 2027.
- Total revenue rose by 333.3% from 2017 to 2027, based on projected figures.
- The strongest annual jump came in 2018, when revenue grew by about 29.0%.
- Revenue crossed the $400 billion mark in 2021, reaching $404.20 billion.
- Growth slowed in 2022, with revenue increasing only 4.1% to $420.80 billion.
- The market recovered in 2023 and 2024, reaching $467.10 billion and $522.70 billion.
- Projected revenue growth remains steady, with 2025 at $575.20 billion and 2026 at $624.70 billion.
- By 2027, the mobile app market is expected to be more than 4.3 times larger than it was in 2017.
Application Revenue by Platform (iOS vs. Google Play)
- In 2025, the Apple App Store generated $117 billion in revenue compared to $49 billion from Google Play.
- iOS users spend an average of $10.40 per month on apps, while Android users spend just $1.40.
- Google Play accounted for nearly three times more downloads out of the 142 billion total apps downloaded globally in 2025.
- The Apple ecosystem captured 68% of global subscription revenue in 2025 despite its smaller global device footprint.
- In the first half of 2026, the App Store recorded $80 billion in revenue, significantly outpacing Google Play’s $36 billion.
- Subscription-based applications consistently generate 87% more revenue on iOS platforms than on their Android equivalents.
- Global consumer spending specifically on subscription apps across both platforms is estimated to surpass $200 billion in 2026.
- In-app purchases remain the leading monetization model and are expected to secure a 64.2% revenue share in 2026.
Application Revenue by Category
- Non-gaming applications generated $85.6 billion in revenue during 2025, marking a 21% increase.
- Mobile gaming revenue reached $81.8 billion in 2025 with a modest 1% year-over-year growth.
- Global in-app purchase revenue across all mobile platforms hit $167 billion in 2025.
- Consumer spending on the Apple App Store accounted for $117.6 billion during 2025.
- Google Play generated an estimated $49.2 billion in global application revenue in 2025.
- Downloads of generative AI applications reached nearly 1.7 billion in the first half of 2025.
- Users spent 37.4 billion hours on generative AI assistant apps, reflecting a 426% growth.
- Social media applications captured nearly 2.5 trillion hours of user engagement globally in 2025.
- Over-the-top streaming applications recorded more than 100 billion hours of user engagement in 2025.
Top-Grossing Apps and Publishers by Application Revenue
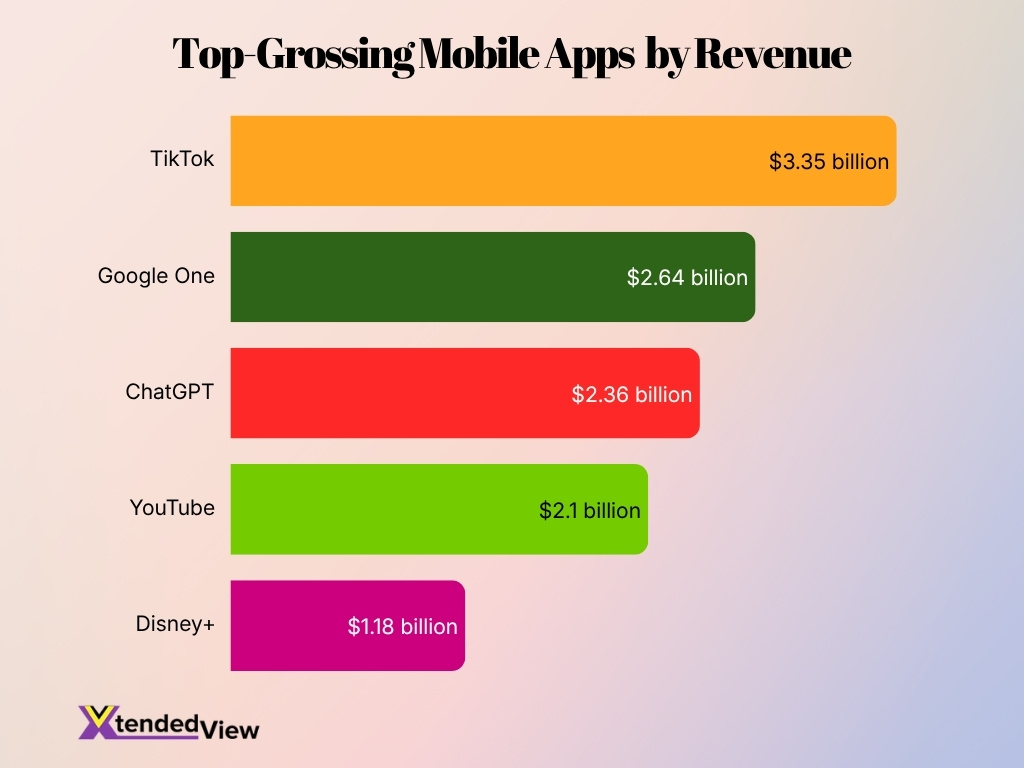
- TikTok became the highest-grossing app overall in 2025 by generating $3.35 billion in revenue.
- Google One ranked as the highest-grossing Google Play app with $2.64 billion in revenue.
- ChatGPT ranked among the highest-earning mobile apps globally with $2.36 billion in revenue.
- YouTube reached $2.1 billion to become the top-grossing app on iOS during 2025.
- Non-gaming apps surpassed games for the first time by generating $85.6 billion in 2025.
- Gaming apps generated $81.8 billion in mobile revenue with only a 1% year-over-year growth.
- The top 1% of app publishers accounted for 92.2% of all in-app purchase revenue in 2025.
- Generative AI apps alone added $3.5 billion in revenue growth between 2024 and 2025.
- Disney+ expanded its mobile revenue to reach $1.18 billion in consumer spending during 2025.
Regional Application Revenue Statistics
- The United States remained the top mobile app revenue market by generating approximately $15 billion during Q4 2025.
- India recorded 6.2 billion app downloads in Q1 2026, maintaining its rank as a leading global download market.
- India’s mobile app revenue exceeded $300 million in Q1 2026, reflecting a massive 33% year-over-year growth.
- Non-gaming apps accounted for roughly 72% of India’s total app downloads during the first quarter of 2026.
- Asia Pacific dominated the global mobile application market with a commanding revenue share of 34.9% in 2025.
- The United States mobile market is projected to reach an estimated $69.63 billion in total application revenue by 2026.
- Europe holds the third-largest share of the global app market and is projected to generate $42.36 billion by 2026.
- China is expected to lead global Android consumer spending, with projections reaching $48.4 billion by the year 2030.
- The Middle East GCC countries are projected to account for $3.89 billion in app revenue fueled by digital innovation.
- Latin America experienced massive digital growth with a 76% year-over-year boost in finance app installs during 2025.
Application Revenue Growth Trends and CAGR
- Global app consumer spending increased 10.6% year over year during 2025, marking one of the strongest annual growth rates since the pandemic.
- Generative AI applications achieved 232% annual revenue growth between Q2 2025 and Q1 2026.
- AI applications contributed more than $4.4 billion in incremental consumer spending over the same period.
- Industry forecasts suggest total mobile consumer spending could reach approximately $288 billion by 2030, reflecting sustained long-term expansion.
- Subscription-based applications continue growing faster than paid-download business models across most software categories.
- Enterprise productivity and AI assistant apps posted some of the highest multi-year revenue growth rates entering 2026.
- Developers increasingly focus on lifetime value (LTV) and recurring revenue instead of download volume alone.
- Revenue growth increasingly depends on premium digital services, personalization, and AI-powered features rather than one-time purchases.
Top Grossing Apps by Category Revenue Insights
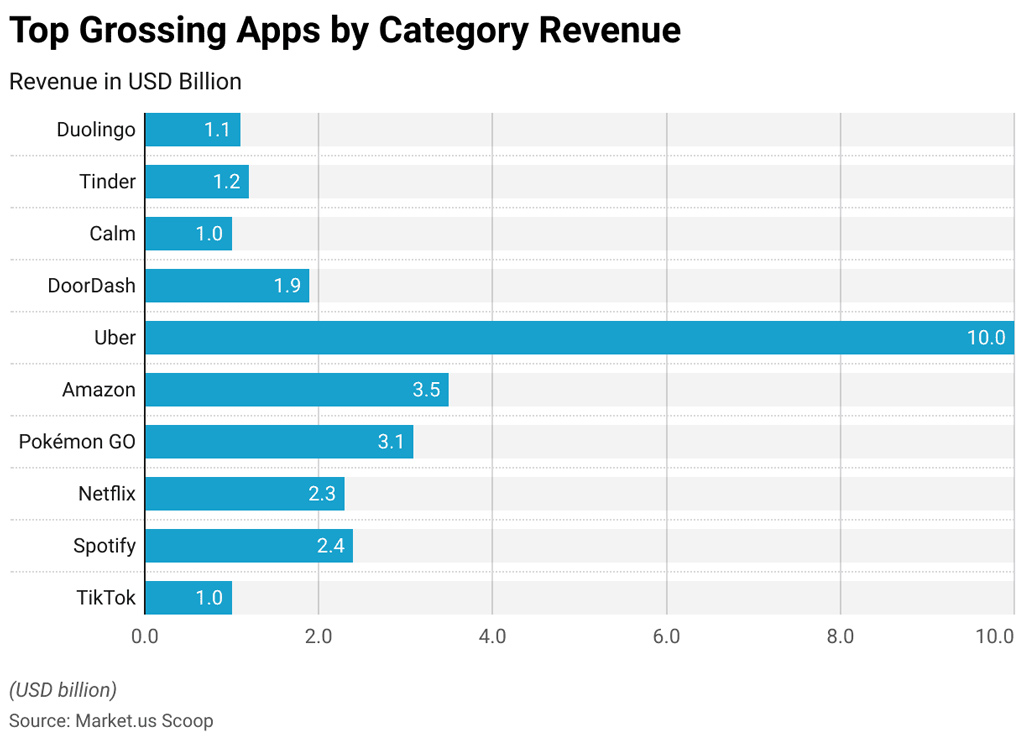
- Uber leads the chart with the highest revenue at $10.0 billion.
- Amazon ranks second with $3.5 billion in category revenue.
- Pokémon GO follows closely with $3.1 billion, showing strong gaming revenue.
- Spotify generated $2.4 billion, slightly ahead of Netflix at $2.3 billion.
- DoorDash earned $1.9 billion, making it the top food delivery app in the list.
- Tinder reported $1.2 billion, leading among dating apps shown.
- Duolingo generated $1.1 billion, reflecting strong demand for learning apps.
- Calm and TikTok recorded the lowest revenue at $1.0 billion each.
- The revenue gap between Uber and Amazon is $6.5 billion.
- The chart shows that mobility, shopping, gaming, and streaming apps dominate top-grossing app revenue.
In-App Purchase (IAP) Application Revenue and Spending Statistics
- Revenue from in-app purchases and paid apps reached $167 billion across iOS and Google Play during 2025.
- In-app purchases generated approximately 62% of total app store revenue, making them the industry’s largest monetization source.
- AI applications generated approximately $6.1 billion in annualized in-app purchase revenue between Q2 2025 and Q1 2026.
- Global AI app in-app purchase revenue is projected to exceed $4 billion during the first half of 2026.
- Digital subscriptions, virtual goods, premium AI tools, and creator features drove much of the recent IAP growth.
- Mobile gaming continues generating billions of dollars annually through cosmetic purchases, battle passes, and seasonal content.
- Publishers increasingly use personalized purchase offers to improve conversion and customer lifetime value.
- Premium utility applications increasingly rely on in-app purchases instead of charging upfront download fees.
In-App Advertising and Application Revenue Statistics
- The global in-app advertising market reached $220.05 billion in 2025 with rapid, continuous expansion.
- Video advertisements captured approximately 38% of total in-app ad revenues globally during 2025.
- Gaming applications accounted for the largest category by generating over 28% of all in-app advertising revenues.
- Global consumer spending on mobile applications reached an estimated $167 billion through in-app purchases in 2025.
- The Android platform accounted for a dominant 57.4% share of all in-app advertising revenues worldwide.
- Programmatic ad buying represented 74.6% of total in-app advertising transactions completed in 2025.
- Mobile users globally spent over 5.3 trillion hours engaging with mobile apps throughout 2025.
- Hybrid monetization strategies delivered a remarkable 146% return on ad spend by Day 90 for mobile games.
Revenue Per Download and Application ARPU Statistics
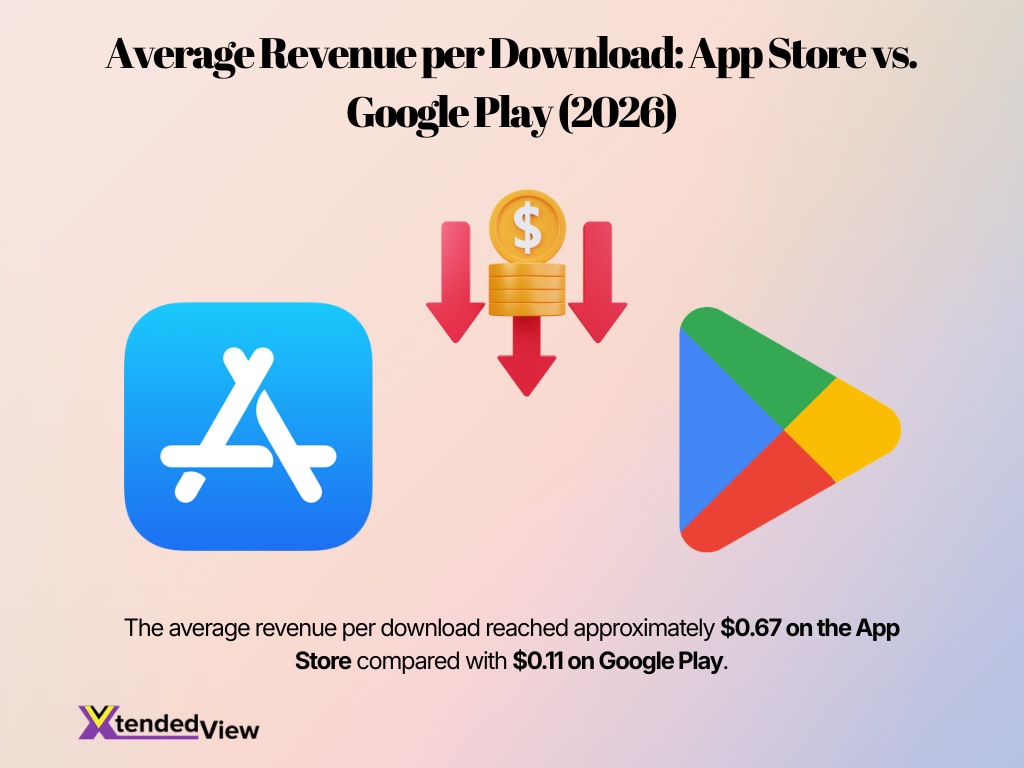
- The average revenue per download reached approximately $0.67 on the App Store compared with $0.11 on Google Play.
- Premium iOS users continue generating significantly higher average revenue per user (ARPU) than Android users.
- AI applications recorded some of the fastest improvements in mobile ARPU during 2025 and 2026.
- One leading AI assistant increased its U.S. mobile ARPU from less than $0.50 in September 2025 to $2.76 by May 2026.
- Subscription-based applications consistently outperform ad-supported apps in ARPU across productivity categories.
- Publishers increasingly optimize pricing and personalization to improve ARPU over relying solely on new installs.
- Higher user engagement continues to correlate with stronger revenue per download across entertainment applications.
- AI-powered premium services are actively reshaping ARPU benchmarks throughout the entire mobile app economy.
Subscription and One-Time Purchase Application Revenue
- Global mobile app subscription revenue reached an estimated $147 billion in 2025.
- Weekly subscriptions now generate 55.5% of all in-app subscription revenue in 2026.
- One-time paid downloads and lifetime purchases account for only 10.3% of total app monetization revenue.
- Overall in-app purchase revenue grew to $167 billion in 2025, marking a 10.6% increase.
- Subscription-based models have grown 435% over the last decade compared to traditional purchase models.
- Weekly plans with a free trial produce the highest 12-month customer lifetime value at $49.27.
- Applications utilizing hard paywalls generate 21% higher lifetime value than soft paywall models.
- High-tier annual subscriptions earn up to 4.5 times more per user in the health and fitness category.
- Top-performing subscription apps grew their monthly recurring revenue by over 80% in 2026.
- Productivity applications derive 65% of their total revenue exclusively from recurring weekly plans.
User Retention and Engagement Impact on Application Revenue
- Global users spent 5.3 trillion hours across mobile applications during 2025.
- Consumers now average over 3.5 hours per day using mobile applications globally.
- App users consistently generate 3.5 to 7 times more revenue than mobile web visitors.
- Increasing customer retention by just 5% can boost overall app profits by 25% to 95%.
- Automated push notifications help applications recover up to 22% of abandoned shopping carts.
- The cost of acquiring a new app user is 4 to 5 times greater than retaining an existing one.
- The global mobile application market size reached a valuation of $285.7 billion in 2025.
- Cross-category day-one app retention averages 25%, but drops to 6% by day thirty.
- In-app purchase revenue from non-gaming apps exceeded $20.9 billion in a single quarter of 2025.
Application Revenue by Monetization Model
- Freemium models accounted for over 90% of total app downloads in 2025.
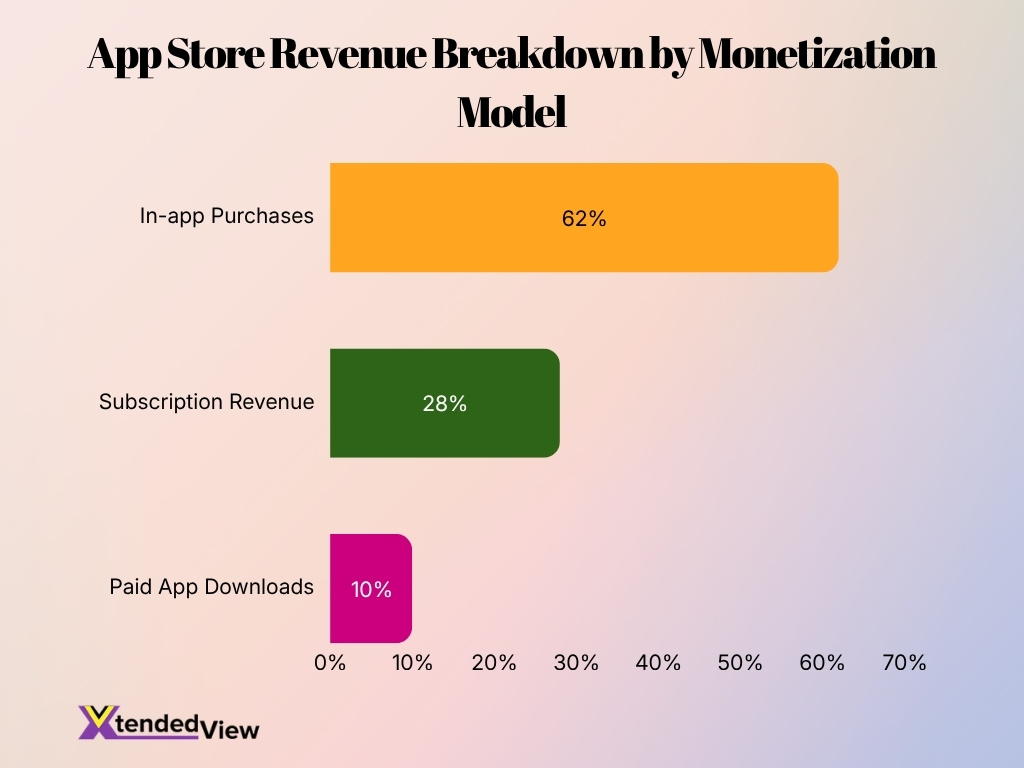
- In-app purchases generated approximately 62% of total app store revenue.
- Subscription revenue represented roughly 28% of global consumer spending.
- Paid app downloads contributed only 10% to overall industry monetization.
- In-app advertising drove revenue for over 70% of free gaming and utility apps.
- Hybrid monetization models were adopted by more than 65% of top-grossing applications.
- AI-powered applications increased their recurring revenue by 40% through usage-based pricing.
- Customer lifetime value (LTV) strategies improved long-term app monetization by 35%.
App Store Fees and Their Impact on Application Revenue
- Standard platform commission rates strictly take up to 30% of an application’s gross digital transaction revenue.
- Apple and Google dramatically reduce their fee to 15% for small developers earning under $1 million annually.
- The global App Store ecosystem successfully generated over $1.4 trillion in total developer billings and sales in 2025.
- Platform commission on auto-renewing subscriptions permanently drops from 30% to 15% after a subscriber completes 12 consecutive months.
- Recent EU marketplace regulations officially introduced a 5% Core Technology Commission for alternative digital app distribution.
- Processing external web-based payments instead of in-app purchases can heavily reduce transaction costs to just 2% to 5%.
- Nearly 88% of active developers in regulated European markets currently pay no platform commission under new alternative terms.
- Bypassing the standard 30% fee on a $200k monthly recurring revenue application can save publishers approximately $528k annually.
Future Application Revenue Forecasts and Emerging Revenue Drivers
- Global app consumer spending is projected to surpass $626 billion by 2030, assuming current mobile market growth trends continue.
- The AI app market is forecasted to skyrocket to $135.93 billion by 2035, making it the fastest-growing software category at a 38.51% CAGR.
- Subscription revenue and in-app purchases are driving the global mobile application market toward an expected $565.40 billion valuation by 2030.
- The enterprise mobile app market is projected to reach $141.54 billion by 2030, fueled by hybrid work and AI-assisted workflows.
- Mobile banking apps drive sustained fintech growth by accounting for 65% of global financial transactions, with users engaging 12 times daily.
- Telemedicine app downloads are projected to grow by 28% annually as healthcare applications expand premium remote monitoring services.
- The integration of generative AI features will help drive the global generative AI market from $83.3 billion in 2026 to $988.4 billion by 2035.
- AI-enabled smartphones utilizing on-device computing are expected to account for more than 70% of global smartphone shipments by 2027.
Methodology and Data Sources
- The global mobile application market was valued at $298.40 billion in 2025 and is projected to reach $330.02 billion in 2026.
- The Apple App Store ecosystem facilitated nearly $1.3 trillion in total global billings and sales during 2024.
- Global consumer spending on the Apple App Store reached $117.6 billion in 2025 compared to $49.2 billion on Google Play.
- Approximately 142.2 billion applications and games were downloaded worldwide across major mobile platforms in 2025.
- In-app purchases accounted for a dominant 64.2% of the monetization market share and reached $167 billion globally in 2025.
- The global average daily time spent by consumers using mobile applications increased to 3.6 hours per user in 2025.
- Subscription models generated over 95% of all direct consumer app revenues across major global platforms in 2025.
- Gaming applications captured 56% of all app revenue by generating $150 billion globally during 2025.
Frequently Asked Questions (FAQs)
Mobile apps generated $167 billion in consumer spending across iOS and Google Play in 2025, up 10.6% year over year.
The global mobile application market is projected to reach $322.6 billion in 2026 and grow to $885.3 billion by 2033 at a 15.5% CAGR.
Non-gaming apps generated $85.6 billion in 2025, surpassing mobile games at $81.8 billion for the first time.
Generative AI app revenue grew 232% year over year between Q2 2025 and Q1 2026, adding more than $4.4 billion in incremental spending.
In-app spending through app stores is forecast to reach $288 billion in 2030, with nearly 2.9 trillion app and game downloads expected from 2021 to 2030.
Conclusion
Application revenue continued reaching new milestones, driven by subscriptions, AI-powered experiences, and expanding in-app purchase ecosystems. While mobile gaming remains a major contributor, non-gaming applications now account for an even larger share of consumer spending, reflecting changing user preferences and broader digital adoption.
Looking ahead, recurring revenue models, personalized AI services, and stronger user engagement are expected to shape the next phase of app monetization. As developers focus on retention, lifetime value, and diversified monetization strategies, the mobile application economy appears well positioned for sustained long-term growth across both established and emerging markets.
