Mobile apps continue to shape how people shop, bank, learn, work, and stay entertained. Businesses rely on mobile apps to increase customer engagement, while industries such as healthcare, retail, fintech, and transportation use them to deliver faster digital services and personalized experiences. As AI-powered features, subscription models, and mobile commerce continue to expand, the app economy keeps creating new opportunities for developers and brands alike. Explore the statistics below to understand how the mobile app industry is evolving.
Editor’s Choice
- The global app market is projected to generate $739.61 billion in revenue during 2026.
- Worldwide app downloads are forecast to reach 528.48 billion in 2026.
- Consumers spent $167 billion on in-app purchases across iOS and Google Play during 2025, up 10.6% year over year.
- Global users spent 5.3 trillion hours using mobile apps in 2025, the highest level recorded to date.
- Total unique app downloads climbed to nearly 150 billion in 2025, marking a 0.8% annual increase.
- The United States is expected to generate $317.39 billion in app revenue during 2026, making it the world’s largest market.
- Revenue from non-gaming apps exceeded gaming apps for the first time in 2025, driven by AI applications and subscription-based services.
Recent Developments
- Generative AI became one of the fastest-growing mobile categories during 2025, with downloads reaching 3.8 billion, more than double the previous year.
- Spending on AI-powered mobile apps surpassed $5 billion during 2025, nearly tripling year over year.
- Users spent 48 billion hours in generative AI apps during 2025, approximately 3.6 times higher than in 2024.
- AI app sessions crossed 1 trillion globally in 2025, showing stronger engagement rather than simple download growth.
- Global consumer spending on apps reached $150 billion during 2024, representing 13% annual growth before increasing further in 2025.
- Total mobile usage reached 4.2 trillion hours during 2024, increasing 5.8% from the previous year.
- Short-drama apps recorded 278% year-over-year download growth during 2025, making them one of the fastest-expanding content categories.
- AI app downloads increased 148% globally during 2025, highlighting rapid consumer adoption.
- Non-gaming app revenue grew 21% year over year in 2025, largely because of AI services and premium subscription offerings.
Mobile Application Market Growth
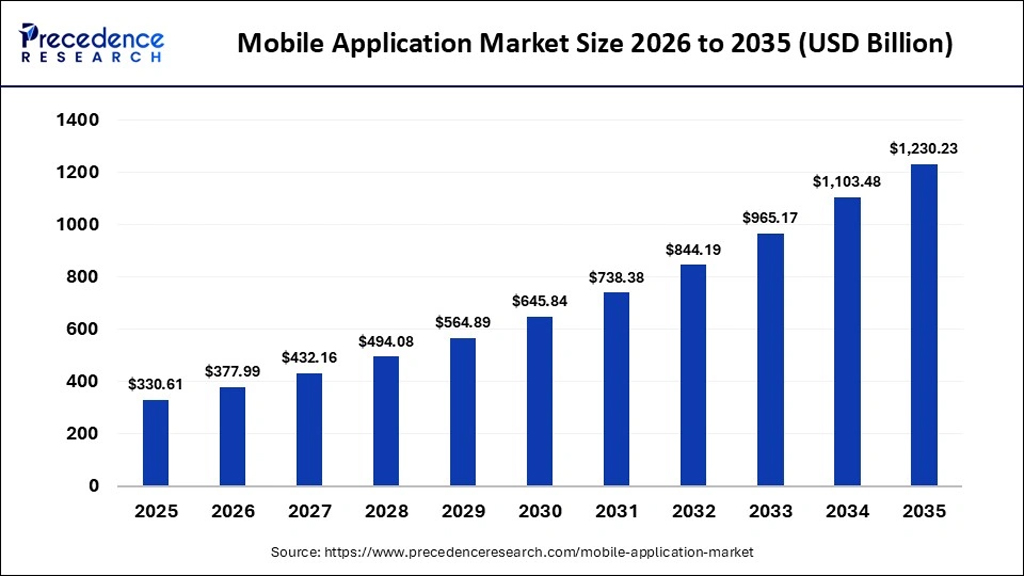
- The global mobile application market is projected to grow from $330.61 billion in 2025 to $1.23 trillion by 2035.
- The market is expected to exceed $500 billion by 2029, reaching approximately $564.89 billion.
- By 2030, the mobile application market could reach $645.84 billion, nearly doubling from its 2025 value.
- Market size is forecast to rise to $738.38 billion in 2031 and $844.19 billion in 2032.
- The industry is expected to approach the $1 trillion milestone in 2033, with a projected value of $965.17 billion.
- In 2034, the market is forecast to surpass $1 trillion, reaching approximately $1.10 trillion.
- Between 2025 and 2035, the market is projected to increase by nearly $899.62 billion.
- Overall, the mobile application market is expected to expand by approximately 272% over the ten-year forecast period.
Mobile App Downloads Statistics
- Worldwide mobile app downloads reached nearly 150 billion unique installs during 2025.
- Global downloads increased 0.8% year over year in 2025, reversing the slight decline recorded during 2024.
- During 2024, worldwide app downloads totaled approximately 136 billion, a 1% decrease from the previous year.
- The global app market is projected to record 528.48 billion downloads during 2026 when all download activity is included under broader market methodology.
- AI application downloads more than doubled during 2025, reaching approximately 3.8 billion.
- Short-drama applications experienced 278% annual download growth in 2025.
- India remained one of the world’s largest download markets, recording 6.2 billion app downloads during Q1 2026 alone.
- Non-gaming apps represented 72% of India’s downloads in Q1 2026, reflecting continued diversification beyond mobile games.
- Download growth increasingly comes from AI, productivity, short-video, shopping, and finance apps rather than traditional gaming alone.
Mobile App Usage Time Statistics
- Consumers spent a record 5.3 trillion hours using mobile apps during 2025.
- Global mobile users averaged approximately 3.6 hours per day inside apps during 2025.
- Total app usage time increased 3.8% year over year between 2024 and 2025.
- During 2024, users spent 4.2 trillion hours on mobile applications worldwide.
- Time spent in Generative AI apps reached 48 billion hours during 2025.
- AI app engagement grew roughly 3.6 times compared with 2024.
- AI app session volume exceeded 1 trillion sessions during 2025, indicating strong repeat usage.
- In India, users averaged 3.4 hours per day across mobile apps during 2025.
- Indian smartphone users interacted with an average of 23 apps per month and 8 unique apps per day during 2025, illustrating increasingly diversified app engagement.
Global Mobile App Revenue
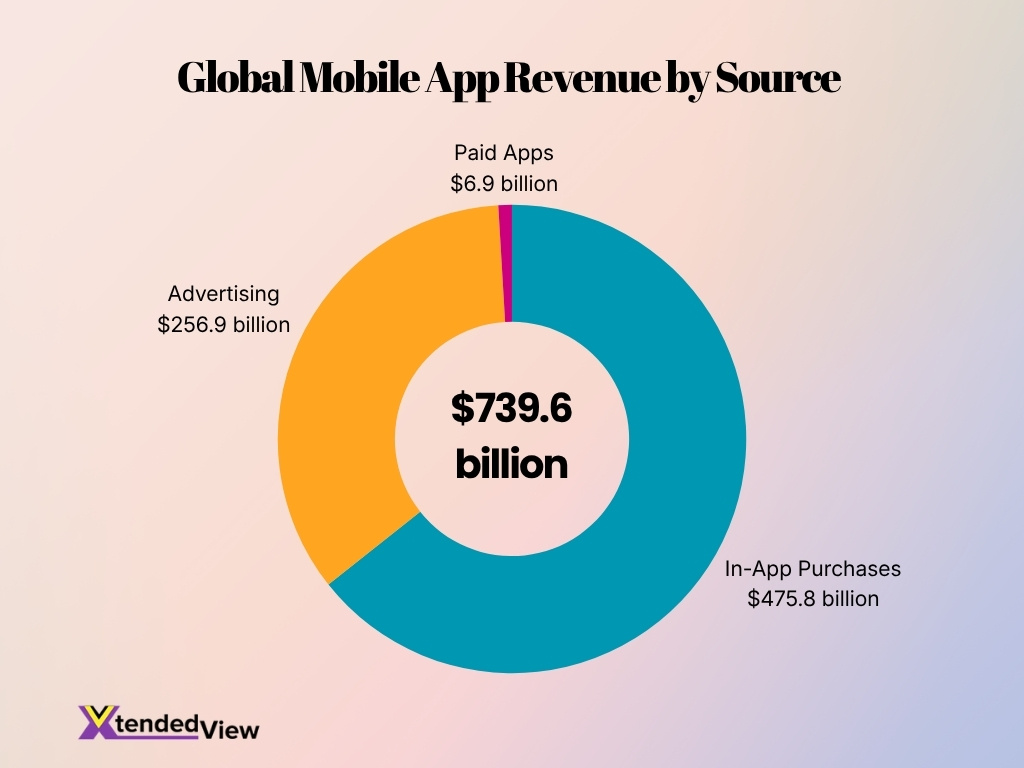
- Global mobile app revenue is projected to reach $739.6 billion in 2026, reflecting the industry’s enormous monetization potential.
- In-app purchases generate the largest share of revenue at $475.8 billion, accounting for approximately 64.3% of the total market.
- Mobile advertising contributes $256.9 billion, representing nearly 34.7% of global app revenue.
- Revenue from paid app downloads remains comparatively small at just $6.9 billion, or approximately 0.9% of the total.
- In-app purchases generate almost 1.9 times more revenue than mobile advertising, highlighting the importance of subscriptions, premium features, and virtual goods.
- Combined, in-app purchases and advertising account for more than 99% of total mobile app revenue, showing that free-to-download monetization models dominate the market.
- The limited contribution from paid apps suggests that consumers increasingly prefer free apps with optional purchases or advertisements rather than paying upfront.
Mobile App User Behavior Statistics
- Global app installs increased 10% in 2025, while app sessions rose 7%.
- Mobile platforms drove 60% to 80% of activity across cross-platform customer journeys in 2025.
- Gaming journeys saw 79% of final activity on mobile and PC, but only 8% on consoles.
- An average app retained 26% of users on Day 1, 13% on Day 7, and 10% on Day 14.
- iOS apps achieved a 27% Day 1 retention rate, compared to 24% for Android apps.
- Marketplace apps recorded a 25% Day 1 retention rate, indicating 75% of new users did not return.
- Travel apps boosted their Day 1 organic retention from 17% in 2024 to 18% in 2025.
- Purchases per paying travel-app user grew 13%, increasing from 1.89 in 2024 to 2.13 in 2025.
- Over 50% of marketing teams increased collaboration with data analytics in 2025 to measure journeys.
Mobile App Monetization Trends
- Global app marketing investment reached $109 billion in 2025, including acquisition and remarketing spending.
- User acquisition accounted for $78 billion of that total, while remarketing contributed $31 billion.
- Remarketing represented 29% of combined acquisition and remarketing budgets in 2025, up from 25% in 2024.
- In-app advertising generated 57% of its Day 60 revenue during the first day after installation.
- By Day 7, in-app advertising had produced 89% of the revenue it would generate by Day 60.
- In-app purchases generated 60% of their Day 60 revenue by Day 7, while subscription revenue reached only 52%.
- Hypercasual games earned 63% of their Day 60 advertising revenue on Day 1, reflecting their short user life cycles.
- Paid installs generated 59% of gaming in-app purchase revenue, compared with 30% of non-gaming subscription revenue.
- Organic users produced 70% of non-gaming subscription revenue, highlighting the value of brand searches, referrals and unpaid discovery.
App Engagement by Category
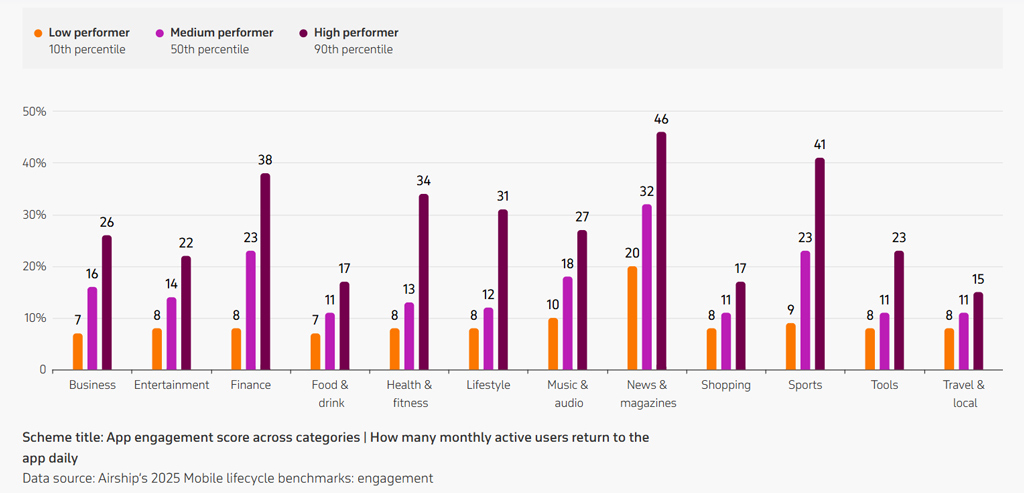
- News and magazines apps record the strongest engagement across every benchmark, with daily return rates of 20% for low performers, 32% for medium performers, and 46% for high performers.
- Sports apps rank second among high performers, reaching a 41% daily return rate, compared with 23% for medium performers and 9% for low performers.
- Finance apps also demonstrate strong user loyalty, with high-performing apps retaining 38% of monthly active users daily, substantially above the 23% median benchmark.
- Health and fitness apps show one of the widest performance gaps, rising from 8% among low performers to 34% among high performers.
- Lifestyle apps follow a similar pattern, with daily engagement increasing from 8% at the 10th percentile to 31% at the 90th percentile.
- Music and audio apps maintain relatively balanced engagement, ranging from 10% for low performers to 27% for high performers.
- Business apps achieve a high-performer engagement rate of 26%, while medium and low performers register 16% and 7%, respectively.
- Tools apps reach 23% engagement among high performers, more than double the 11% median rate and nearly triple the 8% low-performer rate.
- Entertainment apps report daily return rates of 8%, 14%, and 22% across the low, medium, and high-performance groups.
- Food and drink and shopping apps share identical medium and high-performer benchmarks of 11% and 17%, although low performers stand at 7% and 8%, respectively.
- Travel and local apps record the lowest high-performer benchmark at 15%, indicating comparatively weaker daily usage frequency.
- Across nearly every category, high-performing apps achieve two to four times the daily engagement rate of low-performing apps, highlighting the importance of retention-focused product and messaging strategies.
Mobile App Category Trends
- Finance app installs increased 27% in 2024, while sessions grew 24% and average revenue per monthly active user reached $4.10.
- Global finance app installs rose another 11% through the third quarter of 2025, while sessions increased 16%.
- Crypto app installs increased 90% year over year through the third quarter of 2025, leading finance subcategories.
- Payment app installs grew 4% during the same period, showing slower but steadier expansion than crypto apps.
- E-commerce app installs rose 17% in 2024, while sessions increased 13%.
- Shopping-app marketing spending increased 70% in 2025, including a 123% rise on iOS.
- Gaming app installs rose 4% in 2024, with strategy-game installs increasing 83%.
- Casual-game installs increased 19% in 2025, while average session length grew 15% to 25.92 minutes.
- Strategy-game sessions increased 57% in 2025, while hypercasual games generated 29% of all gaming installs.
- Mobile game downloads reached 50 billion in 2025, despite a 7% year-over-year decline.
App Store vs Google Play Statistics
- The App Store generated approximately $117 billion in 2025, compared with $49 billion for Google Play.
- In 2024, the two platforms generated $103.4 billion and $46.7 billion, respectively.
- App Store revenue increased by roughly 13% between 2024 and 2025, while Google Play revenue rose by about 5%.
- Google Play recorded approximately 108.9 billion installs in 2025, compared with 47.4 billion on the App Store.
- Google Play generated about 2.3 times as many installs as the App Store in 2025.
- The App Store offered about 2.49 million apps in the latest available catalog count.
- Google Play offered about 2.47 million free and paid apps in the same catalog comparison.
- iOS user acquisition spending increased 35% in 2025, while Android spending declined by 1%.
- Paid iOS installs increased 31% in the U.S., 64% in the U.K., and 80% in Canada during 2025.
Free vs Paid Apps Statistics
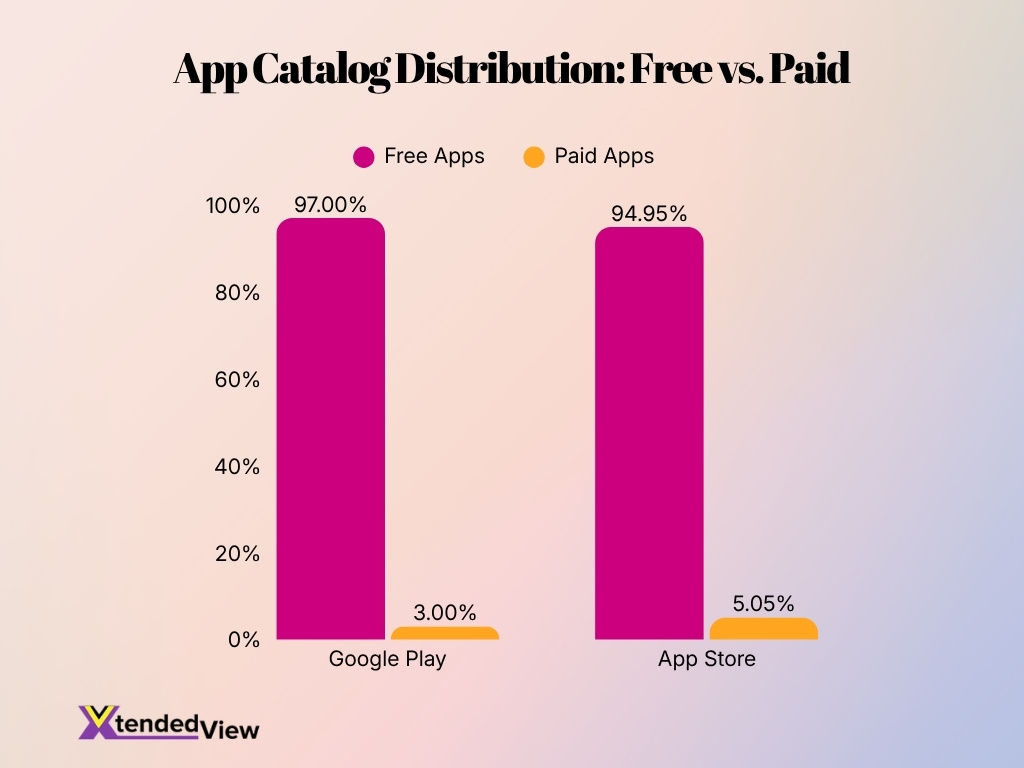
- Free apps represented 94.95% of the App Store catalog in the latest available count.
- Paid apps accounted for only 5.05% of App Store listings.
- The App Store contained about 2.37 million free apps and approximately 125,800 paid apps.
- Google Play contained about 2.40 million free apps and roughly 72,400 paid apps.
- Free apps represented approximately 97% of Google Play listings in early 2025, leaving about 3% as paid downloads.
- Google Play offered roughly 1.7 times as many free apps as paid apps for every paid App Store listing when comparing catalog totals.
- Paid apps formed a larger share of the App Store catalog than of Google Play, at about 5% versus 3%.
- Free-to-download models still generated revenue through advertising, subscriptions, and in-app purchases, rather than relying on an upfront price.
- The dominance of free listings supports a broader industry shift toward recurring and usage-based monetization instead of one-time app purchases.
Mobile App Advertising Statistics
- Global user acquisition spending reached $78 billion in 2025, an increase of 13% from the previous year.
- Non-gaming acquisition spending rose 18% to $53 billion, while gaming spending increased 3% to $25 billion.
- Remarketing spending increased 37% year over year to $31.3 billion in 2025.
- iOS remarketing spending climbed 71% to $17 billion, compared with 10% growth and $14 billion on Android.
- About 57% of app marketers used technical AI agents in 2025, while 32% used optimization agents to manage campaigns.
- Among marketers’ AI-related analytical requests, 38% focused on efficiency and spending, compared with 22% focused on volume.
- A large-scale advertising experiment found that every $100 in mobile ad spending produced 37 paid installs and three additional organic installs.
- Organic spillover made mobile install advertising about 7.5% more effective than paid-install measurements alone suggested.
- Global App Tracking Transparency opt-in rates reached 35% by the first quarter of 2025, expanding the pool of measurable iOS users.
- Seventy-four percent of surveyed app marketers named improved return on ad spending or return on investment as a key reason for engaging new advertising partners.
App Subscription and In-App Purchase Statistics
- A 2026 subscription benchmark analyzed more than 115,000 apps, $16 billion in revenue, and over 1 billion transactions, using performance data collected mainly during 2025.
- Nearly 15,000 new subscription apps launched per month by early 2026, compared with about 2,000 per month in early 2022.
- iOS accounted for roughly 77% of new subscription app launches in early 2026, up from about 67% in 2023.
- Trials lasting 17 to 32 days achieved a median 42.5% trial-to-paid conversion rate in 2025, compared with 25.5% for trials shorter than four days.
- Despite stronger conversion from longer trials, the share of apps offering trials of four days or less increased from 42.1% in 2025 to 46.5% in 2026.
- Travel apps recorded a median trial-to-paid conversion rate of 48.7% in the 2025 benchmark, the highest among the measured categories.
- Media and entertainment apps converted 43.8% of trials into paid subscriptions, while health and fitness apps recorded a 39.9% median rate.
- The top 10% of health and fitness subscription apps converted 68.3% of trials, showing the performance gap between average and leading products.
- Hard-paywall apps achieved a median download-to-paid conversion rate of 12.11%, compared with 2.18% for freemium apps.
- Nearly 31% of subscription cancellations on Google Play resulted from billing failures, compared with 14% on the App Store.
Mobile App Retention and Churn Statistics
- More than 1 in 2 installed apps were removed within 30 days in the latest uninstall benchmark study.
- The Android uninstall rate improved slightly from 46.9% in 2023 to 46.1% in 2024, but churn remained high.
- Average retention across app categories fell from about 25% on Day 1 to 6% by Day 30.
- Broader global benchmarks placed Day 30 retention at 7%, down from 26% on Day 1.
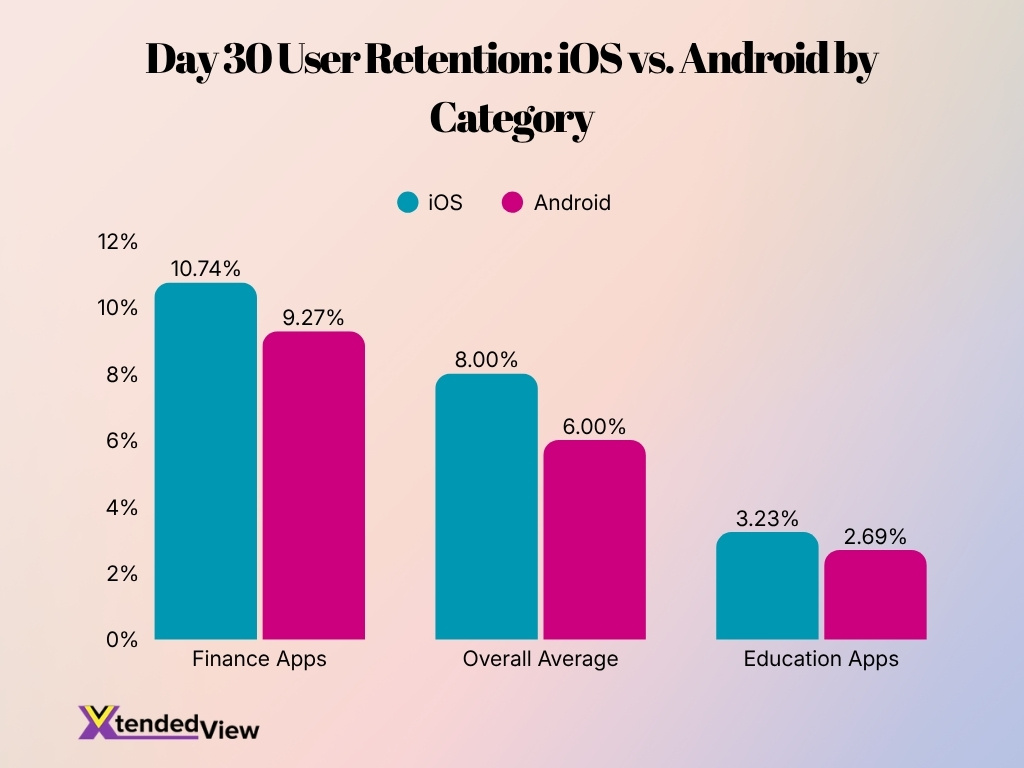
- Android retention declined from 24% on Day 1 to 6% on Day 30.
- iOS retention fell from 27% on Day 1 to 8% on Day 30, giving iOS a 2-percentage-point advantage at the end of the month.
- Finance apps retained 10.74% of iOS users by Day 30, compared with 9.27% of Android users.
- Education apps posted Day 30 retention of only 3.23% on iOS and 2.69% on Android.
- Travel and news apps recorded comparatively low Android uninstall rates of 29.2% and 27.3%, respectively.
App Install and User Acquisition Trends
- Global spending on app user acquisition reached $78 billion in 2025, increasing 13% from 2024.
- Non-gaming apps attracted $53 billion in acquisition spending, up 18% year over year, while gaming apps received $25 billion.
- Gaming user acquisition spending grew only 3% in 2025, indicating non-gaming categories drove market expansion.
- iOS acquisition spending increased 35% in 2025, while Android spending declined by 1%.
- Paid iOS installs increased 31% in the United States, 64% in the United Kingdom, and 80% in Canada during 2025.
- Android paid installs rose 8% in the United States and 1% in the United Kingdom but fell 9% in Australia.
- Shopping-app acquisition spending increased 70% overall and 123% on iOS during 2025.
- Remarketing spending reached $31.3 billion in 2025, rising 37% year over year as companies targeted existing users.
- Remarketing represented 29% of combined acquisition budgets in 2025, up from 25% in 2024.
- Every $100 in mobile advertising generated 37 paid installs and three organic installs, increasing total impact by 7.5%.
App Store Optimization Statistics
- The average Google Play product-page-to-install conversion rate reached approximately 33.7% in a 2025 industry benchmark.
- The comparable App Store product-page-to-install conversion rate averaged about 26.4%.
- App Store impressions converted directly into installs at an average rate of roughly 3.6%, illustrating the difference between visibility and product-page intent.
- A separate U.S. benchmark placed average conversion at 25% on the App Store and 27.3% on Google Play during the first half of 2024.
- Business apps achieved conversion rates as high as 66.7% in the same category-level comparison.
- Some game subcategories converted close to 1.2%, showing that category context can produce major differences in store-page performance.
- Store analytics distinguish first-time downloads from redownloads, helping developers measure new-user acquisition separately from returning-device activity.
- Developers can analyze downloads by territory, device, and discovery source, which supports more precise localization and keyword decisions.
- Custom product pages gained keyword support in 2025, allowing developers to connect specific search terms with more relevant store-page experiences.
- Store listing tools also added review summaries, updated age ratings, and accessibility information in 2025, increasing the number of elements that can influence discovery and conversion.
Regional Mobile App Statistics
- Asia-Pacific accounted for approximately 34.9% of global mobile app revenue in 2025.
- An alternative market model estimated Asia-Pacific’s share at 52.92% in 2025 depending on included services.
- The United States controlled about 42% of worldwide app user acquisition spending in 2025.
- U.S. iOS acquisition spending grew by 25% in 2025 despite a massive existing global budget share.
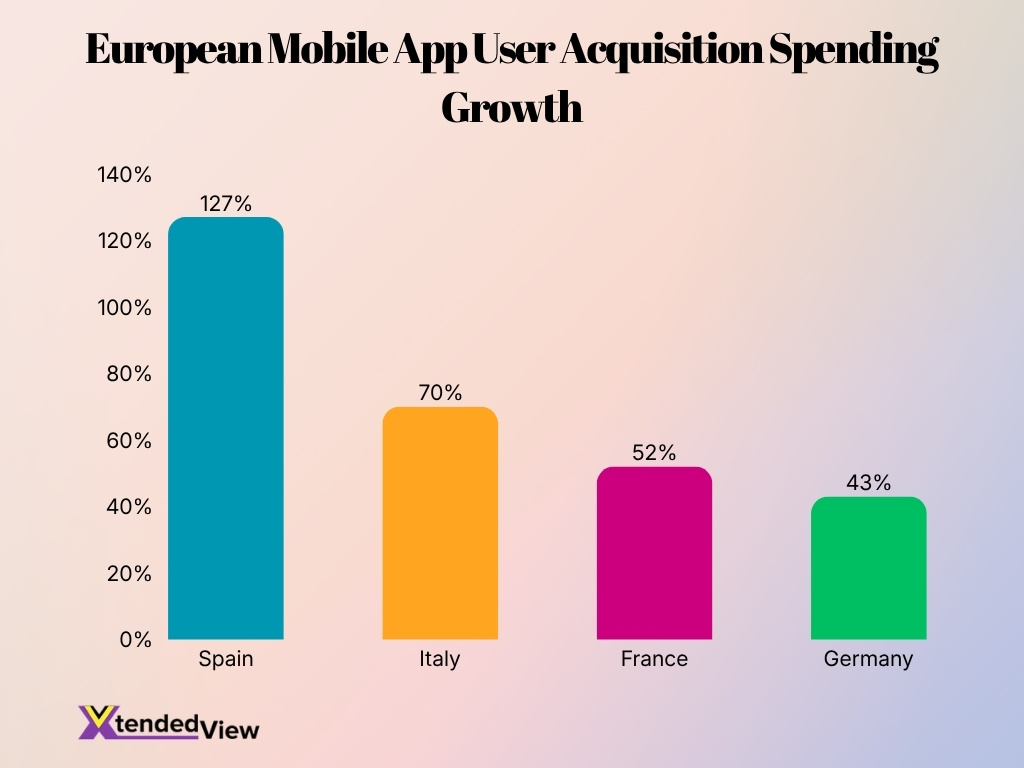
- Spain saw a massive 127% increase in user acquisition spending in 2025, while Italy grew by 70%.
- Acquisition spending rose 52% in France and 43% in Germany during 2025 due to shopping-app campaigns.
- Brazil’s share of Android acquisition spending declined 43%, and India’s share dropped 28% despite 6% absolute growth.
- India had nearly 1.02 billion internet users and about 750 million smartphones by September 2025.
- India’s average monthly mobile data consumption reached 24 GB per user in 2025, up from 62 MB in 2014.
- Indian mobile app revenue exceeded $300 million in the first quarter of 2026, marking a 33% increase from 2025.
Mobile App Development Trends
- 84% of developers used or planned to use AI tools in 2025, up from 76% in 2024.
- Python adoption increased by 7 percentage points between 2024 and 2025 as developers expanded AI and data use.
- A 2026 study of 2,901 AI-authored pull requests across 193 mobile repositories confirmed coding agents in real workflows.
- Android projects received twice as many AI-authored pull requests as iOS projects in that study.
- Android maintainers accepted 71% of AI-authored pull requests, compared with 63% for iOS repositories.
- A benchmark evaluating 12 language models on 101 Android problems found the strongest model completed only 18.8% correctly.
- A 2026 benchmark of 384 issue-resolution tasks from 18 production apps found AI success rates of only 3.39% to 5.21%.
- Fixes in that benchmark changed an average of 12.5 files and 324.9 lines, while 35.7% required coordinated edits.
- An experiment generated artifacts in under five minutes per feature, with 100% of UI tests executing successfully across 13 issues.
- A 2026 accessibility study of 110 developers across 43 countries found teams delayed testing until late in development.
Frequently Asked Questions (FAQs)
Consumers spent $167 billion on global in-app purchases in 2025, representing a 10% year-over-year increase.
Global users spent approximately 5.3 trillion hours using mobile apps during 2025.
The global mobile app market is projected to generate about $739.61 billion in revenue during 2026.
Developers retained more than 90% of the $1.4 trillion in App Store ecosystem billings and sales facilitated during 2025 without paying commission on those transactions.
India recorded approximately 25.5 billion mobile app downloads in 2025, making it the world’s largest app download market.
Conclusion
The mobile app industry continues to grow, driven by AI innovation, subscription-based business models, and increasing smartphone adoption worldwide. Companies are investing more in user acquisition, retention, and App Store Optimization while expanding their focus on personalized user experiences and recurring revenue.
As the market becomes more competitive, businesses that combine effective monetization strategies with strong user engagement and continuous product improvements will be better positioned for long-term success in the global app economy.