
Dell remains one of the world’s largest technology companies, serving businesses, governments, and consumers with PCs, servers, storage, networking, and AI infrastructure. Its products power enterprise data centers, support hybrid workforces, and help organizations deploy generative AI workloads at scale. As AI spending and enterprise modernization accelerate, Dell continues to play a major role across the global technology ecosystem. Explore the latest Dell statistics to understand the company’s financial performance, product portfolio, and market position.
Editor’s Choice
- Dell generated approximately $95.6 billion in revenue during fiscal 2025, reflecting renewed momentum driven by enterprise infrastructure demand.
- Infrastructure Solutions Group (ISG) became Dell’s fastest-growing business as enterprise customers accelerated investments in AI-optimized servers and data center modernization.
- Dell’s Client Solutions Group (CSG) reported $50.98 billion in fiscal 2026 revenue, with commercial PC demand offsetting softer consumer sales.
- Dell ranked among the top three global PC vendors throughout 2025, maintaining a market share of around 15% worldwide.
- Worldwide PC shipments rebounded by 9.1% in 2025, creating favorable conditions for Dell’s commercial device business.
- AI infrastructure became Dell’s largest growth engine, prompting the company to significantly raise its AI server revenue outlook during fiscal 2026.
- Dell continues serving customers across 180+ countries and territories, making it one of the world’s largest enterprise technology providers.
Recent Developments
- During fiscal 2026, Dell increased its annual revenue guidance to $105-$109 billion, supported by strong AI server demand.
- Dell increased its projected AI server revenue from $15 billion to $20 billion after receiving exceptionally strong enterprise orders.
- The company secured $5.6 billion in AI infrastructure orders during one fiscal quarter while shipping a record $8.2 billion worth of AI servers.
- Dell finished the reported quarter with an AI infrastructure backlog worth approximately $11.7 billion, providing strong future revenue visibility.
- Infrastructure Solutions Group revenue increased 44% year over year, highlighting enterprise demand for accelerated computing.
- Gartner estimated Dell shipped 11.78 million PCs during Q4 2025, giving it a 16.5% global market share.
- Dell benefited from the enterprise Windows 11 refresh cycle, which supported stronger commercial PC shipments throughout 2025.
- The company continued expanding its AI infrastructure portfolio through NVIDIA-powered servers designed for enterprise generative AI deployments.
- Dell introduced broader commercial AI PC offerings to help enterprises deploy on-device AI capabilities across employee workforces.
Dell History and Milestones
- 1984: Michael Dell founded the company while attending the University of Texas, initially selling customized personal computers directly to customers.
- 1988: Dell became a publicly traded company, providing capital for international expansion.
- 1990s: Dell became one of the fastest-growing PC manufacturers through its direct-to-customer sales model.
- 2013: Dell completed its transition back to a privately held company following a management-led buyout.
- 2016: Dell announced the acquisition of EMC in one of the largest technology mergers ever completed.
- 2018: Dell returned to public markets as Dell Technologies after restructuring its ownership.
- 2021: Dell completed the VMware spin-off, allowing both companies to pursue independent growth strategies.
- 2025-2026: Dell accelerated its transformation into an AI infrastructure leader through large-scale enterprise GPU server deployments.
Dell’s Annual Revenue Growth
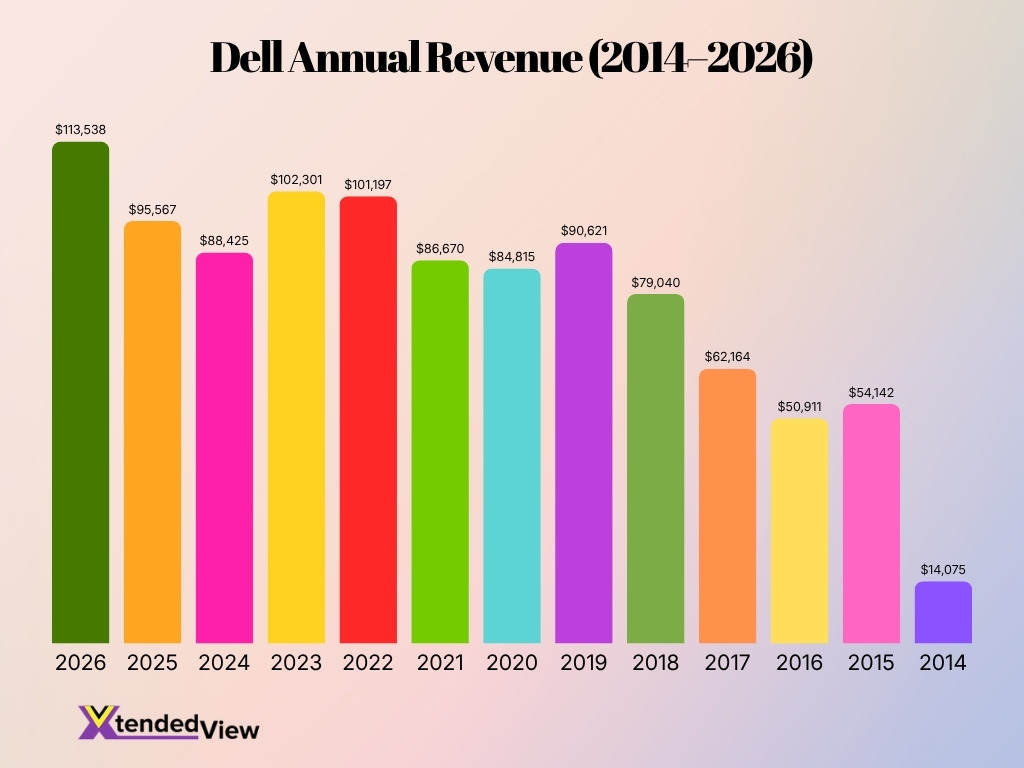
- Dell recorded its highest annual revenue of $113.54 billion in 2026, up sharply from $95.57 billion in 2025.
- Revenue increased by approximately 18.8% year over year in 2026, signaling strong business growth.
- Dell’s revenue declined to $88.43 billion in 2024 before recovering in both 2025 and 2026.
- The company crossed the $100 billion revenue mark in 2022, 2023, and 2026.
- Dell generated $102.30 billion in 2023, slightly above the $101.20 billion reported in 2022.
- Revenue rose from $86.67 billion in 2021 to $101.20 billion in 2022, an increase of about 16.8%.
- Dell’s annual revenue grew from $14.08 billion in 2014 to $113.54 billion in 2026, representing an increase of more than 700%.
- The company experienced revenue declines in 2016, 2020, 2023, and 2024, showing periods of uneven growth.
- Dell’s revenue remained above $79 billion every year from 2018 onward.
- The overall data shows a strong long-term upward trend despite several short-term fluctuations.
Dell Business Segments and Products
- Dell’s Infrastructure Solutions Group (ISG) achieved a full-year revenue of $43.6 billion, reflecting a 29% year-over-year growth.
- The Client Solutions Group (CSG) generated $48.4 billion in annual revenue, with commercial PC sales contributing $40.8 billion.
- AI-optimized server systems drove a record $51.3 billion AI backlog for the enterprise by early fiscal 2027.
- Servers and networking revenue surged to $27.1 billion annually due to unprecedented enterprise demand for AI infrastructure.
- Dell’s storage solutions portfolio maintained steady performance, bringing in $16.4 billion in annual revenue.
- The company secured a massive $24.4 billion in new AI orders during a single recent fiscal quarter.
- Consumer PC offerings produced $7.5 billion in annual revenue, demonstrating a heavier overall business reliance on commercial deployments.
- Total corporate operations reached a transformative milestone of $95.6 billion in revenue, growing 8% year-over-year.
Dell Historical Financial Performance
- Dell generated $113.5 billion in revenue during fiscal 2026, up 19% year over year, marking the highest annual revenue in the company’s history.
- Fiscal 2025 revenue totaled $95.6 billion, recovering from the slowdown in enterprise and PC spending seen during the previous year.
- Fiscal 2024 revenue was approximately $88.4 billion, reflecting softer global demand for PCs and infrastructure products.
- Infrastructure Solutions Group (ISG) revenue increased from $33.9 billion in fiscal 2024 to $43.6 billion in fiscal 2025, before reaching $60.8 billion in fiscal 2026.
- Client Solutions Group (CSG) revenue improved from $48.4 billion in fiscal 2025 to $51.0 billion in fiscal 2026 after commercial PC demand strengthened.
- AI-optimized server revenue climbed from $1.87 billion in fiscal 2024 to $9.29 billion in fiscal 2025 and $24.68 billion in fiscal 2026.
- ISG operating income reached a record $7.1 billion in fiscal 2026, up 27% from the previous year.
- Dell’s operating cash generation continued supporting higher dividends, share repurchases, and AI infrastructure investments throughout fiscal 2026.
- The company’s revenue mix has shifted steadily toward enterprise infrastructure, reducing dependence on consumer PC sales.
Leading PC Brands by Market Share
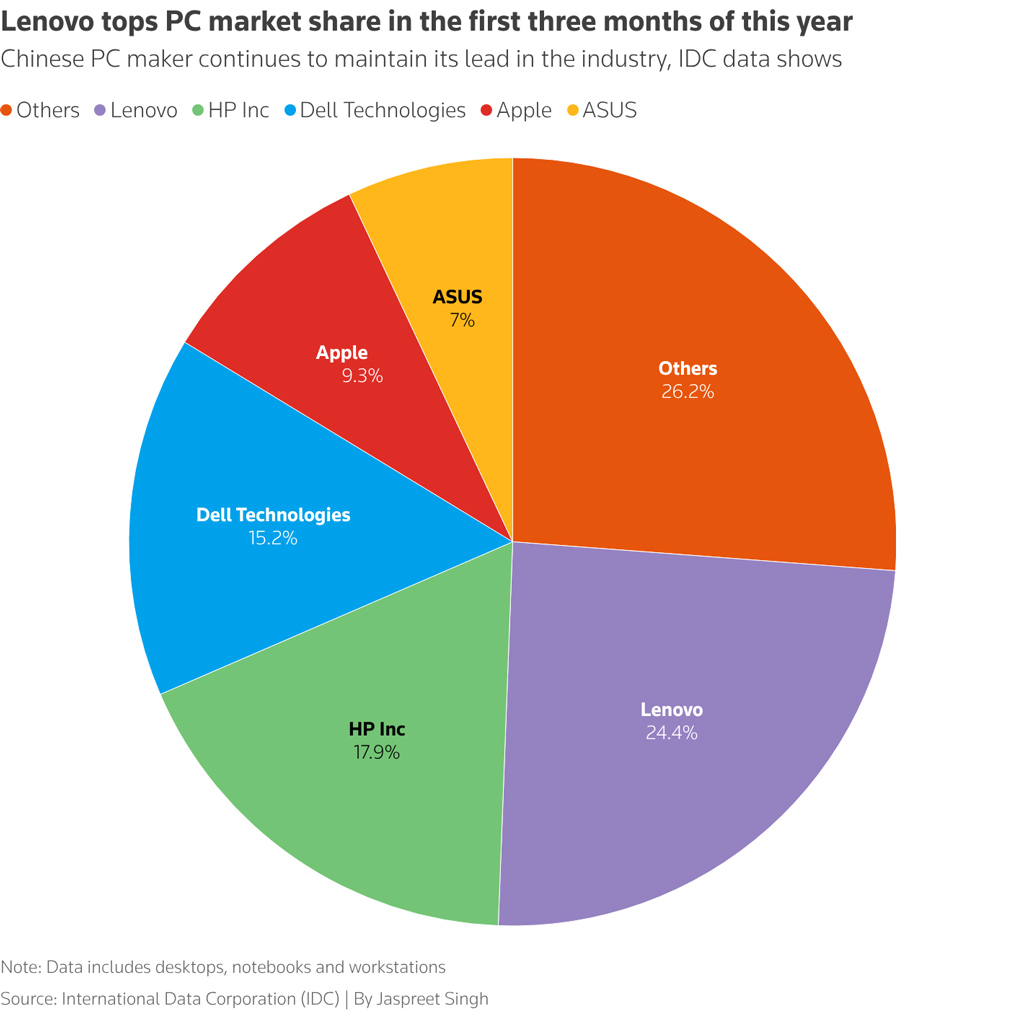
- Lenovo dominated the PC market during the first three months of the year, securing the top position with a 24.4% market share.
- HP Inc. ranked as the second-largest PC vendor, accounting for a substantial 17.9% share of the overall market.
- Dell Technologies held third place with a 15.2% market share, maintaining a strong position among leading PC manufacturers.
- Apple captured 9.3% of the market, placing it ahead of ASUS but well behind the three largest PC vendors.
- ASUS represented 7.0% of total PC market share, making it the smallest named vendor in the comparison.
- Other PC manufacturers collectively accounted for 26.2%, exceeding the individual market share of every listed company.
- The three leading vendors, Lenovo, HP Inc. and Dell Technologies, together controlled 57.5% of the PC market.
- The figures include shipments of desktops, notebooks and workstations, based on data from International Data Corporation.
Dell Market Capitalization and Valuation
- Dell’s market capitalization fluctuated around $90-100 billion in 2025 before surging on AI demand.
- The board authorized an additional $10 billion for the company’s ongoing share repurchase program.
- Dell increased its annual cash dividend by 18% entering fiscal 2026 to reward shareholders.
- The company raised its full-year AI server revenue expectation to a massive $60 billion.
- Dell shares skyrocketed over 213% year-to-date in 2026, heavily outperforming traditional hardware competitors.
- The AI server backlog expanded to a record $51.3 billion, serving as a leading valuation indicator.
- Infrastructure Solutions Group operating income hit $5.6 billion in fiscal 2025, surpassing client devices.
- AI-optimized server revenue reached $16.1 billion in a single quarter, representing a 757% year-over-year increase.
- The company generated a robust $4.5 billion in full-year cash flow from operations during fiscal 2025.
Dell Laptop and Desktop Sales Statistics
- Commercial client revenue reached $44.1 billion during fiscal 2026, increasing 8% year over year.
- Consumer client revenue totaled $6.9 billion, declining 8% compared with fiscal 2025.
- Total Client Solutions Group revenue increased 5% to approximately $51 billion during fiscal 2026.
- Dell recorded $13.5 billion in fourth-quarter CSG revenue, up 14% from the previous year.
- Fourth-quarter commercial client revenue reached $11.6 billion, increasing 16% year over year.
- Consumer client revenue remained roughly $1.9 billion during the fiscal 2026 fourth quarter.
- Business notebook demand outpaced consumer laptop sales as hybrid work and Windows refresh projects continued.
- AI-enabled commercial PCs became a strategic product category for Dell’s enterprise customers during fiscal 2026.
- Higher-end device configurations helped improve commercial revenue despite competitive pricing across the PC industry.
Dell Regional Revenue Distribution
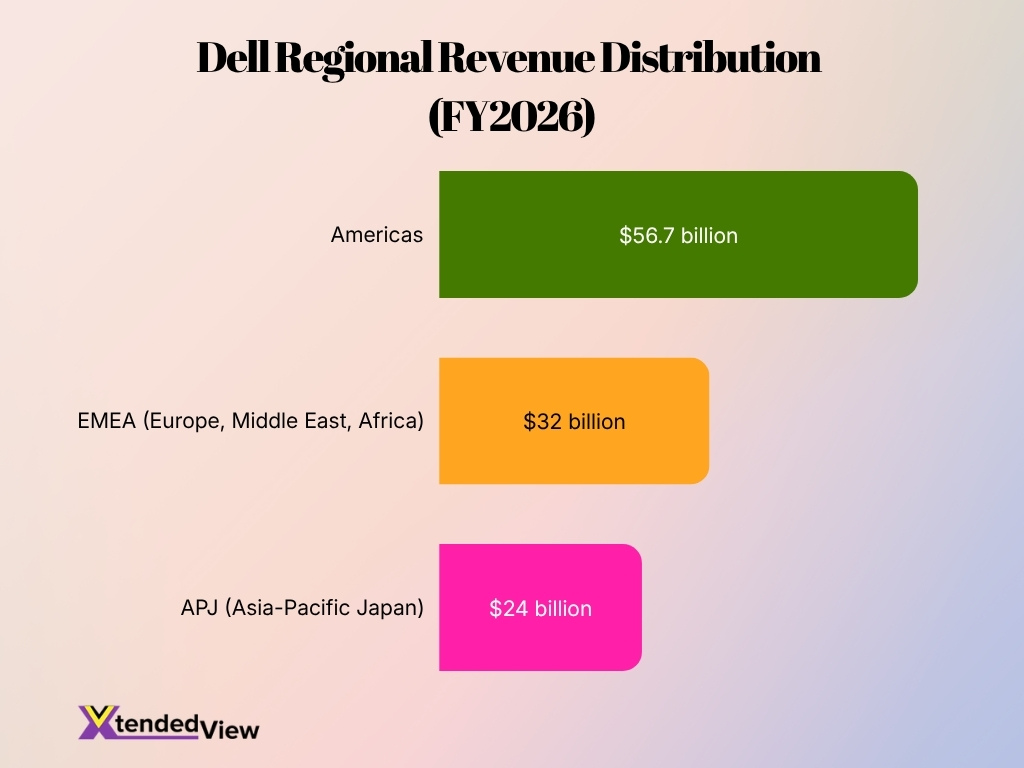
- The Americas region generated over $56.7 billion, accounting for more than 50% of the $113.5 billion total FY26 revenue.
- Global AI server shipments skyrocketed by 166% to reach a record $24.6 billion, driven by robust regional enterprise deployments.
- The EMEA market maintained its position as the second-largest regional business by contributing roughly $32 billion to global sales.
- The APJ region captured approximately $24 billion in revenue, backed by expanding digital transformation and AI infrastructure projects.
- Commercial client operations generated $44.1 billion, reflecting an 8% year-over-year increase across all major operating territories.
- Surging enterprise infrastructure demand pushed the Infrastructure Solutions Group to a record $60.8 billion, up 40% globally.
- Public sector, healthcare, and financial investments contributed to a massive $43.0 billion AI backlog exiting fiscal 2026.
- Dell effectively fulfilled technology orders across 180+ countries, supported by a record-breaking $11.2 billion in operating cash flow.
Dell Enterprise Solutions and ISG Statistics
- Infrastructure Solutions Group generated a record $60.8 billion in revenue during fiscal 2026, up 40% year over year.
- ISG operating income reached $7.1 billion, representing a 27% annual increase.
- Servers and networking revenue climbed to $44.2 billion, increasing 63% from fiscal 2025.
- Traditional server and networking revenue grew 9% to approximately $19.5 billion during fiscal 2026.
- Storage revenue reached $16.6 billion, increasing 1% year over year.
- ISG’s operating margin measured 11.7% during fiscal 2026.
- Enterprise AI deployments became the primary driver behind ISG’s record financial performance.
- Demand remained strongest across hyperscalers, cloud providers, financial institutions, healthcare organizations, and government agencies investing in AI infrastructure.
- Dell continued expanding integrated infrastructure solutions combining servers, networking, storage, and lifecycle services for enterprise customers.
Dell Data Center and AI Infrastructure Statistics
- AI-optimized server revenue surged 166% during fiscal 2026 to $24.7 billion.
- AI server revenue had already increased 396% during fiscal 2025, demonstrating two consecutive years of exceptional growth.
- Dell shipped approximately $9 billion of AI-optimized servers during the fourth quarter of fiscal 2026 alone.
- Quarterly ISG revenue reached a record $19.6 billion, increasing 73% year over year.
- Dell ended fiscal 2026 with an AI server backlog approaching $9 billion, reflecting sustained enterprise demand.
- AI infrastructure demand was driven primarily by deployments using NVIDIA GPU platforms for generative AI training and inference.
- AI systems became Dell’s fastest-growing infrastructure product category across enterprise and hyperscale customers.
- Growth in AI infrastructure significantly outpaced traditional storage, networking, and standard server businesses during fiscal 2026.
- Dell continues investing in liquid cooling, high-density racks, networking, and integrated AI infrastructure to support increasingly complex enterprise workloads.
Dell Technologies’ Financial Ratios
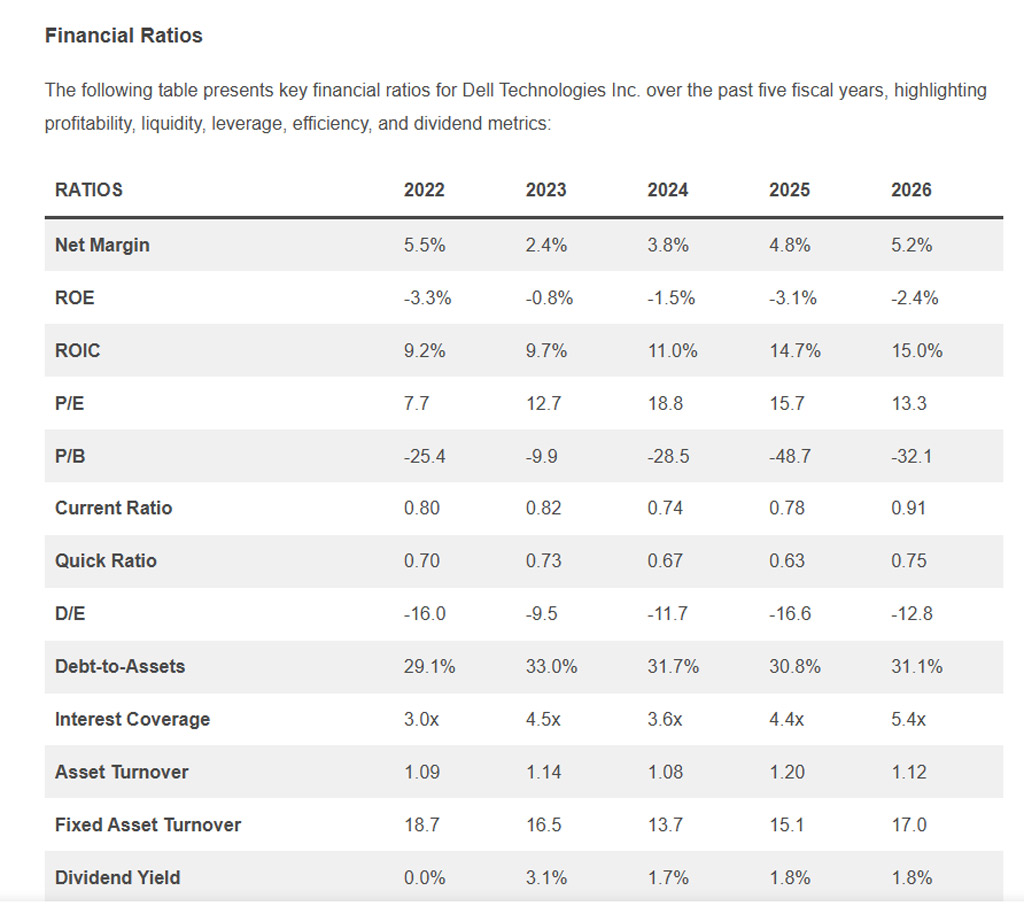
- Dell’s net margin recovered from 2.4% in 2023 to 5.2% in 2026, nearing its 5.5% level in 2022.
- ROIC improved consistently, rising from 9.2% in 2022 to a five-year high of 15.0% in 2026.
- The company’s ROE remained negative throughout the period, standing at -2.4% in 2026.
- Dell’s P/E ratio peaked at 18.8 in 2024 before declining to 13.3 in 2026.
- The current ratio increased to 0.91 in 2026, its highest level across the five fiscal years.
- The quick ratio also improved to 0.75 in 2026, up from a low of 0.63 in 2025.
- Dell’s debt-to-assets ratio stayed relatively stable, ranging between 29.1% and 33.0%.
- Interest coverage strengthened significantly from 3.0x in 2022 to 5.4x in 2026.
- Asset turnover reached its highest point at 1.20 in 2025 before easing to 1.12 in 2026.
- Fixed asset turnover rebounded from 13.7 in 2024 to 17.0 in 2026.
- Dell’s dividend yield rose from 0.0% in 2022 to 1.8% in both 2025 and 2026.
- The company’s P/B ratio remained negative, reaching its lowest level of -48.7 in 2025.
Dell Storage and Cloud Solutions Statistics
- Dell generated $16.6 billion in storage revenue during fiscal 2026.
- Storage revenue increased by 1% year over year despite market caution.
- Infrastructure Solutions Group achieved a record $60.8 billion in full-year revenue.
- AI-optimized servers generated a massive $24.7 billion in annual revenue.
- Operating income for the infrastructure division climbed 27% to $7.1 billion.
- Traditional servers and networking experienced a 9% growth to $19.5 billion.
- Dell successfully closed over $64 billion in AI infrastructure orders.
- Infrastructure backlog reached a record-breaking $43 billion entering the new year.
- Quarterly infrastructure revenues surged by 73% to reach $19.6 billion.
- Annual cash flow from company operations hit a record $11.2 billion.
Dell Client Solutions Revenue Performance
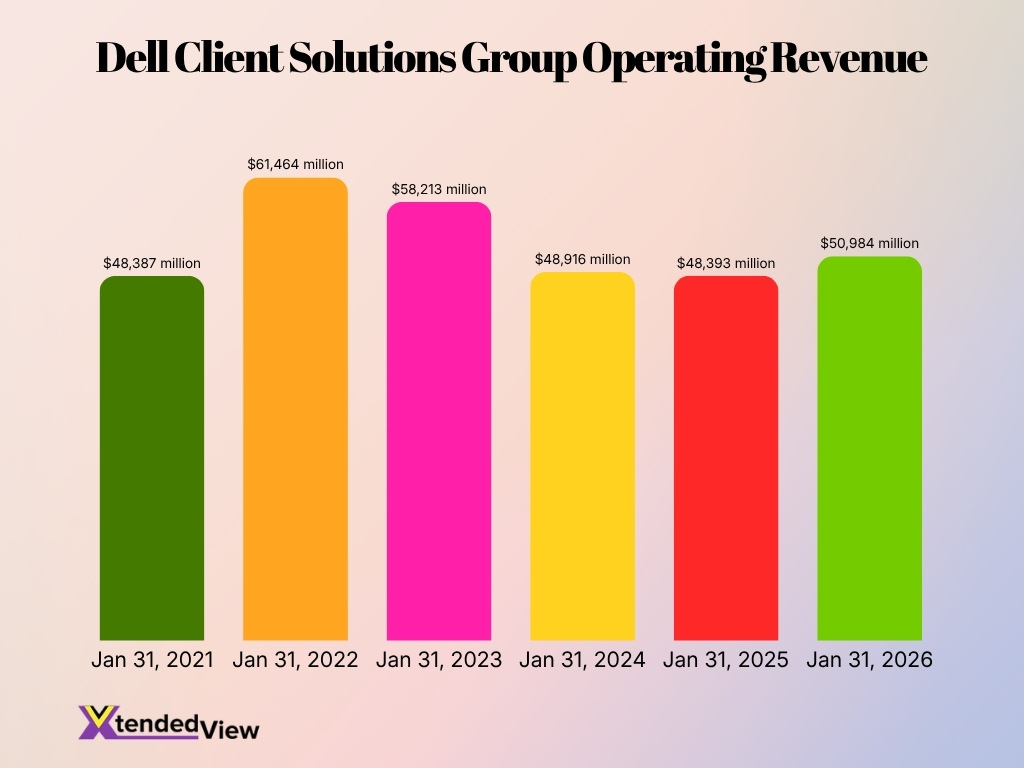
- Dell’s Client Solutions Group revenue peaked at $61.46 billion in 2022, the highest figure in the six years.
- Revenue declined by 5.3% in 2023, falling from $61.46 billion to $58.21 billion.
- The segment recorded a sharper drop in 2024, with revenue decreasing by 16.0% to $48.92 billion.
- Revenue remained relatively stable in 2025 at $48.39 billion, representing a slight 1.1% year-over-year decline.
- Dell achieved a modest recovery in 2026, as Client Solutions Group revenue increased by 5.4% to $50.98 billion.
- Despite the recent improvement, 2026 revenue remained 17.1% below the 2022 peak.
Dell Customer Base and Industry Verticals
- Dell provides technology solutions to 98% of Fortune 500 companies across 180 countries.
- The Infrastructure Solutions Group generated 38% of Dell’s $88.5 billion total revenue in FY2024.
- Dell’s AI server revenue experienced an impressive 8.5x growth, exceeding $16 billion in demand.
- The company is ranked as the #1 worldwide IT services provider for the healthcare industry based on annual revenue.
- Dell’s Client Solutions Group, encompassing commercial desktop and retail devices, accounted for 55.3% of overall enterprise sales.
- The company recently secured a massive $1.4 billion federal contract to supply software and secure computing services to government agencies.
- Dell holds a dominant 43% market share in the computer manufacturing industry to support educational and commercial deployments.
- The company processes immense enterprise hardware volumes, historically shipping approximately 2.55 units per second globally.
- The global AI server and edge computing market utilized by manufacturing and telecom verticals is projected to reach $174 billion by 2027 at a 22% CAGR.
Dell Employee Count and Workforce Statistics
- Dell’s actual global workforce stood at 97,000 employees in fiscal 2026, down from 108,000 in 2025.
- The company currently serves and supports enterprise customers in more than 180 countries worldwide.
- The United States accounts for the largest share of the workforce at approximately 33%.
- India serves as the second-largest employee base, holding about 28% of the total global headcount.
- The engineering department represents the largest functional group, making up 39% of all employees.
- Finance and operations professionals account for roughly 37% of the worldwide workforce.
- Sales and marketing teams comprise approximately 24% of the company’s overall staff.
- The company’s overall headcount experienced a 10% reduction, eliminating 11,000 positions throughout fiscal 2026.
Dell’s Competitive Position by Market Capitalization
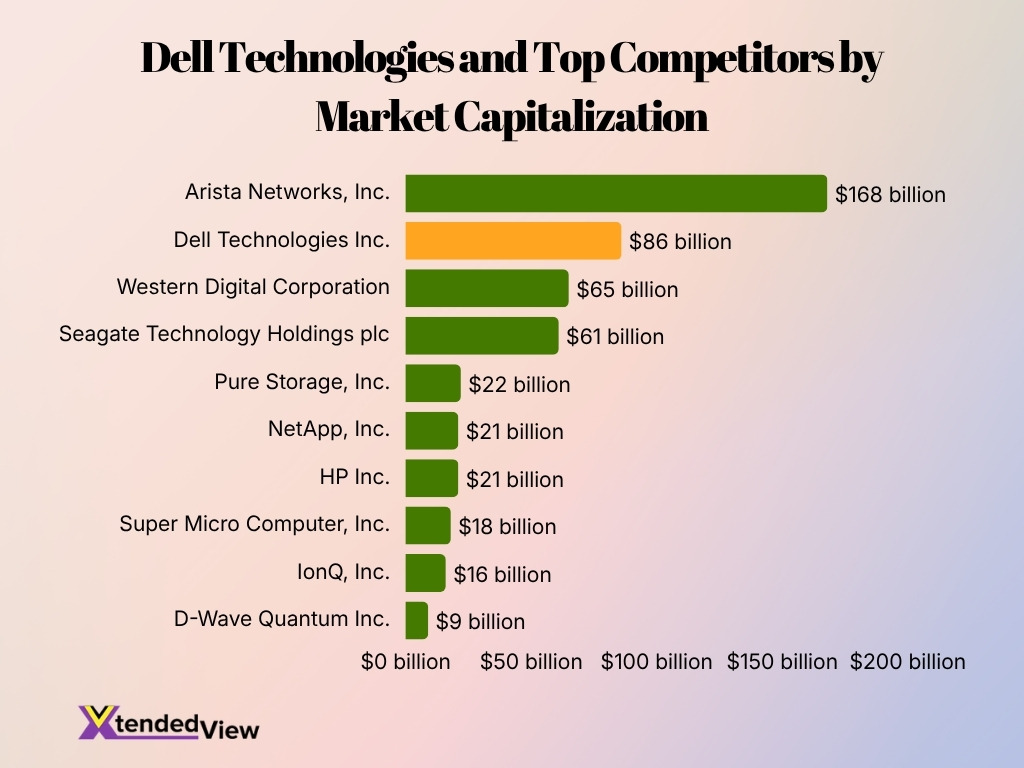
- Arista Networks leads the group with a market capitalization of $168 billion, nearly double Dell’s value.
- Dell Technologies ranks second with a market capitalization of $86 billion.
- Western Digital holds third place at $65 billion, followed closely by Seagate Technology at $61 billion.
- Pure Storage has a market capitalization of $22 billion, placing it fifth among the listed companies.
- NetApp and HP Inc. are tied at $21 billion each.
- Super Micro Computer is valued at $18 billion, while IonQ stands at $16 billion.
- D-Wave Quantum has the lowest market capitalization in the top 10 at $9 billion.
- Dell’s market capitalization is $82 billion lower than Arista Networks but $21 billion higher than Western Digital.
Dell Sustainability and ESG Statistics
- Dell reduced scopes 1 and 2 GHG emissions by 40.6%, tracking toward net-zero by 2050.
- The company currently sources 61.5% of electricity from renewable energy globally.
- An impressive 96.4% of packaging is constructed from recycled or renewable materials.
- Currently, 14.1% of product content consists of recycled, renewable, or reduced carbon materials.
- The brand has successfully incorporated over 43 million kg of sustainable materials into its products.
- Dell successfully lowered scope 3 GHG emissions from sold products by 22.9%.
- The company integrates certified 50% recycled content steel into its commercial display manufacturing.
- Women currently represent 35% of the global workforce, to reach 50% representation by 2030.
- Digital inclusion and equity programs have positively impacted 396 million people since FY20.
Frequently Asked Questions (FAQs)
Dell reported a record $113.5 billion in full-year revenue for fiscal 2026, a 19% year-over-year increase.
Dell held approximately 15.3% of worldwide PC shipments in 2025, shipping 41.4 million PCs and ranking third globally.
Dell’s ISG generated a record $60.8 billion in revenue during fiscal 2026, representing 40% annual growth.
Dell generated approximately $24.7 billion in AI-optimized server revenue during fiscal 2026 and expects about $50 billion in fiscal 2027.
Dell employs approximately 120,000 people across more than 180 countries and territories worldwide.
Conclusion
Dell entered fiscal year with strong momentum as enterprise spending shifted toward AI infrastructure, cloud modernization, and commercial computing. Record revenue, expanding AI server sales, and sustained demand for enterprise solutions reinforced the company’s position as one of the world’s leading technology providers. Although the consumer PC market remains competitive, Dell continues to benefit from its diversified business model, broad global customer base, and growing presence in AI-ready infrastructure.
Looking ahead, investments in artificial intelligence, hybrid cloud, sustainability, and enterprise services are expected to remain the primary drivers of Dell’s long-term growth.