Facebook remains one of the most important digital channels for businesses, combining broad consumer reach with advertising, video, messaging, local commerce, and customer-service tools. Companies use Facebook Pages to maintain a public presence, Reels and Feed content to reach new audiences, Messenger to handle inquiries and lead conversations, and paid campaigns to generate traffic, sales, and qualified leads. Retailers also use Marketplace and video content to support product discovery, while local service businesses rely on targeted advertising and messaging to connect with nearby customers.
At the same time, Facebook’s business value is shifting away from follower counts alone. AI-powered recommendations, automated ad optimization, and stronger emphasis on original content now influence how widely business posts and campaigns travel. Current data also shows that Facebook reaches consumers across age groups, locations, and income levels, which keeps the platform relevant for both large brands and small businesses. The statistics in this article show how Facebook performs across reach, engagement, advertising, video, commerce, lead generation and business growth.
Editor’s Choice
- The broader family of apps averaged 3.60 billion daily active people in June 2026, representing 3% year-over-year growth. This metric covers Facebook, Instagram, Messenger, WhatsApp and other services rather than Facebook alone.
- Advertising impressions across the family of apps increased 14% year over year in Q2 2026, while the average price per ad increased 12%. Together, those figures indicate continued advertiser demand alongside expanding ad delivery.
- In Q1 2026, advertising impressions increased 19% year over year, while average ad prices rose 12%.
- Full-year 2025 advertising revenue across the family of apps reached $196.18 billion, up 22% from $160.63 billion in 2024.
- AI-powered advertising tools produced a reported 22% improvement in return on ad spend for advertisers in a U.S. study released in 2025.
- U.S. advertisers using the newer AI-driven advertising tools generated an estimated $4.52 in revenue for every $1 spent, compared with $3.71 per dollar across all U.S. advertisers in the study.
- Facebook Feed and video ranking improvements introduced during Q4 2025 produced a 7% increase in views of organic Feed and video posts, while U.S. video time spent grew at a double-digit year-over-year rate.
- Facebook was surfacing more than 25% more same-day Reels in early 2026 compared with Q3 2025, reflecting the platform’s growing emphasis on fresh short-form content.
Recent Developments
- Q2 2026 revenue reached $60.80 billion, increasing 28% year over year. The result reflects continued commercial growth across the broader ecosystem in which Facebook operates.
- Q1 2026 revenue totaled $56.31 billion, representing 33% year-over-year growth from $42.31 billion in Q1 2025.
- Family daily active people reached 3.56 billion in March 2026, 4% higher than a year earlier. This provides an important indicator of the overall scale supporting Facebook’s advertising ecosystem.
- By June 2026, more than 500 million Facebook users watched AI-translated videos each week, creating new opportunities for creators and brands to distribute video across language markets.
- Facebook’s AI translation tools supported nine languages before additional support for Arabic, Bahasa Indonesian, French, Thai and Vietnamese was announced in June 2026.
- More than 1 million businesses were already using an AI-powered Business Agent on WhatsApp and Messenger by June 2026 to respond to customers around the clock.
- More than 1 billion people used Meta AI monthly when expanded AI-based recommendation changes were announced in late 2025. Interactions with AI subsequently became another signal available for personalizing content and advertising recommendations.
- The latest incremental attribution model produced a reported 24% increase in incremental conversions versus the standard attribution model in Q4 2025. The product reached a multibillion-dollar annual run rate within seven months of launch.
How Many Businesses Use Facebook
- More than 35 million businesses in the U.S. used Facebook and Instagram to grow their operations each month, according to research released in 2025.
- More than 2 million American businesses advertised monthly across the company’s apps, equivalent to roughly one advertising business for every 17.5 businesses represented in the 35-million-business usage figure.
- Personalized advertising technologies across the company’s platforms were associated with nearly $550 billion in U.S. economic activity in 2024, according to research published in 2025.
- The same analysis associated those advertising technologies with 3.4 million U.S. jobs in 2024.
- The estimated economic activity connected with personalized advertising increased 32.5% compared with an equivalent 2022 study.
- The estimated number of jobs connected with the advertising technologies increased 10% compared with the equivalent 2022 analysis.
- In India, 92% of businesses using the company’s platforms were micro, small and medium enterprises as of December 2025. This regional figure illustrates how heavily the ecosystem can skew toward smaller businesses.
- In a separate India-focused study, only 15% of roughly 30 million formalized small businesses were selling online. That equaled about 5 million businesses and highlighted the remaining opportunity for social platforms to help offline merchants move into digital commerce.
Facebook Active Users Statistics
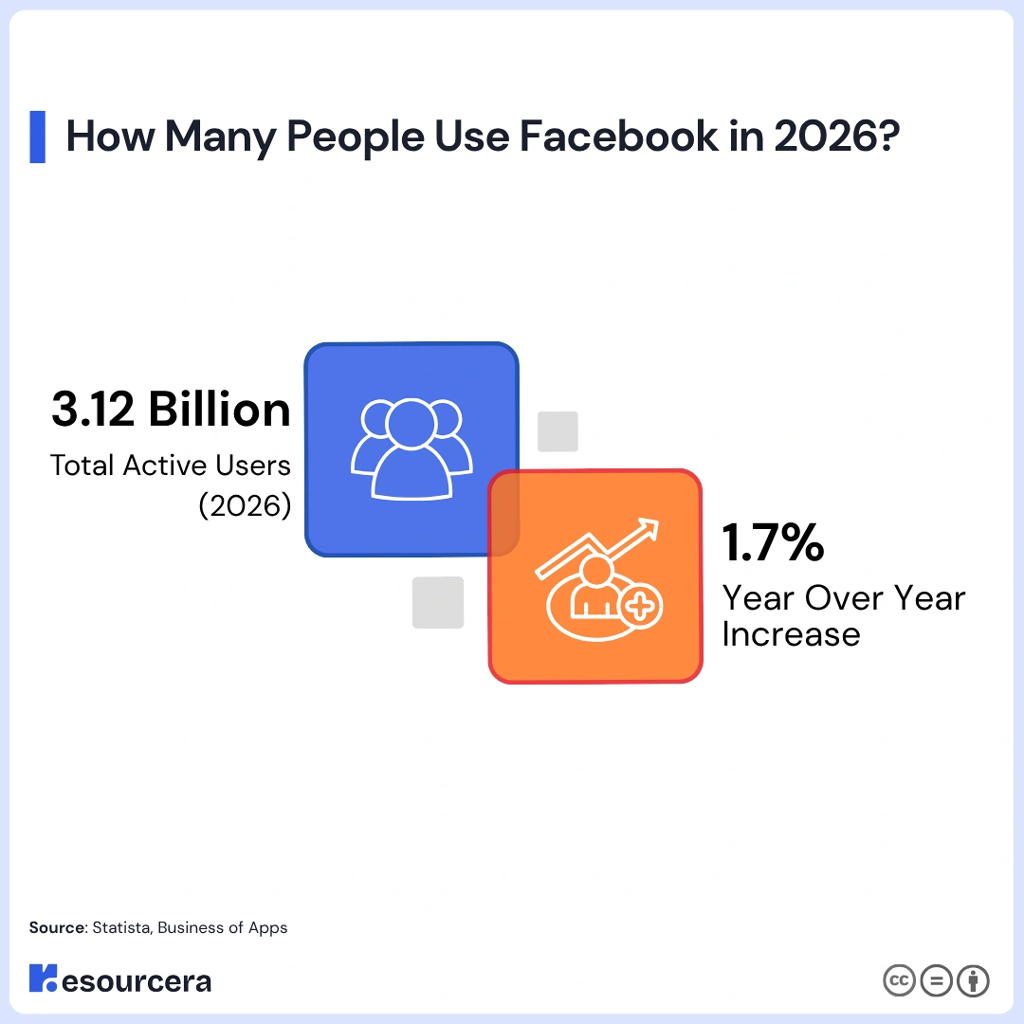
- Facebook has approximately 3.12 billion active users worldwide in 2026, highlighting the platform’s massive global audience.
- Facebook’s active user base increased by 1.7% year over year, showing that the platform continues to attract additional users despite its already enormous scale.
- With more than 3 billion active users, Facebook remains one of the world’s largest social media platforms by overall audience size.
- The 1.7% annual growth rate indicates relatively modest but positive user growth as Facebook operates within an increasingly mature global social media market.
Facebook Demographics: Age, Gender, and Location
- 80% of U.S. adults ages 30-49 reported using Facebook in 2025, making this the platform’s strongest adult age group in the survey.
- Among Americans ages 50-64, 74% used Facebook, giving businesses substantial reach among middle-aged consumers.
- 68% of adults ages 18-29 reported using Facebook. Although younger adults show heavier adoption of several competing social platforms, more than two-thirds still used Facebook.
- Facebook usage reached 57% among Americans ages 65 and older, making it one of the few major social platforms used by a majority of this age group.
- Facebook showed a clear U.S. gender difference in 2025: 78% of women said they used it, compared with 63% of men.
- Advertising data told a similar story. At the end of 2025, women represented 53% of Facebook’s adult U.S. ad audience, while men accounted for 47%.
- Location produced almost no difference in U.S. Facebook adoption: 71% of urban, 71% of suburban and 71% of rural adults reported using the platform in 2025. This unusually even geographic distribution matters for both national brands and local businesses.
- Facebook use also varied little by education: 69% of adults with a high school education or less, 73% with some college education, and 71% of college graduates used Facebook.
- Daily behavior remains strongest among middle-aged users: 58% of Americans ages 30-49 and 54% of those ages 50-64 said they visited Facebook at least daily in the 2025 frequency survey.
Facebook Business Page Statistics
- Across industries, the median Facebook engagement rate for brands measured in a benchmark study was 0.063% per post, illustrating how competitive Page-level organic engagement has become.
- The top 25% of brands achieved a median Facebook engagement rate of 0.19%, roughly three times the overall median in that benchmark.
- Brands across all measured industries posted a median 4.69 Facebook posts per week, equivalent to roughly 20 posts in an average month.
- Top-quartile brands posted about 4.6 times per week, suggesting that higher engagement did not require a substantially greater posting volume.
- A separate posting-frequency analysis found a median of 5.8 Facebook posts per week among brands in its sample. Differences between benchmark datasets underline why businesses should compare performance against their own sector rather than rely on one universal posting target.
- In that analysis, brands in the top 25% by engagement posted only 5.1 times per week, again showing that publishing more often does not automatically produce stronger engagement.
- Facebook’s 2026 ranking changes increased organic Feed and video views by 7% following improvements introduced in Q4 2025, giving business Pages another reason to focus on content quality and recommendation eligibility.
- Facebook reported double-digit year-over-year growth in U.S. video time spent following its late-2025 ranking improvements, reinforcing video’s role within Page and creator content strategies.
- In 2026, the platform also strengthened its preference for original content, while reducing distribution for copied and low-value material. For businesses running Pages, this means original posts and videos increasingly matter for recommendation-driven reach beyond an existing follower base.
Facebook Business Revenue Share by Region Statistics
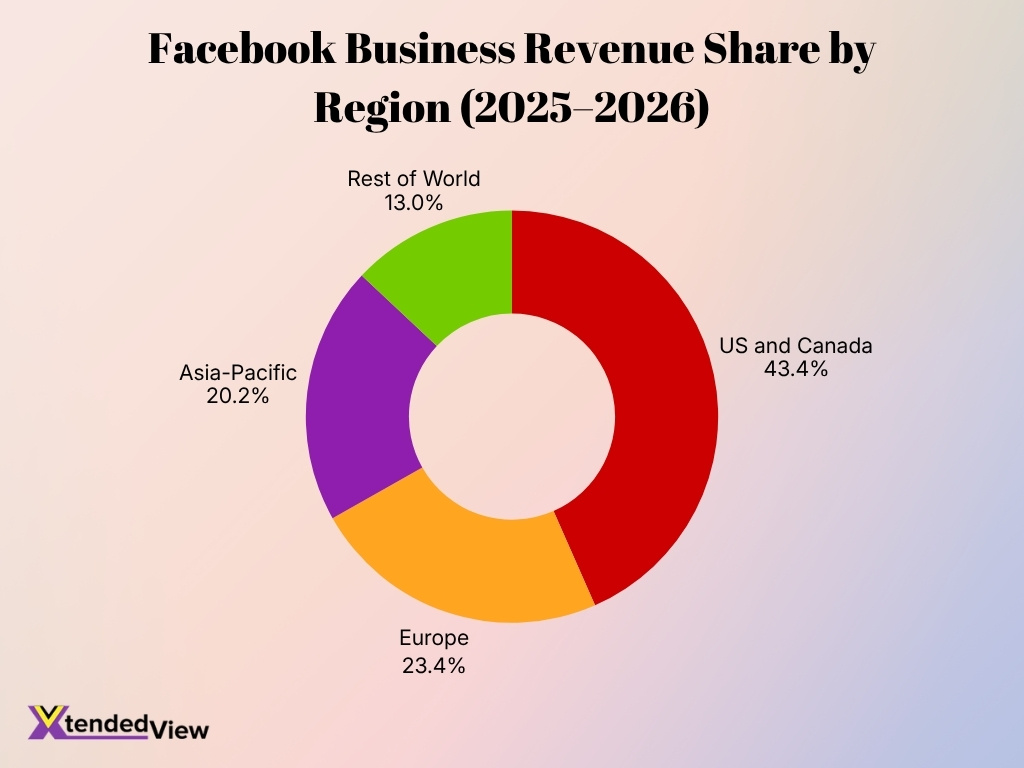
- US and Canada account for the largest share of Facebook’s total revenue at 43.4%, making North America its most valuable regional market.
- Europe contributes 23.4% of total revenue, representing nearly one-quarter of Facebook’s global revenue.
- The Asia-Pacific region generates 20.2% of Facebook’s total revenue, making it the third-largest regional contributor.
- The Rest of World markets collectively contribute 13.0%, the smallest regional share in the dataset.
- Combined, the US and Canada and Europe generate 66.8% of total revenue, highlighting Facebook’s strong reliance on Western markets.
- Markets outside the US and Canada collectively represent 56.6% of Facebook’s revenue, showing the importance of its international business.
- US and Canada’s 43.4% share is nearly double Europe’s 23.4% contribution and more than three times the 13.0% generated by the Rest of World.
Facebook Organic Reach and Engagement Trends
- The latest August 2026 benchmark across more than 52 million Facebook posts puts the median engagement rate at 3.1% across the analyzed accounts. The dataset includes more than 213,000 active accounts.
- Median Facebook reach reached 602 unique users per post in the August 2026 benchmark, showing the typical distribution businesses and creators received across all post formats.
- Average monthly follower growth reached 5.7% in the latest 2026 benchmark. Businesses should compare this figure with accounts of similar size because follower growth varies substantially by audience tier.
- Facebook accounts published an average of 33 posts per month in the August 2026 dataset, which works out to slightly more than one post per day.
- In a 2025 analysis, accounts with fewer than 1,000 followers recorded an 8.8% engagement rate, compared with substantially lower rates among larger accounts. Small business Pages can therefore generate strong interaction even without large follower counts.
- Accounts with 10,000 to 50,000 followers recorded a 4.6% engagement rate and a median reach of 629 users per post in the 2025 dataset.
- Photo posts generated 34.7% more engagement than text posts in the 2025 analysis. Photos also generated 43.8% more engagement than video posts within that specific dataset.
- Facebook’s ranking improvements produced a 7% lift in organic Feed and video views during Q4 2025, indicating that recommendation-system changes can materially affect unpaid distribution.
- Views and watch time for original Facebook Reels approximately doubled during the second half of 2025 compared with the same period of 2024. The platform has simultaneously reduced distribution for copied or minimally modified content.
Facebook Advertising Statistics and Performance Benchmarks
- Facebook traffic campaigns produced an average 1.71% click-through rate in the 2025 benchmark, up from 1.57% a year earlier.
- Average cost per click for Facebook traffic campaigns fell to $0.70 in 2025, compared with $0.77 in the previous benchmark period.
- Lead-focused Facebook campaigns recorded an average 2.59% click-through rate across the industries analyzed in 2025. The previous year’s benchmark stood at 2.58%.
- Average cost per click for lead campaigns reached $1.92, representing a 2.13% year-over-year increase. However, two-thirds of the analyzed industries recorded stable or declining CPCs.
- The average lead-campaign conversion rate was 7.72% in 2025, down from 8.67% in the prior-year dataset. Twelve of 15 industries recorded a year-over-year decline.
- Average cost per lead climbed 20.94% to $27.66. Nine of the 15 industries analyzed experienced higher lead costs.
- Across the broader family of apps, ad impressions increased 14% year over year in Q2 2026, reflecting continued expansion in ad inventory and delivery.
- The average price per ad rose 12% year over year in Q2 2026, with stronger advertiser demand and improvements in targeting and measurement contributing to the increase.
- AI-powered advertising tools generated a reported 22% improvement in return on ad spend in a U.S. economic study released in 2025, highlighting the growing role of automation in campaign performance.
Facebook Ad Reach and Audience Statistics
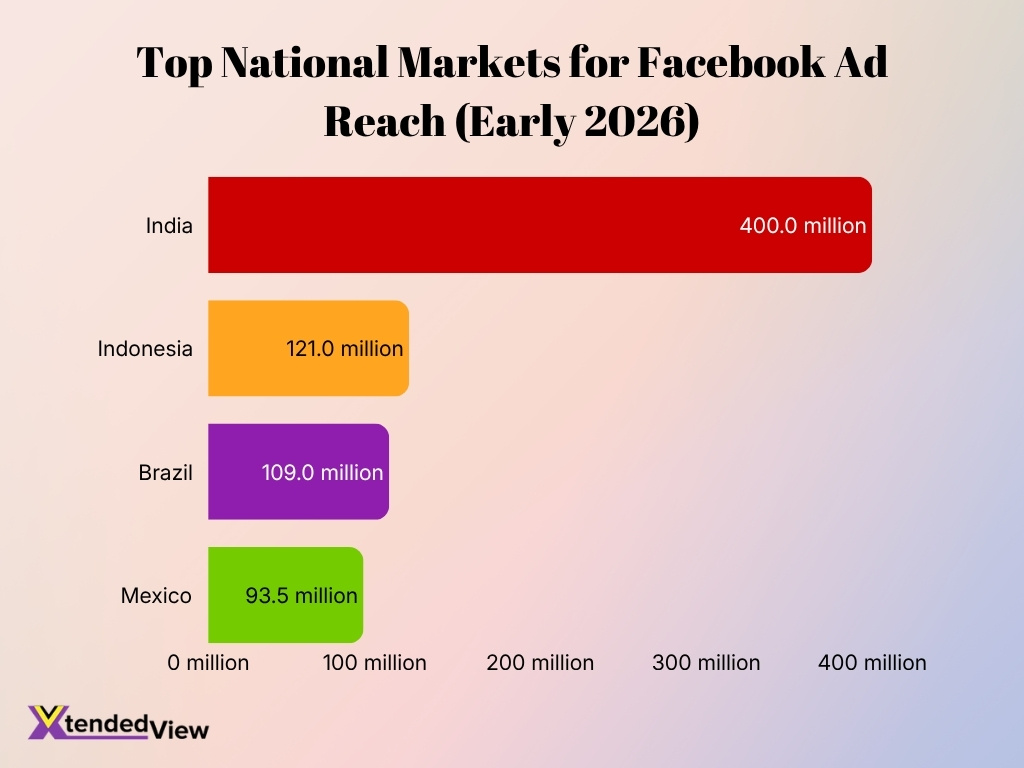
- India’s Facebook advertising audience exceeded 400 million people by early 2026, representing nearly 17% of the platform’s reported worldwide advertising reach.
- Indonesia had a potential Facebook advertising audience of 121 million people in late 2025, making it one of the platform’s largest national markets entering 2026.
- Facebook’s potential advertising reach in Indonesia increased 3.0% year over year, adding approximately 3.5 million reachable users between October 2024 and October 2025.
- Facebook ads could reach the equivalent of 60.2% of Indonesian adults ages 18 and older at the end of 2025.
- Brazil had approximately 109 million people in Facebook’s potential advertising audience in late 2025.
- In Brazil, Facebook’s advertising audience equaled 67.1% of adults ages 18 and older, giving advertisers access to roughly two-thirds of the country’s adult population.
- Mexico’s Facebook advertising audience reached 93.5 million people in late 2025, equivalent to 70.7% of the country’s total population.
- Potential Facebook advertising reach in Mexico increased by approximately 2.9 million users, or 3.2%, between October 2024 and October 2025.
- Mexico’s reported Facebook ad audience represented 84.7% of local internet users in October 2025, illustrating Facebook’s particularly deep penetration in the country’s connected population.
Facebook Video and Reels Engagement Statistics
- Time spent watching video on Facebook increased by more than 20% year over year in the U.S. by mid-2025, showing that video consumption continued to expand despite intense competition from dedicated video platforms.
- Reels longer than one minute accounted for 25% of Reels published by creators with more than 10,000 followers in 2025, showing that the format extends beyond ultra-short clips.
- Longer-than-one-minute Reels generated more than half of Facebook watch time, indicating that businesses do not always need to keep video content extremely short to sustain attention.
- By late 2025, Facebook’s recommendation engine was showing users 50% more Reels published that same day, increasing the advantage of timely content.
- In a 2025 India study, 92% of surveyed short-form video users preferred Reels over the other formats included in the survey. The result provides a regional example of Reels’ strength in a major Facebook market.
- The same study found that 95% of surveyed Reels users watched Reels daily, placing the format at least 12 percentage points ahead of the other surveyed short-form video platforms.
- Reels delivered roughly 33% higher creator engagement than the other short-form platforms included in that India study.
- Reels ads generated twice the top-of-mind recall of long-form video ads in the same research. They also produced four times stronger message association.
- Reels advertising was reported to be 1.5 times more effective at driving brand metrics than long-form skippable video advertising among the audiences studied.
Facebook Messenger for Business Growth
- More than 1 million businesses were using an AI-powered Business Agent on Messenger and WhatsApp by June 2026 to respond to customers continuously.
- Across Messenger, WhatsApp and Instagram, users generated more than 1 billion active conversations with businesses every day as of June 2026. This figure reflects the broader messaging ecosystem rather than Messenger alone.
- Potential Messenger advertising reach fell by more than 95% within six months after the Messenger Inbox ad placement stopped delivering in November 2025. This represents a change in advertising inventory rather than an equivalent collapse in Messenger usage.
- Immediately before the Inbox placement disappeared, businesses could potentially reach roughly 942 million Messenger users with ads worldwide.
- Indonesia still had a reported Messenger advertising audience of 33.7 million people in late 2025, before the subsequent global change in Messenger ad placement availability.
- Brazil’s reported Messenger advertising audience reached 46.9 million users in late 2025, equal to roughly 22% of the country’s population.
- Messenger ads reached approximately 54.6 million people in Mexico in late 2025, giving the service a particularly large business-messaging footprint in that market.
- Messenger’s late-2025 advertising reach represented 49.5% of Mexican internet users, illustrating how strongly business messaging had penetrated connected audiences before the Inbox ad-placement change.
- A 2025 agency campaign that combined multilingual video and messaging generated a 110% lift in conversations, alongside an 84% increase in conversions, providing a regional example of how social ads and messaging can work together lower in the funnel.
Facebook Business Page Engagement Rate by Content Format
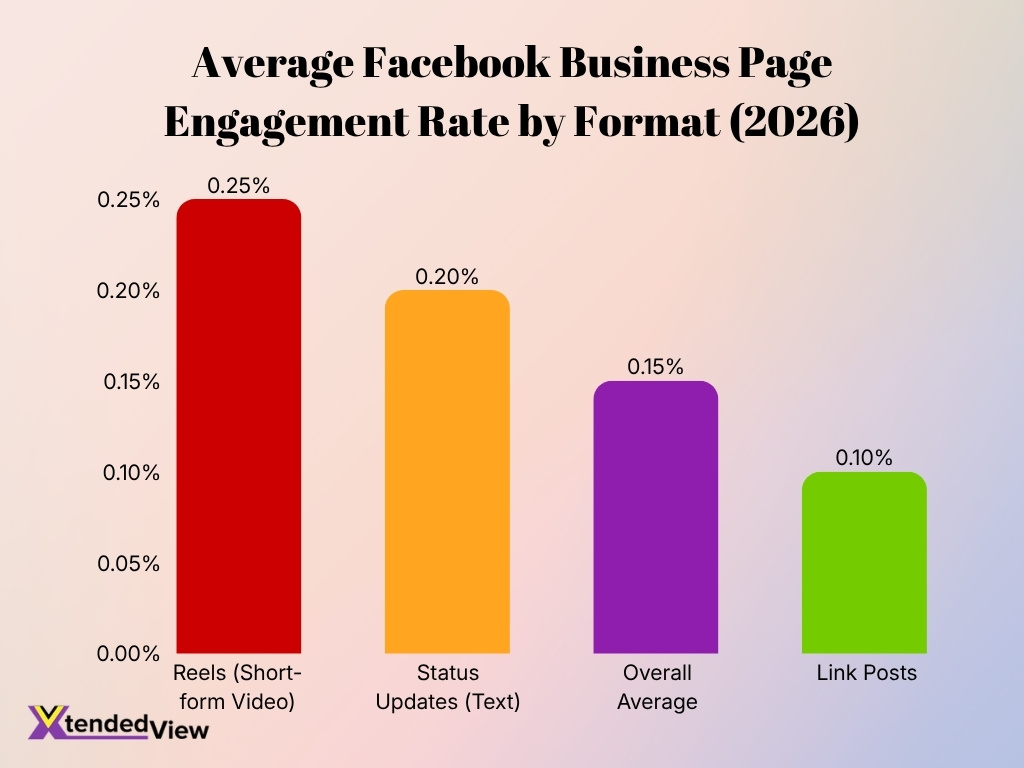
- Reels (short-form video) generate the highest average engagement rate at 0.25%, outperforming every other content format listed.
- Status updates (text posts) achieve an average engagement rate of 0.20%, making them the second-best-performing format.
- The overall average engagement rate for Facebook Business Page content stands at 0.15% in 2026.
- Reels outperform the overall average by 0.10 percentage points, highlighting the stronger engagement potential of short-form video.
- Link posts record the lowest average engagement rate at just 0.10%, which is 0.05 percentage points below the overall average.
- The engagement rate for Reels is 2.5 times higher than link posts, showing a substantial performance gap between video-first and link-based content.
Facebook Mobile Usage Statistics
- Third-party tracking indicated that Facebook’s mobile app attracted about 2.3 billion monthly users at the start of 2025, confirming the enormous scale of its app-based audience.
- By the 2026 global benchmark, Facebook ranked fourth worldwide by active mobile-app audience, behind YouTube, WhatsApp and Instagram.
- Facebook’s active mobile-app audience produced an index score of 77.1 relative to YouTube’s 100 in the late-2025 dataset used for 2026 planning.
- Facebook ranked third globally for total time spent in social Android apps in August 2025, trailing only YouTube and WhatsApp.
- Facebook’s Android audience generated total usage time equal to 62.3% of YouTube’s total app time during August 2025, while still ranking ahead of Instagram and TikTok on aggregate time.
- The typical Facebook Android user spent an average of 67 minutes per day in the app in the dataset used for the 2026 global overview.
- 67.4% of active Facebook Android users opened the app every day in the 2025 behavioral dataset, placing Facebook second among the major social apps measured for daily-open frequency.
- Facebook ranked ninth among India’s top mobile apps by active users in 2025, reinforcing the app’s scale in the world’s largest Facebook advertising market.
- In late 2024, immediately before the 2025 reporting cycle, average monthly Facebook Android sessions declined from 304.5 to 280.2 between August and November. The trend illustrates why businesses should track frequency and time spent rather than relying only on headline audience size.
Facebook Shopping and E-commerce Statistics
- One in four young-adult daily Facebook users in the U.S. and Canada visited Marketplace each day in 2025, making the commerce surface particularly relevant for businesses targeting younger buyers.
- More than 200 million fashion items were listed on Facebook Marketplace in the U.S. by November 2025. Fashion ranked as Marketplace’s second-largest category behind home decor.
- Nearly half of surveyed shoppers in a 2025 cross-border commerce study had purchased from a foreign business during the previous six months, highlighting the international e-commerce opportunity available to social advertisers.
- Among cross-border shoppers, 62% wanted personalized shopping experiences based on their interests and preferences. Personalized social advertising can therefore play an important role in international customer acquisition.
- More than one-third of surveyed cross-border shoppers said personalized ads across the company’s platforms were a leading reason behind an international purchase.
- Around 40% of cross-border shoppers followed creators specifically to discover products and brands from other countries.
- Almost 8 in 10 Indian shoppers discovered products through social media in a 2025 retail study, and 96% of those social-media product discoverers reported doing so across Facebook, Instagram and related services.
- Three in 10 video viewers in the same retail research purchased products featured in brand videos, connecting content consumption directly with measurable shopping behavior.
- During India’s 2025 holiday shopping period, 79% of consumers who discovered products across the company’s social platforms said they ultimately purchased those products.
Facebook Social Commerce Buyers by Age Group
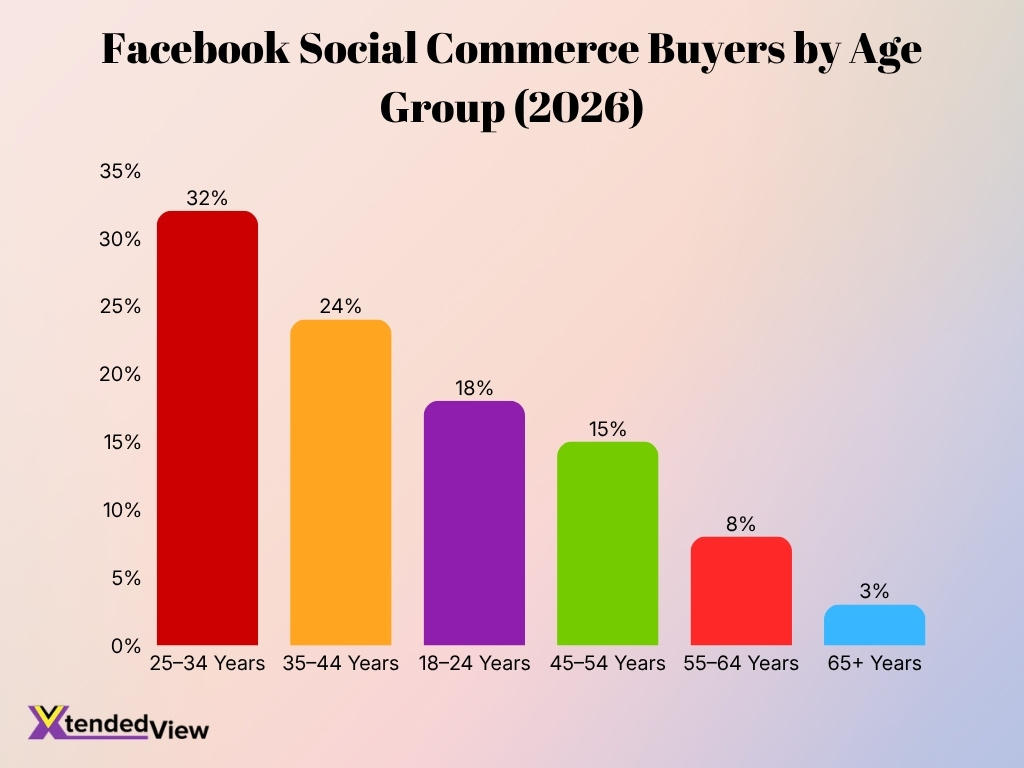
- Adults aged 25–34 represent the largest share of Facebook social commerce buyers at 32%.
- The 35–44 age group accounts for 24% of total social buyers, making it the second-largest segment.
- Younger adults aged 18–24 contribute 18% of Facebook’s social commerce buyer base.
- Buyers aged 45–54 make up 15% of the total, showing meaningful participation among middle-aged consumers.
- The 55–64 age group represents a smaller 8% share of Facebook social commerce buyers.
- Users aged 65 and older account for just 3%, the smallest share among all age groups.
- Combined, consumers aged 25–44 account for 56% of Facebook social commerce buyers, making them the platform’s dominant purchasing demographic.
Facebook ROI and Marketing Effectiveness
- U.S. advertisers using newer AI-driven advertising tools generated an average $4.52 in revenue for every $1 spent, according to research released in 2025.
- Across all U.S. advertisers in the same research, every advertising dollar generated an average of $3.71 in revenue, meaning the AI-assisted campaigns delivered a measurable performance premium.
- The newer AI advertising tools produced a 22% improvement in return on ad spend compared with the broader advertiser benchmark.
- An updated incremental-attribution model generated 24% more incremental conversions than the standard attribution model following its Q4 2025 rollout.
- Improvements to Facebook’s advertising recommendation architecture generated a 3.5% lift in ad clicks during Q4 2025. Even small percentage gains can matter at high campaign volumes.
- Changes to Facebook Stories advertising models and supporting systems produced a 12% improvement in ad quality in Q4 2025, based on measurements of relevance, usefulness, and user experience.
- In a 2025 retail campaign example, omnichannel advertising produced 3.5 times more purchase conversions than campaigns optimized only for purchases.
- The same omnichannel campaign achieved 4.3 times higher return on ad spend, illustrating how businesses can connect social advertising with both digital and physical sales channels.
- In 2026 retail research, businesses that integrated in-store transaction data with advertising measurement recorded 2 to 5 times higher ROAS, while some campaigns generated as much as nine times the incremental sales uplift.
Facebook Marketplace Business Statistics
- More than 3.5 million Marketplace listings were being posted every day in the U.S. and Canada as of March 2026.
- By July 2026, Marketplace carried approximately 430 million item listings per month worldwide, demonstrating the scale of inventory flowing through the platform.
- Approximately 44 million vehicles were listed each month globally on Marketplace in mid-2026, making automotive commerce one of its most substantial categories.
- One in three young adults using Facebook in the U.S. visited Marketplace every day by July 2026. That represents a notable increase from the one-in-four figure reported for U.S. and Canadian young adults in late 2025.
- More than 200 million fashion products had been listed on Marketplace in the U.S. by November 2025, making fashion the second-largest product category after home decor.
- Marketplace sellers can now use AI to produce a draft listing from uploaded product photos, including suggested descriptions and local price recommendations. The feature launched in March 2026.
- A new seller workflow announced in July 2026 targets people listing around 30 items per week, combining inventory management, AI listing creation, performance insights and messaging into one workflow.
- AI-assisted Marketplace listing creation can produce a description, suggested price and category tags in roughly 30 seconds, reducing the manual work involved in high-volume selling.
- Marketplace Insights allows sellers to monitor four core engagement signals: listing clicks, saves, shares and Marketplace profile follows. These metrics help businesses determine which products attract buyer interest before a sale occurs.
Facebook Lead Generation Statistics
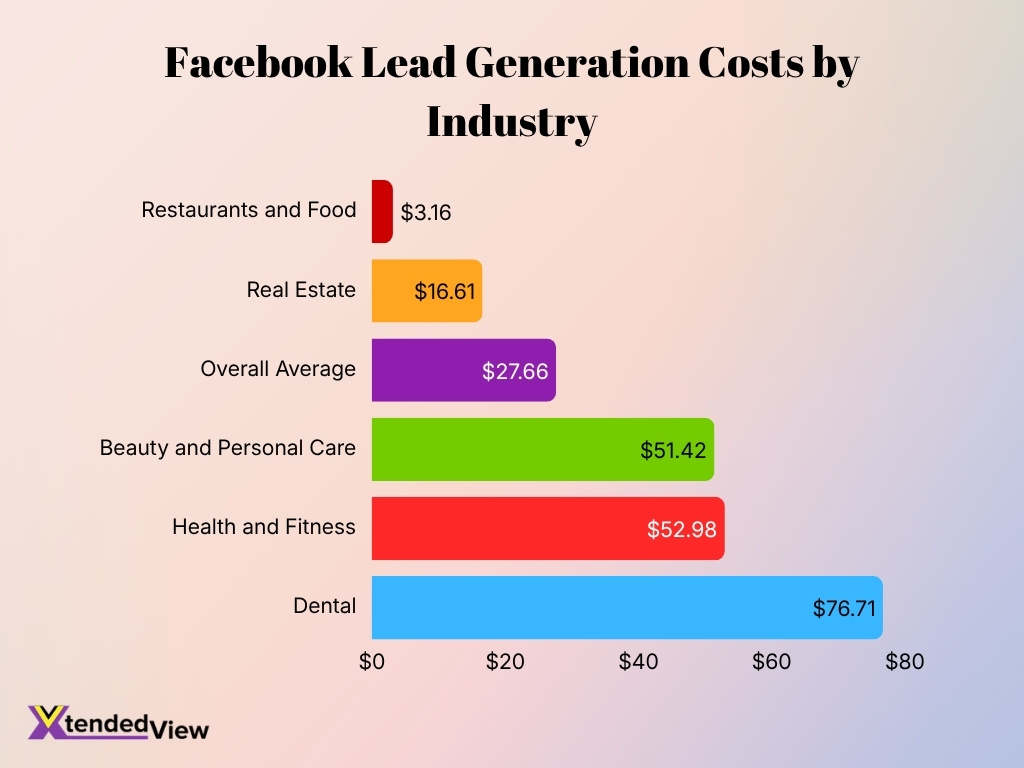
- The latest available 2025 Facebook lead-campaign benchmark reported an average $27.66 cost per lead, up from $22.87 in the previous year’s benchmark.
- Cost per lead increased 20.94% year over year, showing that businesses paid materially more to generate customer inquiries during the latest reporting period.
- Facebook lead campaigns recorded an average 7.72% conversion rate, down from 8.67% in the previous benchmark.
- The average click-through rate for lead campaigns reached 2.59%, remaining almost unchanged from 2.58% in the prior benchmark.
- Average cost per click for lead-focused Facebook campaigns was $1.92 in the 2025 benchmark.
- Restaurants and food businesses recorded the lowest average cost per lead at $3.16, alongside an 18.25% conversion rate, the highest conversion rate among the analyzed industries.
- Real estate campaigns averaged $16.61 per lead and achieved a 9.53% conversion rate, making the category substantially cheaper than the all-industry CPL average.
- Dental campaigns recorded the highest cost per lead at $76.71, showing why lead benchmarks need to account for industry economics rather than relying only on platform-wide averages.
- Health and fitness campaigns averaged $52.98 per lead, while beauty and personal care campaigns averaged $51.42. These higher acquisition costs reflect the wide spread between sectors.
Facebook Small Business Statistics
- Over 35 million U.S. businesses use the platform monthly to drive business growth.
- More than 2 million U.S. businesses run paid advertising every month across the app family.
- Personalized ad technologies drove nearly $550 billion in U.S. economic activity in 2024.
- The ad-driven economic contribution expanded by 32.5% compared to 2022.
- Targeted advertising tools supported approximately 3.4 million U.S. jobs in 2024.
- Advertising-linked employment contribution rose by 10% from 2022 levels.
- In India, 92% of active business accounts are micro, small, and medium enterprises.
- Over 1 million businesses adopted AI-powered Business Agents for messaging support by 2026.
- Targeted ad tools generated €213 billion across the EU, where small businesses make up over 99% of firms.
- Every €1 spent on ecosystem advertising generated €3.98 in revenue across the EU.
Future Facebook Marketing Trends for Businesses
- Facebook’s Feed and video ranking improvements generated a 7% increase in organic Feed and video views during Q4 2025, suggesting that recommendation algorithms will play an even larger role in business reach.
- Facebook was surfacing more than 25% additional same-day Reels compared with Q3 2025. For businesses, timely original video increasingly has an advantage over recycled content.
- Views and time spent watching original Reels roughly doubled in the second half of 2025 compared with the same period in 2024, strengthening the case for original business and creator content.
- The combined annualized revenue run rate connected with AI video-generation advertising tools reached $10 billion in Q4 2025, showing that generative creative tools are already operating at commercial scale.
- Computing capacity used to train the latest advertising-ranking model doubled in Q4 2025, pointing toward increasingly sophisticated real-time ad selection and personalization.
- Facebook’s newest AI search experience began rolling out in June 2026, using public content from sources such as Groups and Reels to generate answers. Businesses may therefore need to think about content discoverability beyond traditional Feed distribution.
- Personalized experiences across the broader ecosystem already serve approximately 3.5 billion people daily, giving AI recommendation improvements substantial scale.
- Q2 2026 advertising impressions increased 14% year over year, while average price per ad rose 12%. These increases suggest that advertisers face growing competition even as available inventory expands.
- Family daily active people reached 3.60 billion in June 2026, increasing 3% year over year and providing continued audience growth for the broader advertising ecosystem.
- Marketplace’s planned expansion of selling tools and exploration of small-business listing support point toward closer integration between local commerce, AI-assisted product listings and Facebook’s existing social graph.
Frequently Asked Questions (FAQs)
The broader family of apps averaged 3.60 billion daily active people in June 2026, up 3% year over year.
Ad impressions across the family of apps increased 14% year over year in Q2 2026, while the average price per ad increased 12%.
More than 8 million advertisers were using at least one generative AI ad creative tool in Q1 2026, with particularly strong adoption among small and midsize advertisers.
Advertisers using AI video-generation features recorded more than 3% higher conversion rates in tests reported in Q1 2026.
92% of businesses using the platforms in India were micro, small and medium enterprises as of December 2025.
Conclusion
Facebook remains commercially significant because businesses can use the platform across almost every stage of the customer journey, from awareness and product discovery to lead generation, messaging and purchase. Its large audience, strong mobile usage and established advertising infrastructure continue to make it useful for companies targeting U.S. consumers as well as international markets.
However, effective Facebook marketing now depends less on building a large follower count and more on AI-guided discovery, performance advertising, original video and measurable conversion outcomes. Recommendation systems increasingly determine organic visibility, while automated advertising tools influence targeting, bidding, creative delivery and attribution. Marketplace and Messenger also extend Facebook’s role beyond traditional social media by supporting local commerce and direct customer conversations.
For businesses, the practical takeaway is clear. Facebook still offers substantial reach, but stronger results increasingly come from combining useful original content with disciplined advertising, accurate conversion tracking and responsive customer engagement. Companies that measure business outcomes rather than surface-level engagement will have a clearer view of Facebook’s real contribution to revenue, leads and long-term customer growth.