
Robotics continues to reshape manufacturing, healthcare, logistics, and retail as businesses invest in automation to improve productivity and address labor shortages. From warehouse fulfillment centers that rely on autonomous mobile robots to hospitals that use robotic surgical systems, robotics now plays a critical role across many industries.
At the same time, advances in AI, machine vision, and collaborative robotics are expanding where robots can operate safely alongside people. These trends make robotics one of the fastest-evolving technology sectors. Explore the statistics below to understand the market’s latest developments, growth patterns, and global adoption.
Editor’s Choice
- Global industrial robot installations reached 542,000 units in 2024, marking the fourth consecutive year with more than 500,000 annual installations.
- The global market value of industrial robot installations climbed to a record $16.7 billion entering 2026.
- Asia represented 74% of all industrial robot deployments worldwide in 2024, maintaining its lead over every other region.
- China accounted for 54% of global industrial robot installations during 2024, making it the world’s largest robotics market.
- Professional service robot sales increased 9% year over year to nearly 200,000 units in 2024.
- Medical robot sales surged 91% in 2024, driven by higher demand for surgical, rehabilitation, and diagnostic systems.
- Consumer service robot shipments approached 20 million units worldwide in 2024, growing 11% from the previous year.
Recent Developments
- The robotics industry entered 2026 with industrial robot installations valued at a record $16.7 billion, reflecting continued investment in factory automation.
- Annual industrial robot deployments have exceeded 500,000 units for four straight years, signaling sustained global demand.
- Transportation and logistics robots became the largest professional service robot category, with 102,900 units sold in 2024, a 14% annual increase.
- The Robot-as-a-Service (RaaS) business model expanded rapidly, recording 42% growth during 2024.
- Professional cleaning robot sales increased 34% in 2024 as businesses expanded autonomous facility maintenance.
- Demand for surgical robots rose 41%, while rehabilitation and therapy robot sales jumped 106% in 2024.
- Diagnostic and laboratory robot sales recorded an exceptional 610% increase during 2024, reflecting rapid healthcare automation.
- Agile Robots announced plans to double revenue in 2026 after generating approximately €300 million in 2025 while expanding industrial AI robotics through acquisitions and strategic partnerships.
- AI-enabled robotics remained a top industry trend in 2026 as manufacturers increasingly integrated foundation AI models into commercial robotic platforms.
Robotics Technology Market Report
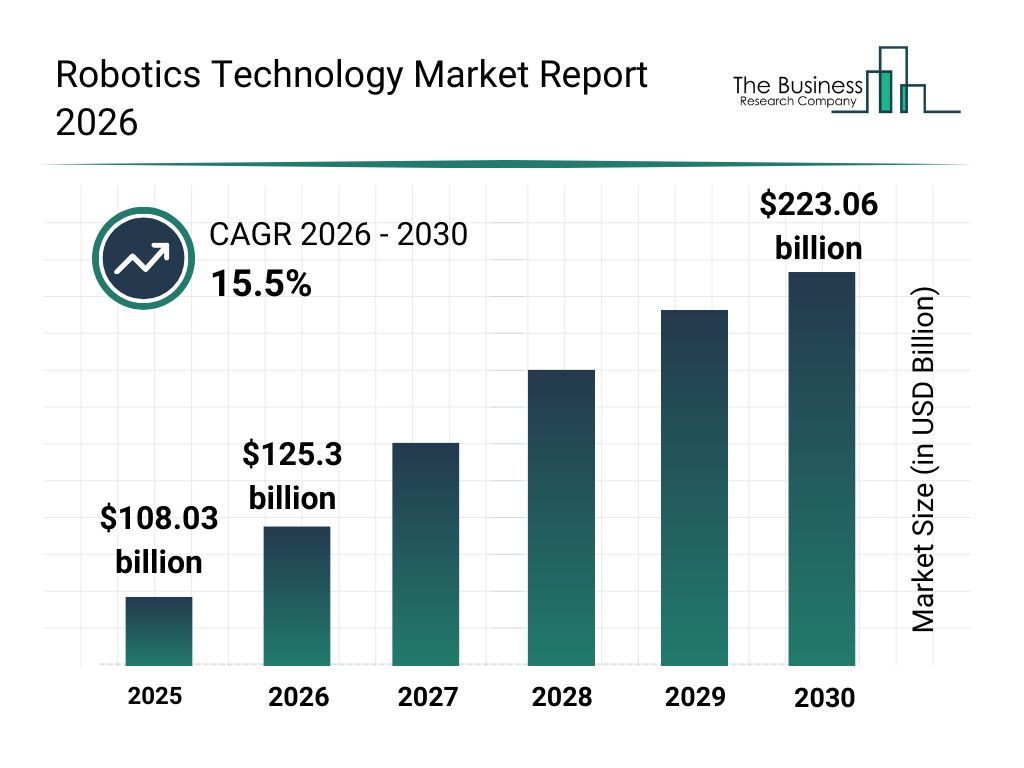
- The global robotics technology market is projected to grow from $108.03 billion in 2025 to $223.06 billion by 2030, more than doubling in market value over the forecast period.
- The market is expected to reach $125.30 billion in 2026, representing an increase of approximately $17.27 billion compared to 2025.
- The report forecasts a strong compound annual growth rate (CAGR) of 15.5% between 2026 and 2030, highlighting sustained industry expansion.
- By 2027, the robotics technology market is estimated to reach approximately $144.72 billion, reflecting continued year over year growth.
- The market is projected to surpass $167.15 billion in 2028, driven by increasing adoption of robotics across industrial and commercial sectors.
- In 2029, the global robotics technology market is expected to grow to approximately $193.06 billion, moving closer to the $200 billion milestone.
- By 2030, the market is forecast to achieve $223.06 billion, making it the highest market value recorded during the forecast period.
- Between 2025 and 2030, the robotics technology market is expected to add approximately $115.03 billion in total market value.
- The consistent upward trajectory throughout the forecast period indicates strong long-term demand and expanding investments in robotics technologies worldwide.
- The projected 15.5% CAGR positions robotics among the fastest-growing technology markets, supported by automation, artificial intelligence, and smart manufacturing trends.
Robotics Market Growth Rate
- Industrial robot installations remained above 500,000 units annually for the fourth consecutive year through 2024.
- Professional service robot sales increased 9% year over year in 2024.
- Consumer service robot sales expanded 11% during 2024.
- Medical robot sales posted a remarkable 91% annual growth in 2024.
- Rehabilitation and therapy robot sales climbed 106% in 2024, making them one of the fastest-growing medical robotics categories.
- Surgical robot demand increased 41% compared with the previous year.
- Professional cleaning robot sales rose 34% year over year in 2024.
- Security and search-and-rescue robot sales grew 19% during 2024.
- Transportation and logistics robots expanded 14% in annual sales during 2024.
Industrial Robotics Market Size
- Manufacturers installed 542,000 industrial robots globally during 2024.
- Asia accounted for 74% of worldwide industrial robot installations in 2024.
- Europe represented 16% of global industrial robot deployments in 2024.
- The Americas contributed 9% of worldwide industrial robot installations in 2024.
- China installed approximately 295,000 industrial robots during 2024, the highest annual figure ever recorded for a single country.
- Chinese manufacturers captured 57% of their domestic industrial robot market in 2024, surpassing foreign suppliers for the first time.
- Mexico’s automotive industry accounted for 63% of all industrial robot installations in the country during 2024.
- Canada installed approximately 3,800 industrial robots in 2024 after a 12% decline from the previous year.
- Canada’s automotive sector represented 47% of all industrial robot installations during 2024.
Global Industrial Robot Shipments and Installations
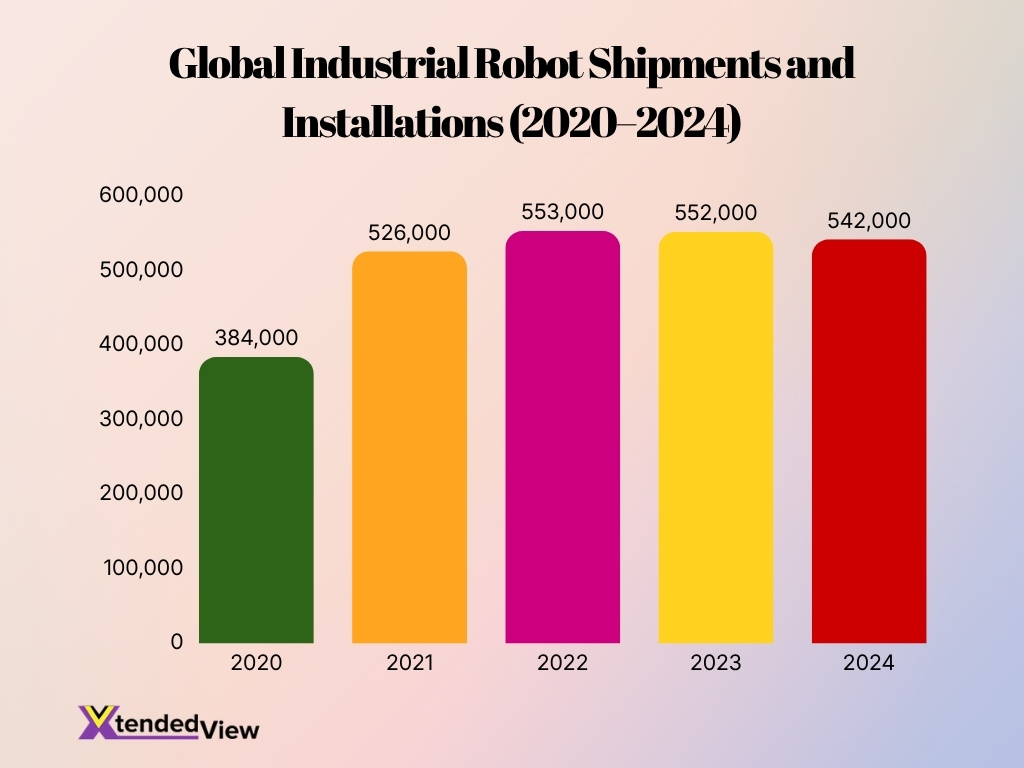
- Global industrial robot installations reached 542,000 units in 2024, representing a 1.8% year-over-year decline from 552,000 units in 2023, indicating a slight market slowdown.
- After a marginal 0.5% decline in 2020, industrial robot installations rebounded sharply in 2021, surging to 526,000 units with an impressive 37.0% annual growth.
- The market recorded its highest installation volume of 553,000 units in 2022, growing by 5.1%, making it the peak year during the 2020 to 2024 period.
- Industrial robot installations remained largely stable between 2022 and 2023, slipping by just 0.2%, with annual deployments staying above 550,000 units.
- Despite the decline in 2024, annual industrial robot installations were still 41.1% higher than in 2020, increasing from 384,000 to 542,000 units, highlighting strong long-term automation adoption.
- Over the five-year period, global industrial robot installations increased by 158,000 units, demonstrating sustained investment in manufacturing automation despite recent market headwinds.
- The data shows that 2021 delivered the fastest annual growth rate of 37.0%, while 2024 experienced the steepest decline of 1.8% during the observed period.
- Overall, the industrial robotics market maintained annual installations above half a million units from 2021 through 2024, reflecting continued global demand for factory automation and advanced manufacturing technologies.
Regional Robotics Market Share
- Asia accounted for 74% of global industrial robot installations in 2024, up from 70% in 2023. The region installed about 400,000 units during the year.
- Europe represented 16% of worldwide installations in 2024, equal to roughly 85,000 industrial robots.
- The Americas captured 9% of global installations, with approximately 50,000 industrial robots deployed in 2024.
- China installed about 295,000 industrial robots in 2024, representing 54% of all new installations worldwide.
- China held 43.5% of the global operational stock of industrial robots, with approximately 2 million units working in factories.
- Japan maintained the second-largest operational stock, accounting for 9.7% of robots in use worldwide.
- The United States and South Korea each held 8.4% of the global operational stock, placing them jointly behind Japan.
- Germany accounted for 6% of the world’s operational industrial robots, the largest national share in Europe.
- Asia averaged 182 industrial robots per 10,000 manufacturing workers, a 7.6% annual increase in the latest comparable regional density data.
Robot Density by Country
- South Korea led the world with 1,220 industrial robots per 10,000 manufacturing employees in the latest global ranking.
- Singapore ranked second with 818 robots per 10,000 manufacturing workers, supported by its small but highly automated manufacturing workforce.
- China reached 567 robots per 10,000 workers, placing third after rising from 470 in the previous reporting cycle.
- Germany recorded 449 robots per 10,000 manufacturing employees, the highest density among Europe’s major manufacturing economies.
- Japan followed closely with 446 robots per 10,000 workers, reflecting its long-standing strength in automotive and electronics automation.
- The United States reached 295 robots per 10,000 manufacturing employees in 2024 and ranked 10th worldwide.
- China’s robot density more than doubled between 2019 and 2023, rising to 470 units per 10,000 workers before advancing again in the latest ranking.
- Global robot density increased from 163 to 177 units per 10,000 manufacturing workers in one year.
- South Korea’s density exceeded the worldwide average by almost seven times, showing the scale of automation in its electronics and automotive factories.
Leading Robotics Companies by Market Cap
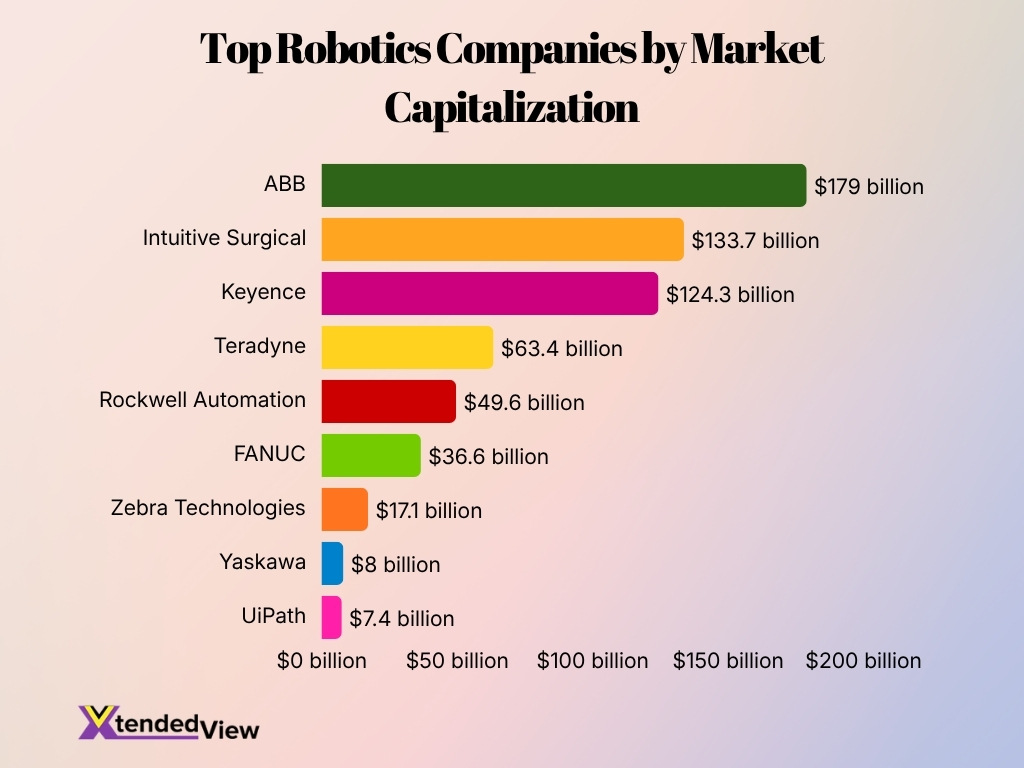
- ABB carried a market capitalization of approximately $179 billion, making it one of the largest publicly traded companies with major industrial automation and robotics exposure.
- Intuitive Surgical had a market cap of about $133.7 billion at a share price near $374.66.
- Keyence reached a market value of approximately $124.3 billion, supported by its factory sensors, machine-vision equipment and automation systems.
- Teradyne recorded a market capitalization of roughly $63.4 billion, including exposure to collaborative and autonomous mobile robots.
- Rockwell Automation held a market cap of approximately $49.6 billion at a share price near $446.98.
- FANUC had a market capitalization of about $36.6 billion, placing it among the largest dedicated industrial robot manufacturers.
- Zebra Technologies reached a market value of approximately $17.1 billion, reflecting its role in warehouse automation, machine vision and data capture.
- Yaskawa carried a market capitalization of roughly $8 billion, based on its reported value of about ₹759 billion in August 2026.
- UiPath had a market cap of approximately $7.4 billion, although its core business focuses on software automation rather than physical industrial robots.
Top Robotics Companies by Revenue
- Intuitive Surgical generated approximately $10.1 billion in 2025 revenue, up 21% from $8.35 billion in 2024. Growth came from higher procedure volumes, system placements, and recurring instrument sales.
- FANUC expected fiscal 2025 sales to exceed ¥800 billion for the first time since its record fiscal 2022 performance. Robotics sales improved in China and the Americas during the first half.
- KUKA generated €3.90 billion in 2025 revenue, an increase of €164.9 million from the previous fiscal year.
- KUKA’s 2024 sales totaled approximately €3.7 billion, down 7.9% year over year as weak industrial investment affected demand.
- ABB’s robotics business produced $2.3 billion in 2024 revenue, accounting for about 7% of the group’s total sales.
- Yaskawa’s robotics segment generated ¥237.4 billion in fiscal 2024 revenue, a 1.2% increase from the prior year.
- Yaskawa’s robotics operating profit reached ¥23.75 billion, although it declined 5.6% as project mix and costs affected margins.
- Teradyne’s robotics division generated $365 million in 2024, including $293 million from Universal Robots and $72 million from Mobile Industrial Robots.
- Agile Robots produced approximately €300 million in 2025 revenue and targeted a twofold increase in 2026 as it expanded factory automation operations.
Collaborative Robots (Cobots) Statistics
- The global collaborative robot market was valued at approximately $1.42 billion in 2025 under one market estimate.
- The same forecast expects the cobot market to reach $3.38 billion by 2030, representing an 18.9% compound annual growth rate.
- North America’s collaborative robot market reached an estimated $370 million in 2025.
- North American cobot revenue could rise to $910 million by 2030, reflecting a 19.4% annual growth rate.
- Europe’s collaborative robot market was valued at approximately $410 million in 2025.
- Europe’s market could reach $810 million by 2030, expanding at a 14.4% compound annual rate.
- A separate 2026 estimate valued the worldwide cobot market at $3.4 billion, illustrating how market definitions vary across research providers.
- That forecast projects the cobot market will reach $12.6 billion by 2033, with a 20.6% compound annual growth rate from 2026.
- Universal Robots generated $293 million in 2024 revenue, accounting for about 80% of Teradyne’s robotics segment sales.
- Cobots continue to gain adoption because manufacturers can deploy them for machine tending, palletizing, welding and assembly without building fully isolated production cells. Market forecasts also cite easier programming and lower deployment barriers as growth drivers.
Surgical Robotics Statistics
- Approximately 3.15 million procedures used da Vinci systems in 2025, up 18% from 2.68 million procedures in 2024.
- The worldwide installed base reached 11,106 surgical systems at the end of 2025, representing 12% growth from 9,902 systems one year earlier.
- Health care providers added 1,721 systems in 2025, 13% more than the 1,526 systems placed during 2024.
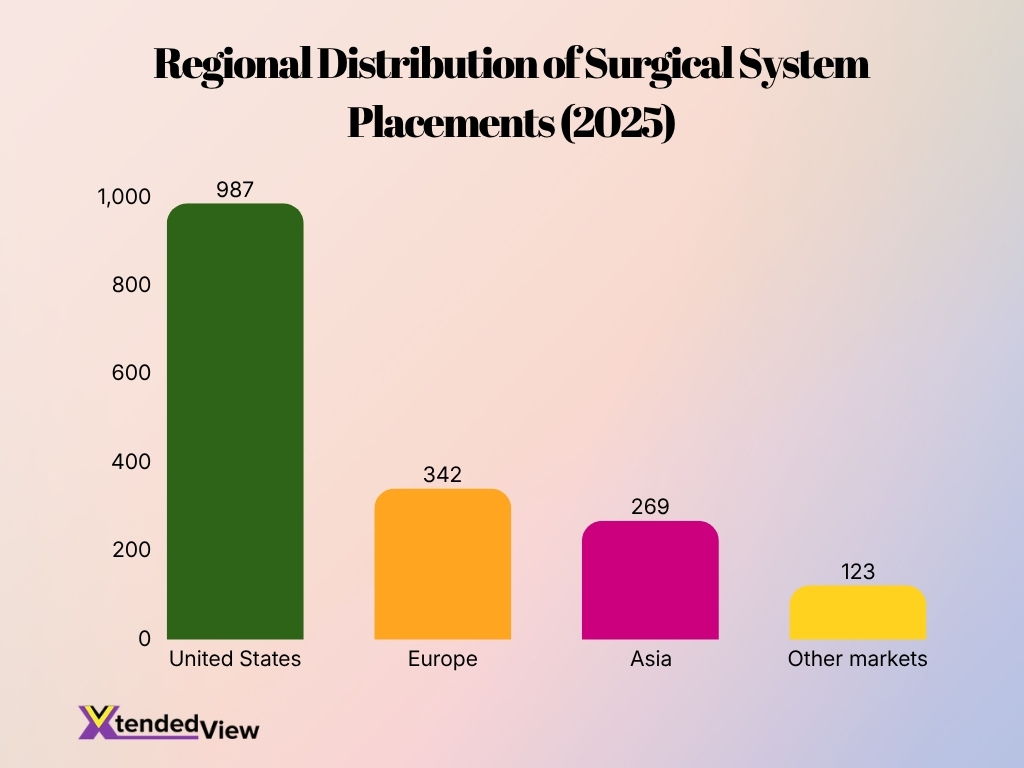
- The U.S. received 987 system placements in 2025, while Europe received 342, Asia received 269 and other markets received 123.
- Fifth-generation system placements climbed to 870 units in 2025, compared with 362 units in 2024.
- U.S. general surgery procedures performed with the platform increased 18% in 2025, led by cholecystectomy, hernia repair, appendectomy and colorectal procedures.
- Procedures outside the U.S. grew 23%, while international general surgery procedures increased 31% during 2025.
- Robotic-assisted lung biopsy procedures reached approximately 144,100 in 2025, up 51% from about 95,500 in 2024.
- A competing platform received U.S. clearance for urologic procedures in December 2025. Prostatectomy, nephrectomy, and cystectomy together represent roughly 230,000 U.S. surgeries per year.
- Outside the U.S., that platform had supported tens of thousands of procedures across more than 30 countries and five continents by late 2025.
Service Robots Statistics
- Global sales of professional service robots approached 200,000 units in 2024, increasing 9% from the previous year.
- Transportation and logistics companies purchased approximately 102,900 professional service robots, making logistics the largest application category.
- Logistics robot sales grew 14% year over year as warehouses, factories and distribution centers expanded autonomous material movement.
- Hospitality businesses purchased more than 42,000 service robots in 2024 for delivery, guidance, food service and customer-facing tasks.
- Professional cleaning robot sales surpassed 25,000 units, increasing 34% from the previous year.
- Medical robot sales reached approximately 16,700 units in 2024, a 91% annual increase.
- Surgical robot sales rose 41%, while rehabilitation and therapy robot sales increased 106% during the same period.
- Diagnostic and laboratory robot sales expanded 610% in 2024, although this category started from a smaller shipment base.
- Consumer service robot sales approached 20 million units, led primarily by robots used for household cleaning and maintenance.
- The global service robotics market generated an estimated $36.1 billion in 2024 and could reach $166.6 billion by 2034 at a 17.1% compound annual growth rate.
Warehouse and Logistics Robotics Statistics
- The world’s largest warehouse robot fleet passed 1 million deployed units in June 2025, up from fewer than 10,000 robots in 2013.
- Robotic systems now assist with approximately 75% of deliveries handled through that global fulfillment network.
- A new AI fleet-management model aims to improve warehouse robot travel efficiency by 10%, reducing congestion and unnecessary movement.
- More than 700,000 employees received training designed to help them work with robotics, automation and related technologies.
- Deliveries processed per employee rose from about 175 in 2015 to nearly 3,870 in 2025, although automation represents only one factor behind that productivity increase.
- The warehouse robotics market increased from an estimated $9.33 billion in 2025 to $10.96 billion in 2026.
- Market revenue could reach $24.55 billion by 2031, which would represent a 17.5% compound annual growth rate from 2026.
- Another market estimate places 2026 warehouse robotics revenue at $11.63 billion and projects it will reach $44.58 billion by 2035.
- Warehouse automation order intake was forecast to grow 7% in 2025, revised upward from an earlier projection of 1%.
- A large-scale robotic package-picking study evaluated more than 2 million picking attempts and reduced failure rates by 20% through machine-learning-based adjustments.
Robotics Industry Growth Drivers
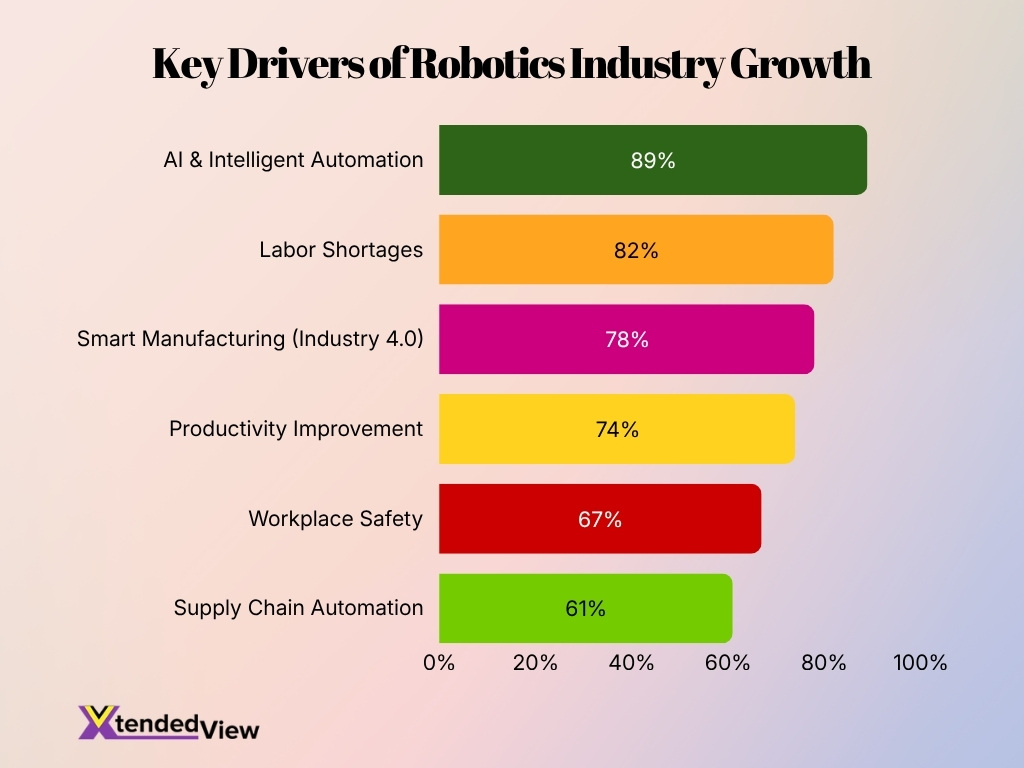
- AI & Intelligent Automation is the leading growth driver, with 89% of organizations prioritizing it to improve operational efficiency, decision-making, and production capabilities.
- Labor shortages remain a major catalyst for robotics adoption, as 82% of organizations are investing in automation to address workforce gaps and rising labor costs.
- Smart Manufacturing (Industry 4.0) is a strategic priority for 78% of organizations, reflecting the increasing integration of connected factories, IoT, and advanced robotics.
- Productivity improvement is a key objective for 74% of businesses, highlighting the role of robotics in boosting output, reducing downtime, and optimizing workflows.
- Workplace safety influences robotics investments for 67% of organizations, as companies deploy robots to perform hazardous, repetitive, and physically demanding tasks.
- Supply chain automation is prioritized by 61% of organizations, demonstrating the growing use of robotics to streamline logistics, warehouse operations, and order fulfillment.
- The data indicates that technology advancement, workforce challenges, and operational efficiency are the primary forces accelerating robotics adoption across industries.
- With all six growth drivers exceeding 60%, organizations are increasingly viewing robotics as a long-term investment to improve competitiveness, resilience, and business performance.
AI Robotics Market Statistics
- One market estimate values AI-enabled robots at $6.11 billion in 2025 and projects revenue of $33.39 billion by 2030.
- That forecast implies a 40.4% compound annual growth rate between 2025 and 2030.
- A second estimate places the AI robotics market at $7.38 billion in 2025, reflecting differences in how researchers define robotic hardware, software, and AI services.
- Under that broader forecast, the market could reach $57.46 billion by 2032, expanding at a 34.07% annual rate from 2026.
- Another market definition estimates AI in robotics revenue will increase from $23.01 billion in 2025 to $29.78 billion in 2026.
- The year-over-year increase in that forecast equals 29.4%, driven by machine learning, computer vision, and greater demand for autonomous operations.
- AI-based fleet orchestration can improve travel efficiency across a warehouse robot network by 10%, showing how software can raise the output of existing hardware.
- A machine-learning package-picking framework cut robotic pick failures by one-fifth compared with a heuristic baseline.
- Fifth-generation surgical robots offer more than 10,000 times the computing power of the previous generation, supporting force measurement, workflow tools and digital analysis.
- Research on cooperative warehouse robots found one multi-agent learning method achieved a mean return of 3.25, compared with 0.38 for an alternative approach, although scaling beyond small fleets remains difficult.
Robotics Funding and Investment
- Robotics startups raised $18.8 billion during the first part of 2026, already exceeding the $15 billion invested throughout 2025.
- The 2026 total also surpassed the previous annual high of $14.1 billion, recorded during the 2021 venture funding boom.
- Humanoid robotics startups attracted approximately $8.7 billion in 2026, nearly twice the segment’s full-year 2025 total.
- Figure raised more than $1 billion in a 2025 funding round that valued the company at $39 billion, up from a $2.6 billion valuation in its previous round.
- Apptronik raised $350 million in February 2025 to scale production of its Apollo humanoid robot for manufacturing and logistics operations.
- The company added a $520 million round in February 2026, backed by strategic investors from the technology and automotive sectors.
- Generalist AI raised $400 million at a $2 billion valuation in 2026 and later entered discussions for financing at a possible $3 billion valuation.
- Humanoid raised $152 million in a Series A round in July 2026, producing a post-money valuation of $1.35 billion.
- Agile Robots has raised approximately $1.5 billion since its founding and used part of that capital to complete more than a dozen acquisitions.
- A planned robotics IPO in China aimed to raise about 4.2 billion yuan, or $620 million, against a potential company valuation of approximately $7 billion.
Top Investors in the Robotics Sector
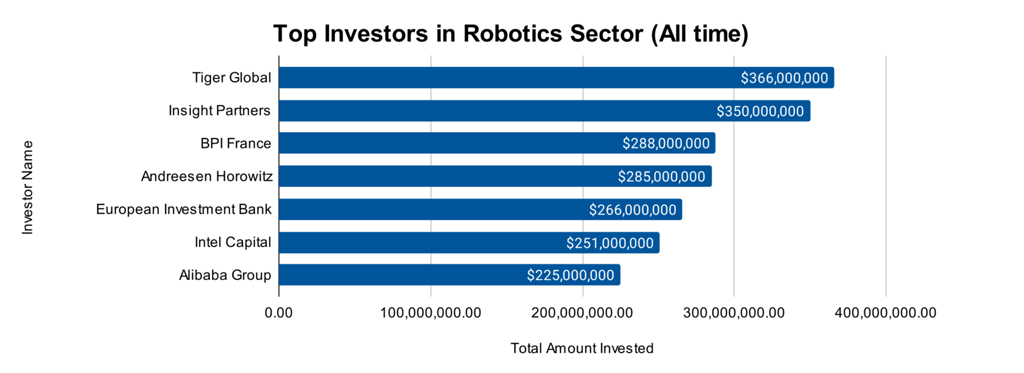
- Tiger Global is the largest investor in the robotics sector, with a total investment of $366 million, highlighting its strong commitment to robotics innovation and emerging automation technologies.
- Insight Partners ranks second, investing $350 million, trailing Tiger Global by just $16 million, indicating intense competition among leading venture investors.
- BPI France secured the third position with $288 million in robotics investments, demonstrating significant public sector support for robotics startups and industrial innovation.
- Andreessen Horowitz follows closely with $285 million invested, only $3 million behind BPI France, reflecting the firm’s continued focus on high-growth robotics and AI companies.
- The European Investment Bank has committed $266 million to the robotics industry, underscoring Europe’s strategic investment in advanced manufacturing and automation.
- Intel Capital invested $251 million, making it one of the leading corporate venture investors backing robotics technologies and next-generation hardware.
- Alibaba Group rounds out the list with $225 million invested, emphasizing growing interest from major technology companies in robotics and intelligent automation.
- The investment gap between the highest-funded investor (Tiger Global at $366 million) and the lowest-funded investor (Alibaba Group at $225 million) is $141 million, illustrating a relatively concentrated distribution among the top investors.
- The top four investors each committed more than $285 million, highlighting the substantial financial backing driving innovation across the global robotics ecosystem.
- Every investor featured in the ranking has invested more than $225 million, reflecting strong long-term confidence in the robotics industry’s growth potential and commercial opportunities.
Robotics Industry Forecasts
- Global industrial robot installations were forecast to rise 6% to 575,000 units in 2025.
- Annual installations are expected to exceed 700,000 units by 2028.
- The industrial robotics market could increase from $41.9 billion in 2026 to $78.9 billion by 2033.
- That industrial robotics forecast represents a 9.5% compound annual growth rate from 2026 through 2033.
- Asia-Pacific held an estimated 66.4% revenue share of the industrial robotics market in 2025, positioning it to remain the largest regional market.
- The broader robotics market could add $21.64 billion in revenue between 2025 and 2030, with a projected annual growth rate of 6.6%.
- Asia-Pacific is expected to contribute 56.7% of that incremental growth, supported by factory automation and large-scale manufacturing investment.
- The warehouse robotics market could rise to $24.55 billion by 2031, more than doubling its estimated 2026 value.
- AI robot revenue could reach $33.39 billion by 2030, more than five times its estimated 2025 value under one market definition.
- Smart warehousing, including robotics and automation technologies, could grow from $31.21 billion in 2025 to $46.42 billion by 2030.
Frequently Asked Questions (FAQs)
Manufacturers installed 542,000 industrial robots in 2024, more than double the number installed 10 years earlier.
Asia accounted for 74% of global industrial robot installations in 2024, compared with 16% in Europe and 9% in the Americas.
Nearly 200,000 professional service robots were sold in 2024, representing 9% year-over-year growth.
Approximately 3.15 million procedures used da Vinci surgical systems in 2025, an 18% increase from about 2.68 million in 2024.
The fleet exceeded 1 million deployed robots in 2025, while its AI-based management system aimed to improve robot travel efficiency by 10%.
Conclusion
Robotics continues to expand across manufacturing, healthcare, logistics, and consumer applications as automation becomes a core business strategy rather than a niche investment. The latest statistics show strong growth in industrial robot installations, AI-powered robotics, warehouse automation, and surgical robotics, while funding remains robust for next-generation humanoid and intelligent robotic systems. Looking ahead, continued advances in AI, sensing technologies, and collaborative automation are expected to accelerate adoption worldwide, making robotics one of the most influential technology markets of the coming decade.