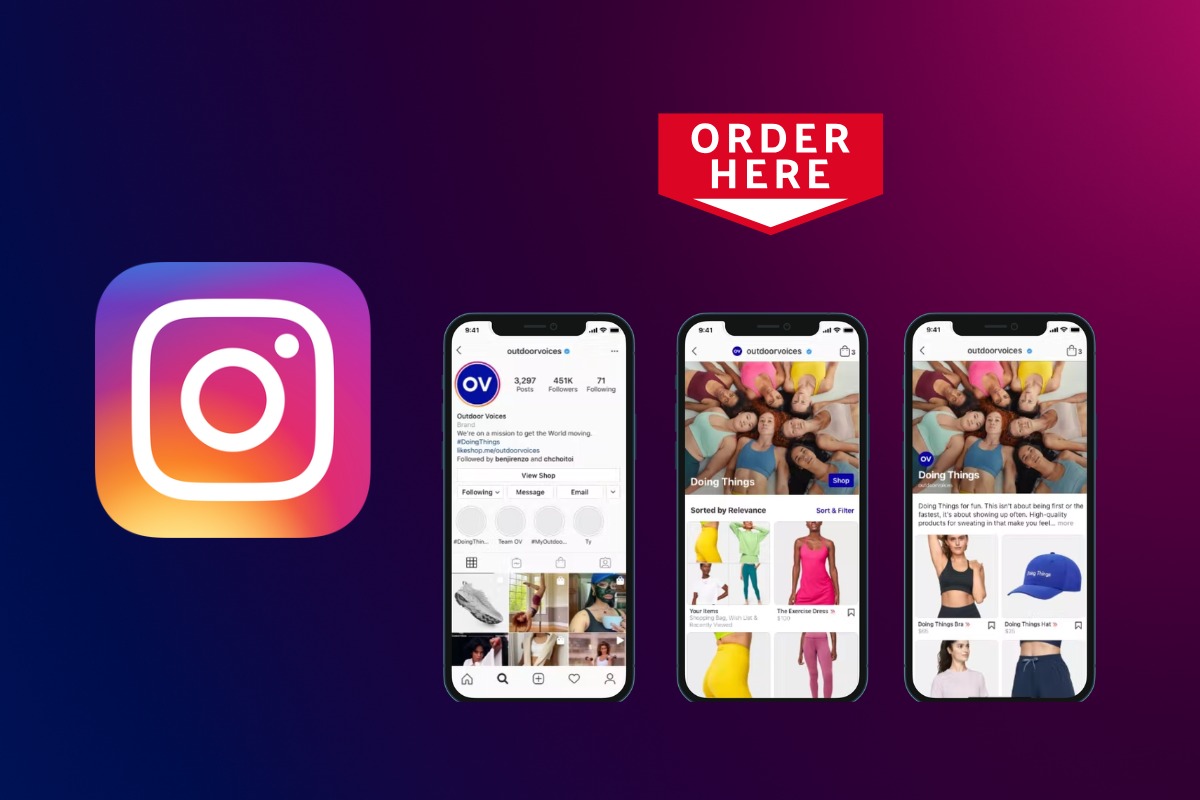
Instagram Shopping has become a core part of social commerce, helping brands turn product discovery into purchases without forcing users to leave the app. Retailers use it to launch new products, while creators and small businesses rely on shoppable content to drive direct sales and build customer relationships. As shopping features continue to expand across Reels, Stories, and product tags, marketers need reliable data to understand where growth is happening. Explore the latest Instagram Shopping statistics to see how consumers, brands, and ecommerce trends are evolving.
Editor’s Choice
- Instagram reached approximately 2.4 billion monthly active users worldwide by early 2026, providing one of the largest audiences for social commerce.
- Global social commerce revenue reached about $699 billion in 2025 and continues to expand rapidly, with Instagram remaining one of its largest commerce channels.
- 37.2% of U.S. adults identify Instagram as the social platform they are most likely to use for shopping, ahead of TikTok.
- Around 44% of Instagram users shop on the platform every week, highlighting strong purchase intent among active users.
- The average Instagram Shopping conversion rate stands at roughly 1.08% in 2026 across ecommerce stores.
- Instagram Shopping generates an average order value of about $74 across supported ecommerce businesses.
- Nearly 70% of shoppers use Instagram to discover products before making purchasing decisions online.
Recent Developments
- During 2025, Instagram continued expanding AI-powered product recommendations across shopping experiences to improve product discovery.
- Instagram’s growing video ecosystem increased commerce opportunities as users now spend nearly two-thirds of their Instagram time watching videos.
- Product tags in Reels generate around 37% more clicks to product pages than standard feed posts.
- Instagram is projected to contribute more than half of Meta’s U.S. advertising revenue by 2025, reflecting continued investment in shopping and monetization features.
- Industry analysts expect Instagram to remain Europe’s largest social commerce revenue platform despite increased competition from TikTok Shop.
- User-generated content within shoppable posts converts 4.5 times better than professional product photography for many brands.
- More retailers now combine Instagram Shopping with AI-powered catalog management and automated advertising to improve campaign performance.
- Analysts continue to note that Meta does not publicly disclose Instagram Shopping GMV, meaning platform-specific revenue estimates rely on third-party market models.
Instagram Shopping Market Overview
- Worldwide ecommerce revenue reached approximately $3.66 trillion in 2025, creating favorable conditions for continued social commerce growth.
- Global ecommerce revenue is projected to approach $4.96 trillion by 2030, supporting sustained expansion of Instagram Shopping.
- Worldwide social commerce revenue reached approximately $699 billion during 2025 and is forecast to continue growing through 2030.
- The United States remains one of Instagram’s largest commercial markets, both for platform traffic and advertiser investment.
- Instagram increasingly functions as a complete commerce ecosystem, combining product discovery, creator marketing, checkout, and advertising into a single customer journey.
- Industry research consistently ranks Instagram among the world’s leading social commerce platforms alongside TikTok and Facebook.
- Ecommerce brands continue allocating larger portions of digital marketing budgets to Instagram because of its strong visual merchandising capabilities and mature advertising platform.
- Market analysts expect Instagram Shopping to benefit further from continued investment in AI recommendations, creator commerce, and short-form video experiences.
Instagram Shopping Adoption Across U.S. Generations
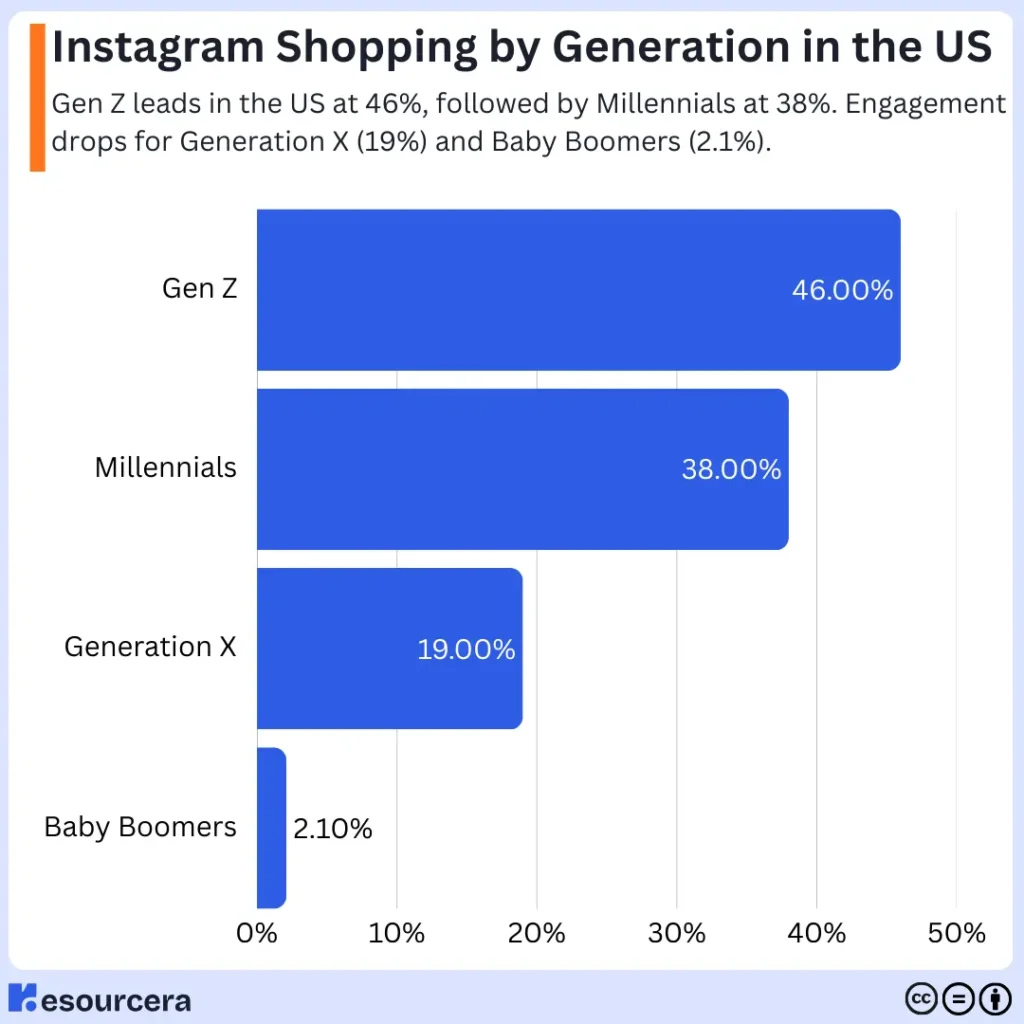
- Gen Z leads Instagram shopping, with 46% purchasing through the platform.
- Millennials rank second, recording a strong shopping rate of 38%.
- Instagram shopping participation falls to 19% among Generation X.
- Only 2.1% of Baby Boomers use Instagram for shopping.
- Gen Z’s shopping rate is 8 percentage points higher than Millennials.
- Millennials are twice as likely to shop on Instagram as Generation X.
- Gen Z is nearly 22 times more likely to shop on Instagram than Baby Boomers.
- The data shows Instagram shopping is heavily concentrated among younger U.S. consumers.
Global Instagram Shopping Revenue Statistics
- Meta does not publicly disclose Instagram Shopping revenue, making third-party estimates the primary source for market analysis.
- Worldwide social commerce generated approximately $699 billion in revenue during 2025.
- Analysts expect social commerce to maintain double-digit annual growth throughout the remainder of the decade.
- Instagram continues to account for one of the largest shares of social commerce activity because of its integrated shopping features and advertising ecosystem.
- Ecommerce spending worldwide reached approximately $3.66 trillion in 2025, providing a strong foundation for Instagram Shopping growth.
- Ecommerce revenue is projected to approach $4.96 trillion by 2030, expanding opportunities for social-first retail strategies.
- Instagram remains one of the most valuable platforms for brands investing in creator-led commerce and visual product merchandising.
- Industry forecasts expect Instagram to remain among the highest-revenue social commerce platforms globally through the second half of the decade.
Instagram Shopping Revenue by Region
- In 2024, Instagram generated approximately $37.2 billion in global social commerce revenue.
- The United States had 46.8 million active shoppers buying directly on Instagram in 2024.
- Over 42% of social media users in the United States have purchased at least one product through Instagram.
- The Asia-Pacific region dominates the industry by accounting for over 72% of the global social commerce market.
- India remains the largest audience globally with over 390 million active Instagram users driving social commerce.
- European markets like Spain and Portugal report that 57% of their consumers buy products via Instagram.
- Brazil represents Latin America’s largest growth hub with over 140 million active Instagram users.
- The Middle East and North Africa region continues its expansion with 166 million active Instagram users.
- Globally, over 200 million users interact with Instagram shopping posts or business profiles every single day.
Instagram Shopping Engagement and Purchase Behavior
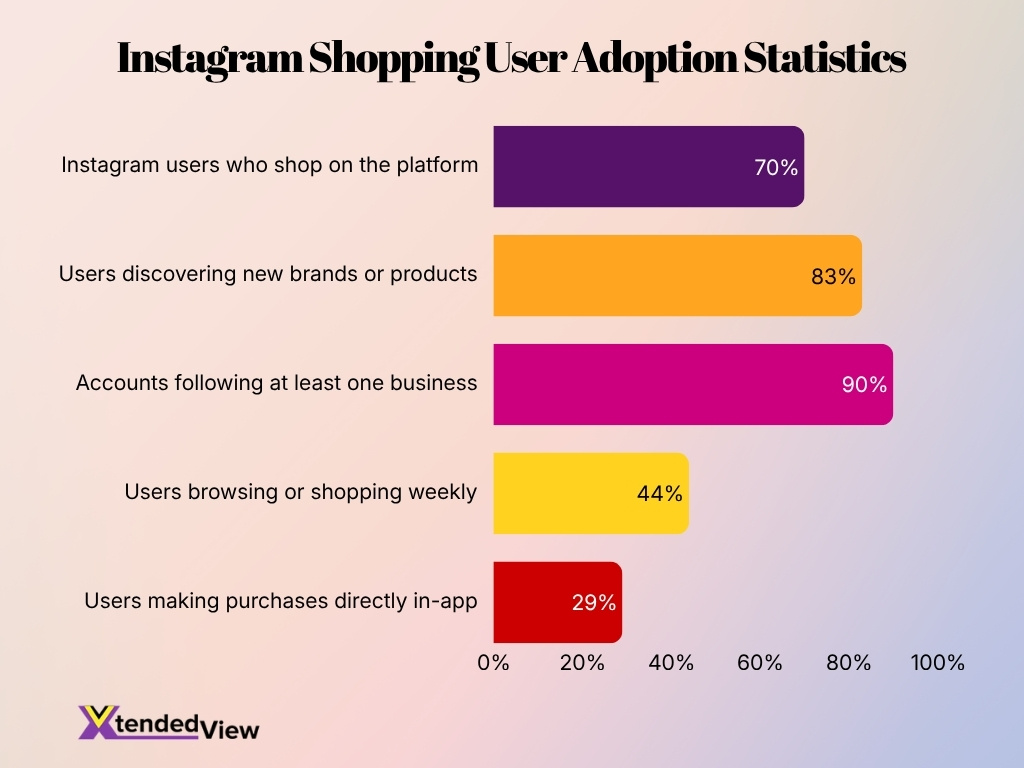
- 90% of Instagram accounts follow at least one business, highlighting how deeply brands are integrated into users’ everyday platform activity.
- 83% of users discover new brands or products on Instagram, making it a major channel for product awareness and customer acquisition.
- 70% of Instagram users shop on the platform, showing that shopping has become a core part of the overall Instagram experience.
- 44% of users browse or shop on Instagram every week, indicating consistent and recurring interest in products and brand content.
- 29% of users make purchases directly within the app, reflecting growing adoption of Instagram’s in-app shopping and checkout features.
Average Order Value and Conversion Rates on Instagram
- The average Instagram Shopping order value is about $74 across ecommerce businesses.
- Instagram Shopping delivers an average conversion rate of roughly 1.08%, although results vary by product category and campaign quality.
- Brands using product-tagged Reels generate around 37% more product-page clicks than traditional feed posts.
- User-generated shopping content converts approximately 4.5 times better than polished brand-only product images.
- Live shopping campaigns can achieve up to 10× higher conversion rates than conventional social content for participating brands.
- Indian retailers using Meta’s Omnichannel Optimization have reported 4× or higher omnichannel ROAS improvements.
- Businesses integrating in-store sales data through Conversions API have measured 2× to 5× ROAS improvements, with some industries reaching 9× incremental sales uplift.
- Retailers using business messaging have reported a 22% increase in average order value after integrating conversational commerce into the shopping journey.
Product Discovery Behavior on Instagram
- Around 70% of Instagram users use the platform to discover new products before making a purchase.
- In India, Reels delivers 81% stronger product discovery than competing short-form video experiences surveyed.
- Nearly 80% of Indian shoppers discover products through social media before purchasing.
- Social media now drives 96% of social product discovery across surveyed Indian retail consumers.
- 82% of shoppers say viral or trending products influence what they buy online.
- 62% of consumers rely on customer reviews shared on social media before purchasing products.
- Creator-generated recommendations continue to outperform traditional advertising for introducing consumers to new brands and products.
- Short-form videos have become a primary discovery format because they combine entertainment, demonstrations, and direct shopping opportunities.
Instagram Shopping Behavior by Country
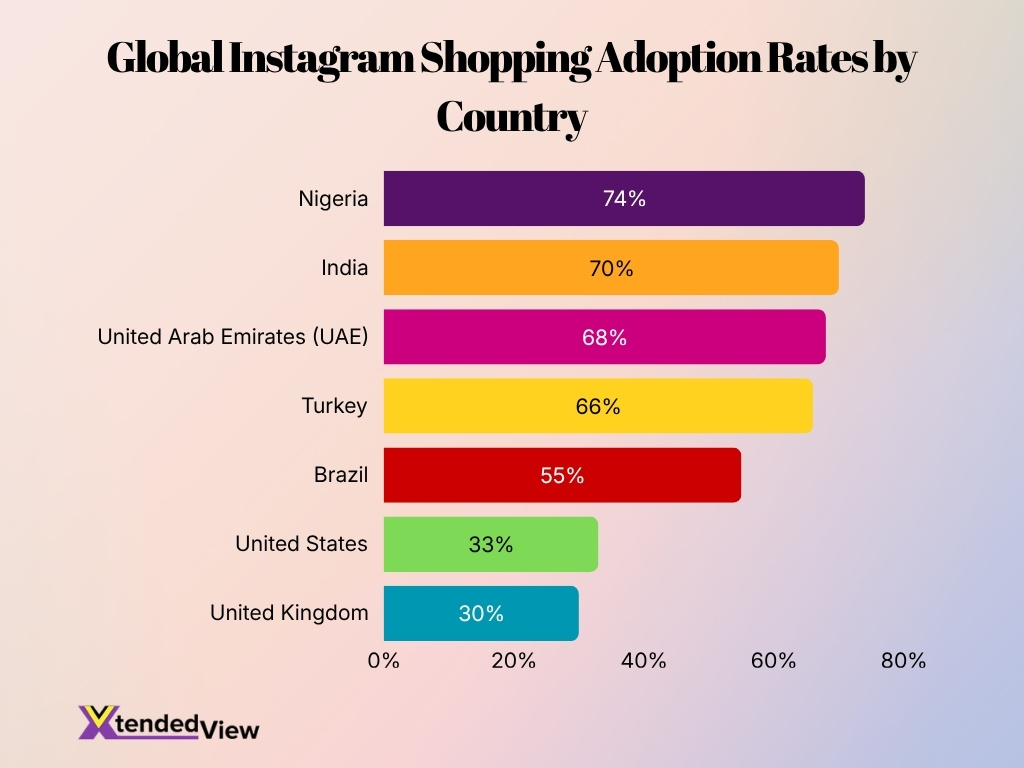
- In India, 70% of social shoppers report purchasing through Instagram, among the highest adoption rates measured.
- Nigeria records 74% Instagram shopping usage, reflecting strong mobile-first commerce adoption.
- The UAE reports 68% Instagram shopping participation, making it one of the platform’s strongest regional markets.
- Turkey records 66% Instagram shopping usage, supported by high engagement with creator content.
- Brazil reports 55% Instagram shopping participation, placing it among Latin America’s leading Instagram commerce markets.
- In the United States, 33% of social shoppers use Instagram for purchases, although Facebook currently maintains a larger share.
- The United Kingdom records 30% Instagram shopping adoption, reflecting a mature but competitive social commerce landscape.
- Country-level adoption continues to vary based on smartphone usage, digital payment penetration, ecommerce maturity, and creator economy growth.
Instagram Shopping via Reels, Stories, and Live
- 89% of Gen Z in India engage with Reels daily, making it one of the platform’s strongest commerce surfaces.
- Reels drive about 60% higher creator engagement than other surveyed short-form video platforms.
- Product-tagged Reels generate 37% more clicks than standard Instagram feed posts.
- Reels improve product discovery by 81% across surveyed Indian consumers.
- Reels influence 47% of purchase decisions, reinforcing their role in social commerce.
- Retail brands using Reels alongside creators achieve 71% stronger brand intent lift.
- Brands combining Reels with creator marketing reduce customer acquisition costs by 19% on average.
- Around 66% of shoppers globally are interested in live shopping experiences, supporting continued investment in live commerce.
Instagram Business Adoption of Shopping Features
- More than 200 million businesses use Meta’s family of apps every month to connect with customers, creating a large base for Instagram Shopping adoption.
- Retailers using Meta’s Omnichannel Optimization have reported 4× or greater improvements in omnichannel return on ad spend (ROAS) after integrating shopping campaigns.
- Businesses that connect in-store sales data through Conversions API have measured 2× to 5× ROAS improvements, with some campaigns achieving up to 9× incremental sales growth.
- Retail brands combining Reels and creator campaigns report 71% higher brand intent lift than comparable campaigns without those formats.
- Businesses using creator-led campaigns have reduced customer acquisition costs by 19% on average.
- Retailers running Business Messaging and Click-to-WhatsApp campaigns have achieved a 61% average improvement in ROAS.
- The same messaging campaigns have increased qualified leads by 62%, strengthening customer acquisition across commerce campaigns.
- Businesses integrating conversational commerce report 22% higher average order values than comparable campaigns without messaging.
Top Brands Gaining the Most Instagram Followers Daily
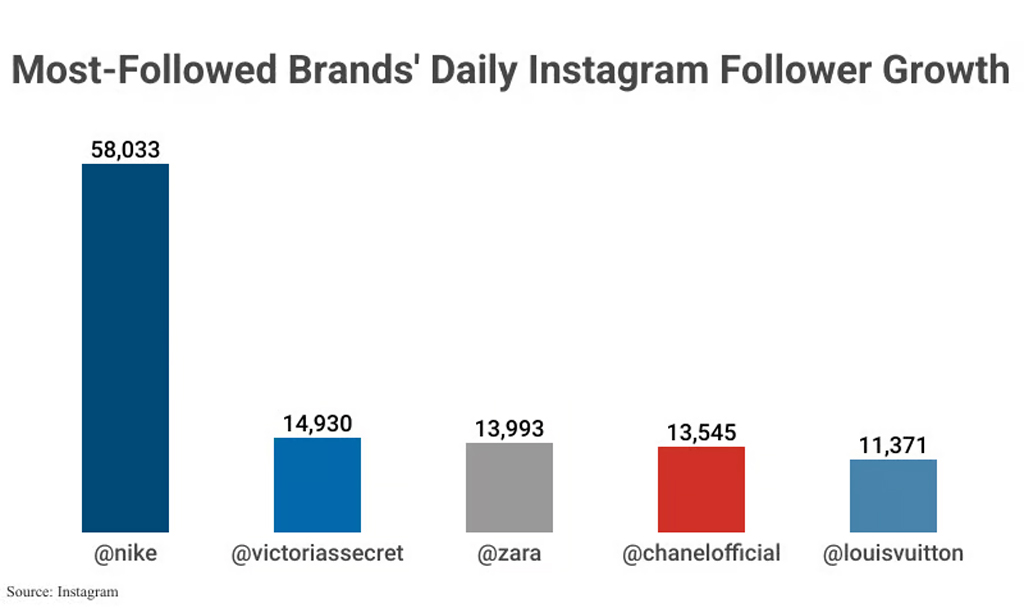
- Nike recorded the highest daily follower growth, adding 58,033 followers.
- Victoria’s Secret ranked second with 14,930 new followers per day.
- Zara gained 13,993 daily followers, placing third among the leading brands.
- Chanel added 13,545 followers per day, slightly behind Zara.
- Louis Vuitton recorded 11,371 new daily followers, the lowest among the five brands.
- Nike gained nearly four times more followers than Victoria’s Secret.
- The four fashion and luxury brands each added between 11,371 and 14,930 followers daily.
Instagram Shopping ROI for Ecommerce Brands
- Ecommerce retailers using integrated omnichannel strategies report 4×+ ROAS improvements after connecting digital and offline shopping journeys.
- Businesses combining advertising with in-store conversion measurement have achieved up to 15% revenue growth.
- Brands using Meta’s Conversions API have reported 2×–5× higher ROAS, depending on industry and campaign maturity.
- Some retail campaigns have generated up to 9× incremental sales growth after adopting AI-powered optimization tools.
- Creator-focused campaigns deliver 71% higher purchase intent, helping brands improve conversion efficiency.
- Campaigns combining creators with Reels reduce customer acquisition costs by 19%, improving marketing profitability.
- Retailers using conversational commerce report 22% higher order values, increasing revenue without proportionally increasing traffic.
- Consumers who shop across both digital and physical channels spend 2.5× more than single-channel shoppers, increasing long-term customer value.
Instagram Shopping vs Other Social Commerce Platforms
- 37.2% of U.S. adults prefer Instagram as their primary social shopping platform.
- 60% of Gen Z shoppers prefer Instagram, compared to 53% of Millennials.
- TikTok Shop boasts a 4.7% conversion rate, notably higher than Instagram’s 1.9%.
- Instagram Shopping facilitated approximately $37.2 billion in direct sales in 2024.
- Over 130 million active users engage with Instagram product tags every single month.
- Facebook remains preferred by 52% of Millennials, while TikTok Shop saw 120% growth.
- Around 82% of consumers confirm that viral products directly influence their purchase decisions.
- Nearly 66% of digital consumers express strong interest in interactive live-stream shopping experiences.
Top Product Categories Purchased Through Instagram
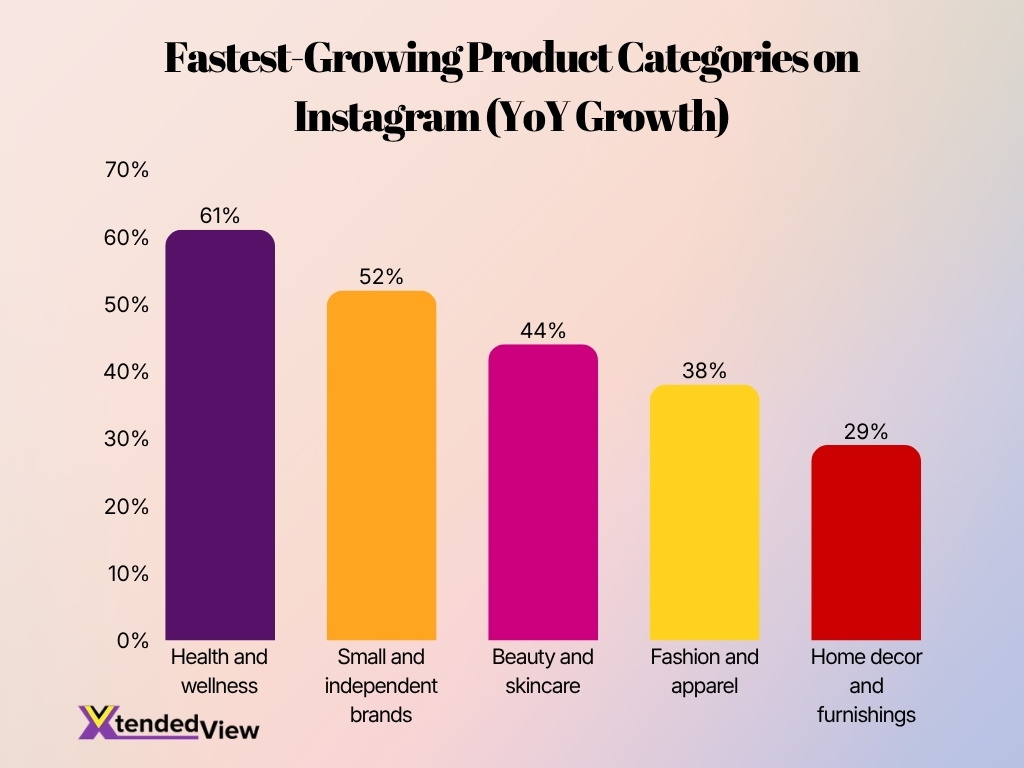
- Fashion and apparel experienced a +38% year-over-year growth in sales on the platform.
- Beauty and skincare products achieved a +44% growth driven by influencer tutorials.
- Over 72% of users have bought clothing, makeup, or fashion accessories through the app.
- Home decor and furnishings saw a +29% increase in year-over-year platform sales.
- Consumer electronics and tech capture 21.2% of total online retail purchases.
- Health and wellness leads all product categories with a massive +61% year-over-year growth.
- Food and personal care products account for 81% of the market share on Instagram Shops.
- Small and independent brands selling custom goods achieved a +52% sales growth.
Instagram Shopping Trends Over Time
- 46.8 million U.S. shoppers made a purchase directly on Instagram in 2024.
- 130 million users tap on shopping posts or product tags every single month.
- Over 200 million users interact with business profiles or shopping content daily.
- Instagram Reels drive a 22% higher engagement rate compared to traditional video posts.
- Social commerce on Instagram generated an estimated $37.2 billion in global revenue in 2024.
- Product tags increase click-through rates by 17% for brands utilizing social commerce.
- Brands using product tags see a 37% increase in sales attributed directly to Instagram.
- Reels now account for 46% of the total time users spend on the Instagram app.
- 54% of users report purchasing a product after discovering it on Instagram.
Key Reasons Consumers Use Instagram Shopping
- Discovering new products is the leading reason consumers use Instagram Shopping, accounting for 40% of users.
- Comparing brands ranks second, with 28% using the platform to evaluate different products and businesses.
- Around 20% of consumers use Instagram Shopping to buy products directly through the platform.
- Saving products for later is the least common reason, reported by 12% of users.
- Overall, the data shows Instagram Shopping is used more for product discovery and research than for immediate purchases.
Frequently Asked Questions (FAQs)
Instagram has approximately 2.4 billion monthly active users worldwide.
About 44% of Instagram users shop through Instagram on a weekly basis.
The average Instagram Shopping conversion rate is approximately 1.08%.
The average order value (AOV) for Instagram Shopping is around $74 per order.
Around 70% of shoppers use Instagram as a platform for product discovery before making a purchase.
Conclusion
Instagram Shopping continues to strengthen its position as one of the world’s most influential social commerce platforms. Businesses increasingly rely on AI-powered advertising, creator partnerships, Reels, and omnichannel strategies to improve product discovery, customer engagement, and sales performance. At the same time, consumers are becoming more comfortable completing their shopping journeys through social platforms, especially in mobile-first markets. As social commerce matures, Instagram remains well positioned to connect brands and shoppers through personalized, content-driven experiences that support long-term ecommerce growth.