HP remains one of the most recognized technology companies in the world, with strong positions in personal computers, printing, enterprise infrastructure, and hybrid cloud solutions. Businesses rely on HP devices for remote work, healthcare imaging, education, and AI-driven enterprise computing, while consumers continue to use HP laptops and printers across homes and small offices. The company’s split into HP Inc. and Hewlett Packard Enterprise (HPE) reshaped its strategy and allowed both businesses to focus on separate growth markets. This article explores the latest HP statistics, revenue trends, market share data, and corporate developments shaping the company.
Editor’s Choice
- HP Inc. reported $53.6 billion in fiscal 2024 revenue, slightly down 0.3% year over year.
- HP Inc. generated approximately $55.3 billion in fiscal 2025 revenue, marking a 3.2% increase from 2024.
- HP maintained its position as the world’s second-largest PC vendor by shipments in 2024.
- Global PC shipments reached 262.7 million units in 2024, with HP remaining among the top three manufacturers worldwide.
- HP employed roughly 58,000 workers globally in 2024 before workforce reduction plans were announced for future restructuring.
- HPE recorded approximately $30.1 billion in fiscal 2024 revenue, supported by AI server demand and hybrid cloud growth.
- HPE’s AI-driven server business delivered 35% year-over-year growth during key quarters of 2024.
- HP generated more than 65% of total revenue outside the United States, highlighting its global dependence.
- HP announced plans to reduce its workforce by 4,000 to 6,000 employees through restructuring initiatives extending into 2028.
Recent Developments
- HP Inc. introduced several AI-enabled commercial PCs in 2025 to support enterprise productivity and Windows AI workloads.
- HPE expanded its AI infrastructure business with strong Nvidia-powered server demand throughout 2024 and 2025.
- HPE’s quarterly server revenue climbed to $4.3 billion during fiscal Q3 2024, up 35% year over year.
- HP’s fiscal 2025 restructuring program included expected charges of approximately $650 million.
- HPE continued integrating Juniper Networks technologies to strengthen networking and edge computing capabilities in 2025.
- HP expanded sustainability-focused product lines that include recycled materials in laptops, packaging, and printer hardware.
- HPE reported record quarterly revenue of $8.5 billion during the AI infrastructure boom.
- HP strengthened commercial PC offerings ahead of Windows 10 end-of-support upgrades expected to boost enterprise refresh cycles through 2026.
- HPE’s partner ecosystem reached nearly 90,000 partners globally, generating 60% to 70% of the company’s revenue.
- HP continued investing in hybrid work technologies, including AI-enhanced conferencing, remote management, and security features across enterprise devices.
HP Overview and Key Facts
- HP traces its origins to 1939, when Bill Hewlett and Dave Packard founded the company in a Palo Alto garage.
- HP Inc. officially emerged in 2015 after the Hewlett-Packard split created HP Inc. and Hewlett-Packard Enterprise.
- HP Inc. focuses mainly on PCs, printers, peripherals, and hybrid work devices.
- HPE specializes in servers, storage, networking, hybrid cloud, and enterprise AI infrastructure.
- HP Inc. generated around $2.8 billion in net profit during fiscal 2024.
- HP’s notebook computer business contributed approximately $24.7 billion in revenue during fiscal 2023.
- Desktop computer revenue reached roughly $10.9 billion for HP in fiscal 2023.
- Printer supplies generated approximately $11.4 billion in HP revenue during fiscal 2023.
- HP remained part of the S&P 500 Index and ranked among the largest U.S. technology companies by revenue.
- HP’s total shares outstanding exceeded 937 million shares in late 2024.
HP Revenue and Growth Over Time
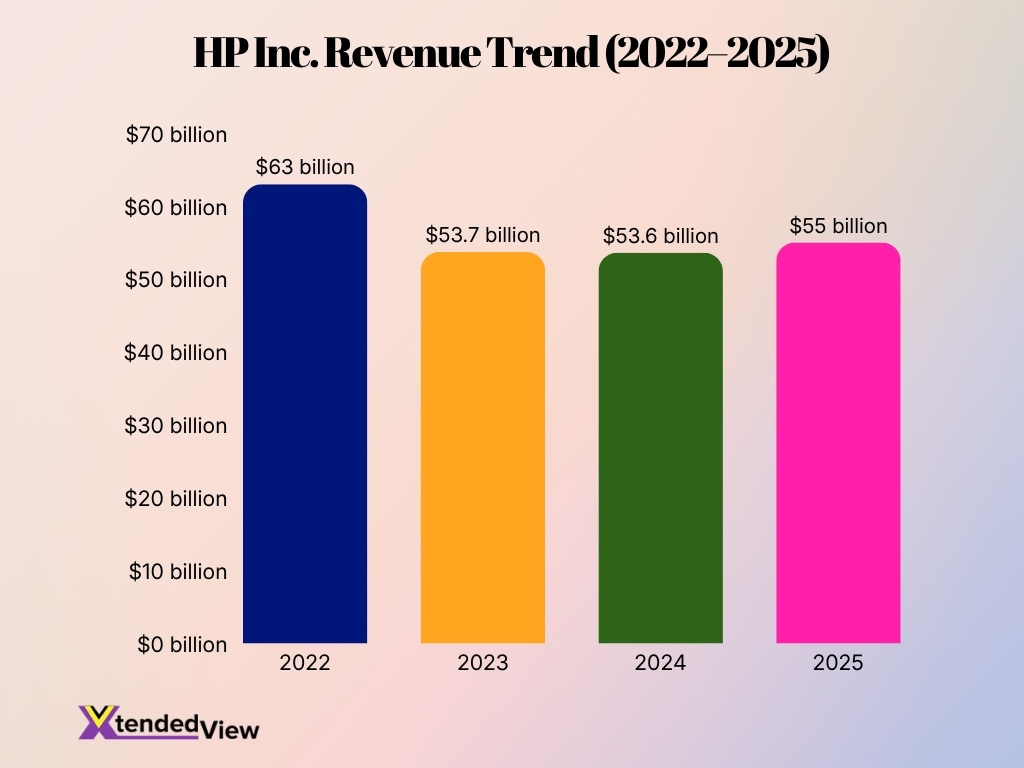
- HP Inc. generated $53.6 billion in total revenue during fiscal 2024, compared to $53.7 billion in fiscal 2023.
- HP’s revenue declined nearly 16% between 2022 and 2023, reflecting weaker PC demand after the pandemic surge.
- Fiscal 2025 revenue is projected to exceed $55 billion, supported by enterprise PC refresh cycles and AI-enabled devices.
- HP’s Personal Systems segment contributed nearly 68% of total company revenue in fiscal 2024.
- Revenue from commercial PCs increased by approximately 8% year over year during several quarters of 2024 due to enterprise upgrades.
- HP’s free cash flow reached around $3.3 billion in fiscal 2024.
- The company returned more than $3.6 billion to shareholders through dividends and stock repurchases during fiscal 2024.
- HP’s annual revenue exceeded $63 billion in fiscal 2022, making it one of the strongest post-pandemic years in company history.
- HPE reported approximately $30.1 billion in fiscal 2024 revenue, supported by AI infrastructure demand.
- HPE’s Intelligent Edge business generated over $4.5 billion in annual revenue during fiscal 2024.
HP Historical Background and Evolution
- Hewlett-Packard started with an initial investment of $538 in a Palo Alto garage in California.
- HP launched its first major product, the HP 200A audio oscillator, in the late 1930s.
- The company became one of Silicon Valley’s earliest technology success stories during the postwar electronics boom.
- HP entered the personal computer market aggressively during the 1980s and 1990s.
- HP acquired Compaq in 2002 in a deal valued at approximately $25 billion, expanding its PC leadership.
- HP surpassed $100 billion in annual sales revenue in 2007, becoming the first technology company to hit that milestone.
- The company split into HP Inc. and HPE in November 2015 to streamline operations and improve strategic focus.
- HP shifted heavily toward hybrid work solutions after the pandemic-driven remote work expansion.
- HPE evolved from a hardware-centered business into an AI and cloud infrastructure provider between 2018 and 2025.
- AI infrastructure and enterprise networking became central growth drivers for HPE by 2025.
HP Corporate Structure: HP Inc vs Hewlett Packard Enterprise (HPE)
- HP Inc. and HPE officially separated into independent publicly traded companies in 2015.
- HP Inc. retained the company’s PC and printing operations after the split.
- HPE assumed responsibility for enterprise servers, networking, cloud, and storage products.
- HP Inc. reported fiscal 2024 revenue of $53.6 billion, while HPE generated around $30.1 billion.
- HPE organized operations into five reporting segments, including Server, Hybrid Cloud, and Intelligent Edge.
- HP Inc. focused heavily on consumer and commercial hardware markets after restructuring.
- HPE increased its emphasis on AI systems and enterprise cloud infrastructure between 2023 and 2025.
- Antonio Neri continued serving as CEO of HPE through 2025.
- HP Inc. maintained headquarters operations in California, while HPE operated from Texas.
- HPE’s partner-led sales model contributed nearly 70% of total revenue in recent years.
Hewlett-Packard Enterprise Headcount Breakdown by Department
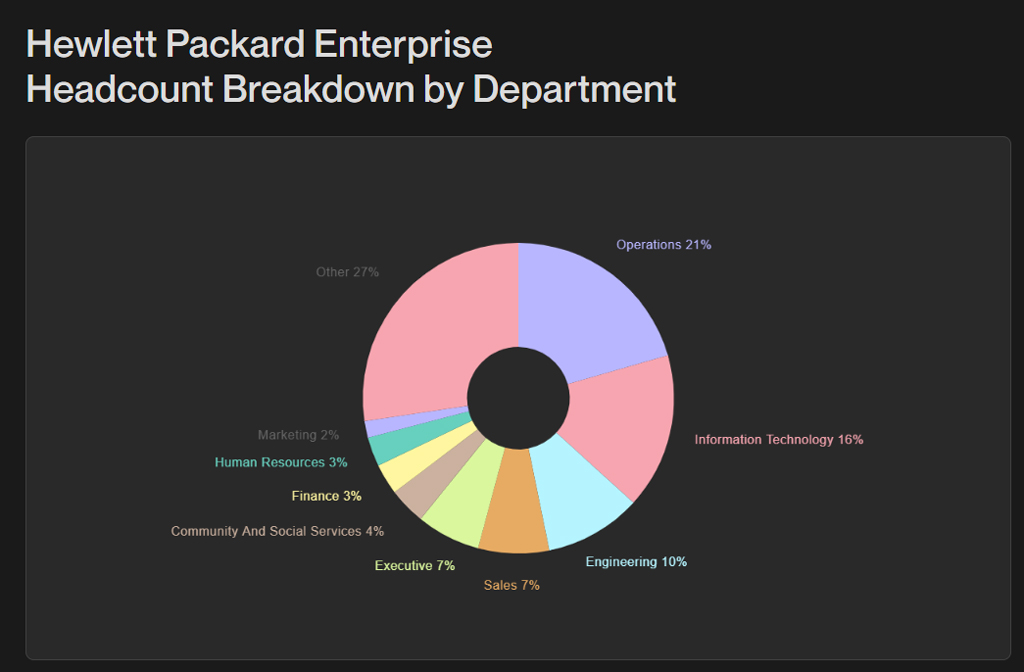
- Other departments account for the largest share, representing 27% of Hewlett Packard Enterprise’s total headcount.
- Operations is the biggest defined department, making up 21% of the workforce, showing HPE’s strong focus on operational execution and business support.
- Information Technology holds a major share at 16%, highlighting the company’s dependence on internal technology, infrastructure, and digital systems.
- Engineering represents 10% of total headcount, reflecting HPE’s continued investment in product development, enterprise technology, and innovation.
- Sales and Executive departments each account for 7%, indicating a balanced focus on revenue generation and leadership functions.
- Community and Social Services make up 4% of the workforce, suggesting a smaller but visible role for social impact, support, or community-related functions.
- Human Resources and Finance each represent 3%, showing that core administrative and business management teams form a smaller portion of the overall workforce.
- Marketing has the smallest share at 2%, indicating a lean marketing department compared with larger operational, IT, and engineering teams.
- Combined, Operations, Information Technology, and Engineering account for 47% of HPE’s headcount, making them the company’s most significant defined workforce areas.
- The data suggests that Hewlett Packard Enterprise’s workforce is heavily concentrated in operations, technology, and engineering-related roles, which aligns with its position as an enterprise technology and infrastructure company.
HP Global Presence and Headquarters
- HP Inc. operates its headquarters in Palo Alto, California.
- HPE maintains its corporate headquarters in Spring, Texas.
- HP products are sold in more than 170 countries worldwide through retail and enterprise channels.
- More than 65% of HP revenue comes from international markets outside the U.S.
- HP employed approximately 58,000 people globally during fiscal 2024.
- HPE employed around 62,000 workers globally in 2024.
- HP maintains manufacturing, logistics, and research operations across Asia-Pacific, Europe, and North America.
- HP’s commercial business remains especially strong in the U.S., India, the UK, and Latin America.
- HPE expanded AI data center partnerships globally to support enterprise cloud deployments and GPU infrastructure.
- HP’s worldwide supply chain strategy increasingly focuses on diversification outside China to reduce geopolitical risk.
HP Geographic Revenue Breakdown
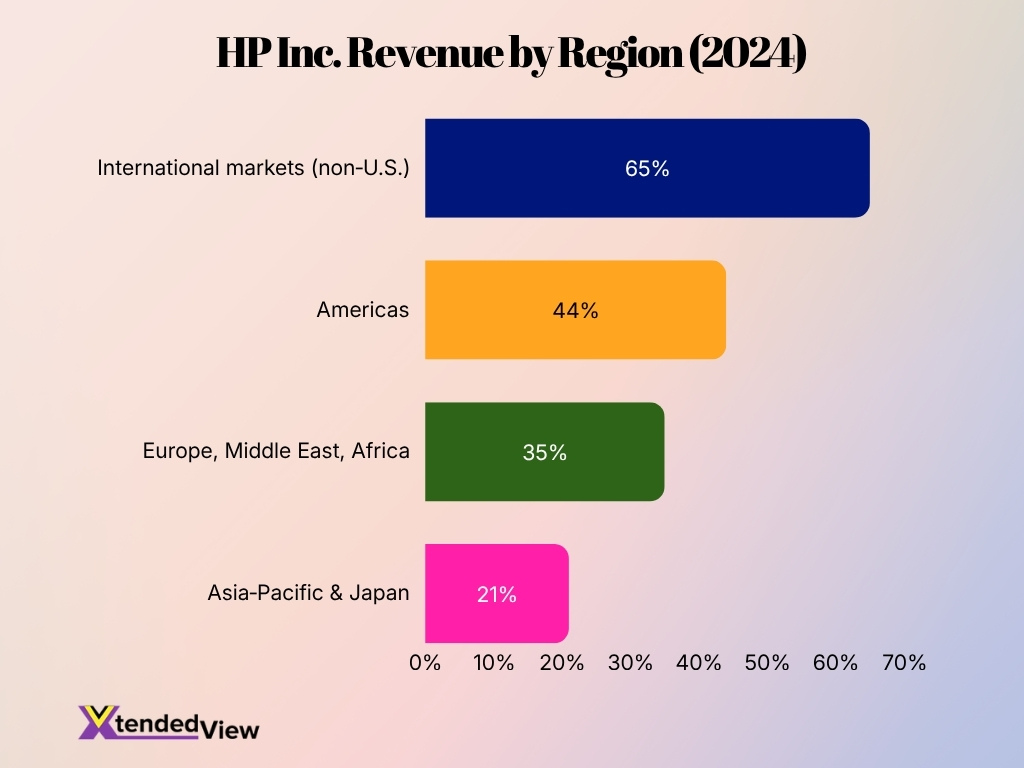
- International markets generated more than 65% of HP Inc.’s total revenue in fiscal 2024.
- The Americas represented approximately 44% of HP’s revenue during fiscal 2024.
- Europe, the Middle East, and Africa contributed nearly 35% of annual revenue in 2024.
- Asia-Pacific and Japan accounted for around 21% of HP revenue during fiscal 2024.
- India emerged as one of HP’s fastest-growing PC markets in 2024, especially in commercial notebook sales.
- HP maintained strong printer market positions in Latin America, Western Europe, and Southeast Asia.
- China remained a major manufacturing and supply chain hub for HP devices despite diversification efforts.
- HPE expanded data center partnerships across the Middle East to support AI and cloud demand.
- North American enterprise demand drove much of HPE’s AI server growth during fiscal 2024.
- HP continued shifting manufacturing capacity toward Thailand, Vietnam, and Mexico during 2024 and 2025.
HP Annual Revenue by Segment
- HP’s Personal Systems segment produced approximately $36.2 billion in revenue during fiscal 2024.
- The Printing segment contributed around $17.4 billion in fiscal 2024 revenue.
- Commercial PC sales represented nearly 72% of Personal Systems revenue in 2024.
- Consumer PC revenue declined approximately 4% year over year during fiscal 2024 due to slower household spending.
- HP’s supplies business generated more than $11 billion annually, remaining a high-margin revenue source.
- Industrial graphics and 3D printing revenue continued expanding within HP’s printing business during 2024.
- HPE’s server segment produced nearly $16 billion in annual revenue during fiscal 2024.
- HPE Hybrid Cloud revenue exceeded $5 billion during fiscal 2024.
- HPE’s Intelligent Edge segment posted operating margins above 25% in several 2024 quarters.
- Financial services operations contributed more than $3.9 billion in financing assets for enterprise customers.
HP Quarterly Revenue and Earnings Highlights
- HP Inc. reported $14.1 billion in Q4 fiscal 2024 revenue, up approximately 1.7% year over year.
- HP’s Q1 fiscal 2025 revenue increased to nearly $13.2 billion, supported by commercial PC growth.
- HP generated quarterly non-GAAP diluted EPS of $0.93 during Q4 fiscal 2024.
- HPE recorded quarterly revenue of $8.5 billion in Q3 fiscal 2024, exceeding analyst expectations.
- HPE’s server revenue climbed 35% year over year during key AI-focused quarters in 2024.
- HP’s operating profit reached approximately $1.4 billion during Q4 fiscal 2024.
- HPE’s AI system backlog surpassed $3 billion by late 2024.
- HP’s Printing segment operating margin remained near 19% during the fiscal 2024 quarters.
- Quarterly commercial PC sales improved in North America and Asia during the second half of 2024.
- HPE posted quarterly diluted earnings per share of $0.50 during fiscal Q3 2024.
Global PC Market Position
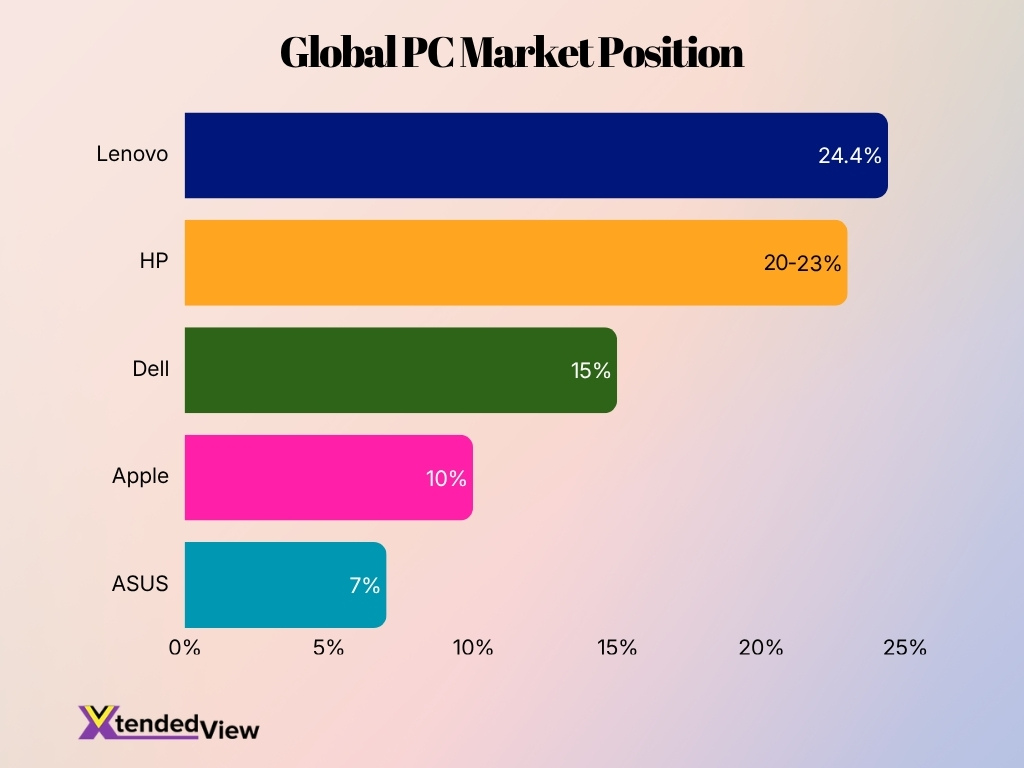
- Lenovo leads the global PC market with the highest estimated shipment share at 24.4%, making it the top-ranked PC brand in the chart.
- HP holds the second-largest position, with an estimated global PC shipment share of 20–23%, showing it remains one of the strongest competitors in the market.
- Dell ranks third with a 15% shipment share, placing it behind Lenovo and HP but ahead of Apple and ASUS.
- Apple accounts for 10% of global PC shipments, reflecting a smaller but still significant presence in the premium PC and Mac segment.
- ASUS holds a 7% share, making it the fifth-largest brand among the companies shown in the chart.
- The data shows that Lenovo and HP together control roughly 44.4–47.4% of the global PC shipment market, indicating strong concentration among the top two vendors.
- The gap between Lenovo at 24.4% and HP at 20–23% suggests Lenovo has a narrow but clear lead in global PC shipments.
- The difference between HP and Dell is notable, with HP ahead by approximately 5–8 percentage points, depending on the final HP estimate.
- Apple’s 10% share shows that while it is behind the top three PC vendors, it still maintains a strong position through its MacBook and desktop ecosystem.
- Overall, the chart highlights a competitive PC market where Lenovo, HP, and Dell dominate, while Apple and ASUS maintain meaningful but smaller shares.
HP Market Share in Printers and Imaging
- HP held approximately 39% of the worldwide printer market in several quarters of 2024.
- HP’s printing business generated roughly $17.4 billion in annual revenue during fiscal 2024.
- Printer supplies revenue exceeded $11 billion, delivering strong operating margins for HP.
- HP’s Instant Ink subscription service expanded to millions of subscribers worldwide by 2025.
- HP’s printing segment operating margins stayed close to 19% throughout fiscal 2024.
- HP remained the global leader in printer shipments during 2024 across consumer and commercial categories.
- Commercial printing demand improved in healthcare, logistics, and education sectors during 2024.
- HP maintained leadership positions in laser printers, inkjet devices, and multifunction office printers.
- Demand for home office printers remained above pre-pandemic levels despite slower consumer hardware spending.
HP Profitability and Operating Margins
- HP Inc. posted a fiscal 2024 net income of approximately $2.8 billion.
- HP’s non-GAAP operating margin remained close to 8% during fiscal 2024.
- The Printing segment consistently delivered operating margins above 18% in recent quarters.
- HP’s Personal Systems operating margin averaged approximately 6% during fiscal 2024.
- HPE generated an operating profit exceeding $2.5 billion in fiscal 2024.
- HPE’s Intelligent Edge business maintained operating margins above 25%, outperforming many infrastructure competitors.
- HP’s restructuring program aimed to deliver approximately $1.9 billion in annual savings by fiscal 2025.
- Gross margin pressure affected HP’s consumer PC business during periods of weaker demand in 2023 and 2024.
- HPE improved profitability through higher-margin AI server contracts and cloud services growth in 2024.
- HP continued prioritizing shareholder returns through dividends, buybacks, and operational efficiency initiatives.
hp.com Website Traffic Demographics
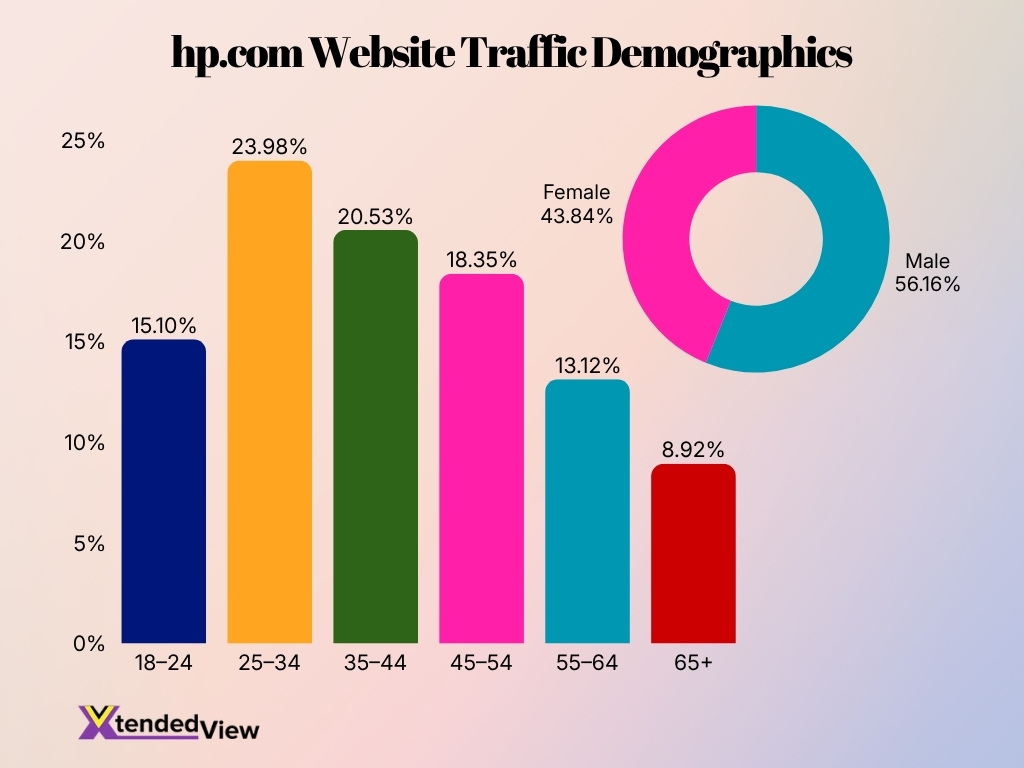
- Male visitors form the majority of hp.com’s audience, accounting for 56.16% of total traffic.
- Female visitors represent 43.84% of hp.com’s website audience, showing a fairly balanced but male-skewed visitor base.
- The 25–34 age group is the largest audience segment, contributing 23.98% of hp.com’s total website traffic.
- Visitors aged 35–44 make up the second-largest group, with 20.53% of the traffic share.
- The 45–54 age group accounts for 18.35%, indicating strong engagement from mid-career professionals and business users.
- Younger users aged 18–24 contribute 15.00% of hp.com traffic, showing notable interest from students, early professionals, and younger tech buyers.
- Older users aged 55–64 represent 13.12%, while visitors aged 65+ account for 8.92% of the total audience.
- Overall, hp.com’s traffic is strongest among users aged 25–44, who together account for 44.51% of total visitors.
- The data suggests hp.com attracts a broad audience, but its core traffic comes from working-age adults, especially those likely researching or purchasing laptops, printers, accessories, and business technology solutions.
HP Stock Performance and Market Valuation
- HP Inc.’s market capitalization fluctuated between $34 billion and $36 billion during early 2026.
- HP stock traded within a 52-week range of approximately $27 to $39 during 2025.
- HP paid quarterly dividends totaling approximately $1.10 per share annually in 2025.
- Berkshire Hathaway maintained a significant ownership position in HP during portions of 2024 and 2025.
- HP shares gained roughly 18% over a 12-month period tied to AI PC optimism and commercial refresh demand.
- HPE’s market capitalization exceeded $25 billion during the 2025 trading periods.
- HPE stock rose sharply in 2024 following strong AI server revenue growth and enterprise cloud expansion.
- HP maintained a price-to-earnings ratio generally between 10x and 13x earnings during 2025.
- Institutional investors owned more than 80% of HP shares in 2025.
- HP continued to aggressively share repurchase programs, reducing outstanding shares over multiple fiscal years.
Enterprise Infrastructure Statistics (Servers, Storage, Networking)
- HPE generated approximately $30.1 billion in fiscal 2024 revenue across enterprise infrastructure operations.
- HPE’s server revenue increased by 35% year over year during major AI infrastructure quarters in 2024.
- The company’s AI systems backlog surpassed $3 billion by late fiscal 2024.
- HPE’s Intelligent Edge segment produced over $4.5 billion in annual revenue during 2024.
- HPE’s GreenLake hybrid cloud platform continued expanding among enterprise clients worldwide in 2025.
- HPE operated in more than 150 countries, supporting enterprise networking and cloud deployments globally.
- Enterprise networking demand strengthened after HPE’s ongoing Juniper Networks integration efforts in 2025.
- HPE’s storage segment generated nearly $5 billion in annual revenue during fiscal 2024.
- The company continued investing heavily in Nvidia-powered AI servers for data center customers.
- HPE’s enterprise clients increasingly adopted subscription-based infrastructure and edge computing services in 2024 and 2025.
Hewlett-Packard Patent Filing Trend
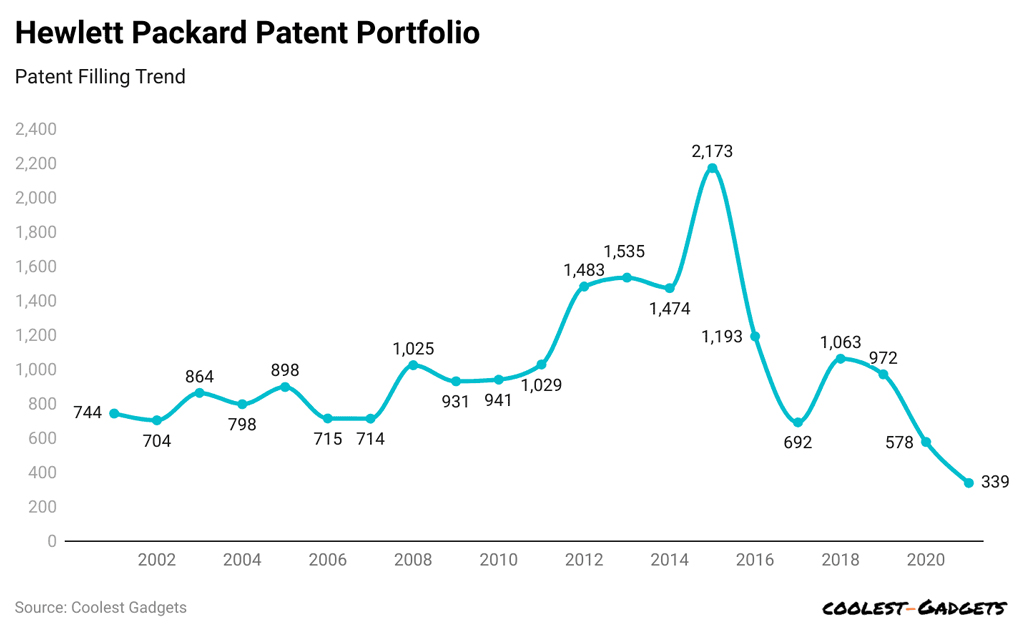
- Hewlett-Packard’s patent filings fluctuated sharply between 2001 and 2021, showing periods of strong innovation activity followed by major declines.
- The company recorded 744 patent filings in 2001, before slightly dropping to 704 filings in 2002.
- Patent activity improved in the early 2000s, reaching 864 filings in 2003 and 898 filings in 2005.
- Between 2006 and 2007, filings stayed almost flat, with 715 patents in 2006 and 714 patents in 2007.
- A major rise occurred in 2008, when Hewlett-Packard filed 1,025 patents, crossing the 1,000-patent mark for the first time in the chart.
- From 2009 to 2011, filings remained relatively stable, moving from 931 to 941 and then 1,029 patents.
- Hewlett-Packard saw strong growth in patent filings during 2012 and 2013, with filings increasing to 1,483 and 1,535, respectively.
- The highest point in the chart came in 2015, when Hewlett-Packard filed 2,173 patents, making it the company’s peak patent filing year.
- After the 2015 peak, patent filings fell sharply to 1,193 in 2016, a decline of nearly 45% in just one year.
- The downward trend continued in 2017, when filings dropped to 692, one of the lowest levels in the entire period.
- A brief recovery appeared in 2018, with patent filings rising to 1,063, but this rebound did not last.
- By 2020, filings declined again to 578, followed by a further drop to 339 in 2021.
- Overall, Hewlett-Packard’s patent filings declined from a peak of 2,173 in 2015 to 339 in 2021, reflecting a steep fall of about 84% over six years.
- The data suggests that Hewlett-Packard’s innovation and patenting activity were strongest during the 2012–2015 period, while the most notable slowdown occurred after 2016.
HP Research and Development Spending
- HP Inc. spent about $1.64 billion on R&D in fiscal 2024, up from the prior year.
- HPE reported $2.2 billion in R&D expenditures in fiscal 2024.
- HPE’s R&D spending rose to $2.5 billion in fiscal 2025, showing continued emphasis on innovation.
- HP Labs has 600 researchers and operates across 7 major sites plus additional teams in Princeton and Barcelona.
- HP Labs’ research spans 8 key opportunities, including cloud and security, AI, networking, printing, and sustainability.
- HP has built a patent portfolio of 46,136 patents globally, with 22,529 granted and 38%+ still active.
- HP has filed patents across more than imaging, printing, PCs, displays, networking, and data storage technologies.
- HPE says it has made $8+ billion in R&D investment over the last 5 years, reinforcing its AI and cloud push.
- HPE’s networking growth accelerated after its Juniper acquisition, with networking revenue up 54.3% in the third-quarter fiscal 2025.
- HP’s R&D intensity remains modest for a hardware maker, with fiscal 2024 spending of roughly 3% of revenue based on $1.64 billion R&D and $53.6 billion revenue.
HP Sustainability and ESG Statistics
- HP aims to achieve net-zero greenhouse gas emissions by 2040 across its value chain.
- The company reported using more than 1 billion pounds of recycled materials in products and packaging since 2019.
- HP sourced approximately 65% renewable electricity globally during fiscal 2024 operations.
- HP reduced operational greenhouse gas emissions by over 70% compared to 2019 levels.
- The company continued expanding closed-loop recycling programs for ink cartridges, plastics, and hardware devices.
- HP ranked among the leading ESG-focused technology companies in several global sustainability indexes during 2024.
- More than 50% of HP’s PC and print products will include recycled plastic content by 2025.
- HP continued supporting digital equity initiatives aimed at reaching 150 million people by 2030.
- HPE focused its sustainability efforts on energy-efficient data centers and lower-emission enterprise infrastructure solutions.
- HP received strong ESG ratings for supply chain transparency, climate disclosure, and workforce diversity initiatives.
Frequently Asked Questions (FAQs)
HP Inc. reported $55.3 billion in total revenue for fiscal 2025.
HP held approximately 20.6% global PC market share in 2025.
HP shipped about 57.4 million PCs globally in 2025.
HPE projected quarterly revenue between $7.2 billion and $7.6 billion for fiscal Q2 2025.
AI PCs accounted for roughly 35% of HP’s PC shipments in early 2026.
Conclusion
HP and Hewlett Packard Enterprise continue to play major roles across the global technology industry. HP Inc. remains one of the world’s largest PC and printer companies, while HPE has strengthened its position in AI infrastructure, cloud computing, and enterprise networking. The statistics also show how both companies have shifted toward subscription services, hybrid work technologies, sustainability programs, and AI-focused innovation.
At the same time, market competition, supply chain diversification, and enterprise AI demand continue shaping HP’s future growth strategy. With billions in annual revenue, global market leadership in printing, and expanding enterprise infrastructure capabilities, HP remains one of the most influential technology brands worldwide.