Battery storage has moved from a supporting technology to a core part of modern power systems. Utilities use large battery systems to shift solar and wind generation into high-demand hours, while businesses and households use smaller systems for backup power, demand management, and greater use of on-site solar. Data centers and other power-intensive facilities are also increasing their reliance on batteries for short-duration backup and power-quality management.
Global battery storage additions reached almost 110 GW in 2025, an increase of about 40% from 2024. Global battery energy storage additions had already reached about 169 GWh in 2024, while China and the U.S. accounted for substantial shares of new deployment. By the end of 2025, operational U.S. utility-scale battery storage power capacity stood at 43.6 GW, up from 8.3 GW in the first half of the year.
Editor’s Choice
- Battery storage ranked as the fastest-growing power technology in 2025, with annual capacity additions rising about 40% to almost 110 GW.
- China accounted for around 60% of worldwide battery capacity additions in 2025, maintaining a substantial lead over other markets.
- China added just over 63 GW of battery capacity in 2025, about one-third more than it installed in 2024.
- U.S. utility-scale battery storage capacity averaged 70% annual growth over the three years leading into mid-2026.
- Developers plan to add 24 GW of U.S. utility-scale battery storage during 2026, compared with a record 15 GW added in 2025.
- Texas alone accounts for a planned 12.9 GW, or 53%, of U.S. utility-scale battery additions scheduled for 2026.
- Battery storage project costs fell 93% between 2010 and 2024, from $2,571 per kWh to $192 per kWh.
- One outlook cited in 2025 research projects stationary battery storage at approximately 782 GW and 2,013 GWh by 2030, while a 1.5 C pathway indicates grid-scale storage requirements of up to 900 GW.
Recent Developments
- Global battery storage installations accelerated again in 2025, as annual capacity additions increased about 40% and approached 110 GW.
- China installed slightly more than 63 GW during 2025, extending its position as the world’s largest battery deployment market.
- About 55 GW of China’s 2025 battery additions came from utility-scale installations, while roughly 8 GW came from behind-the-meter systems.
- The U.S. added approximately 19 GW of battery capacity in 2025, representing year-over-year growth of around 60%.
- More than 16 GW of the U.S. additions in 2025 came from utility-scale batteries, while behind-the-meter installations approached 3 GW.
- Europe added approximately 6.2 GW of battery capacity in 2025. Although total additions slipped slightly from 2024, utility-scale additions more than doubled to about 4.6 GW.
- China added about 66 GW and 189 GWh of new-type energy storage in 2025, taking cumulative capacity to approximately 145 GW by year-end.
- By the end of 2025, 58% of China’s cumulative new-type energy storage installations operated as standalone storage rather than as directly co-located systems.
- U.S. developers reported plans for an additional 54 GW of battery storage to enter service over the roughly 2.5 years following mid-2026, including 14 GW planned for the second half of 2026.
Global Battery Storage Capacity Additions
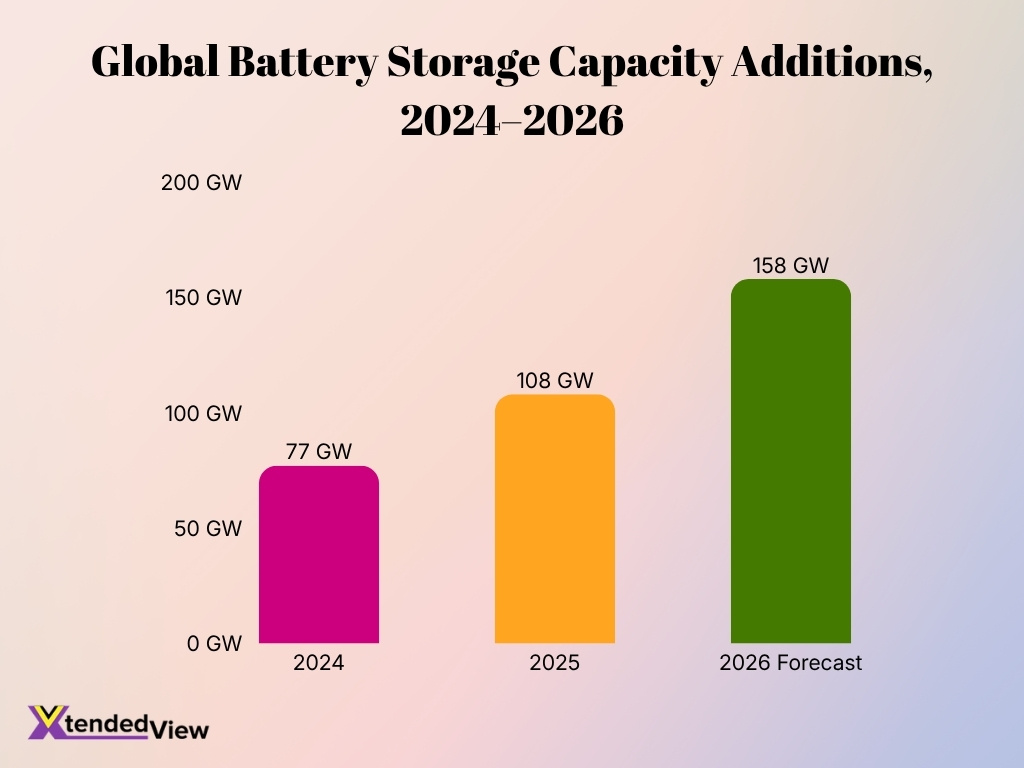
- Global battery storage additions increased from approximately 77 GW in 2024 to 108 GW in 2025, a rise of about 40%.
- Annual new battery storage capacity is forecast to reach 158 GW in 2026, adding roughly 50 GW compared with 2025.
- From 2024 to 2026, yearly battery storage additions are expected to more than double, increasing by about 105%.
- The sharp increase from 77 GW to 158 GW highlights the accelerating global deployment of battery storage infrastructure.
- The 2026 forecast of 158 GW would mark the highest annual capacity addition across the three-year period.
Global Battery Storage Capacity
- Global installed electrochemical storage capacity totaled approximately 158 GW in 2024, according to a 2025 assessment of stationary battery deployment.
- More than 69 GW of stationary battery capacity entered service globally during 2024 in the same assessment, nearly doubling the 89 GW total installed capacity reported for 2023.
- Measured by energy rather than power, global annual battery storage additions climbed to 169 GWh in 2024. The distinction matters because GW measures instantaneous power capability, while GWh measures the energy a system can store.
- China contributed 84 GWh of 2024 additions, equivalent to approximately half of worldwide additions measured in energy capacity.
- The U.S. contributed another 41 GWh in 2024, close to one-quarter of global additions measured on the same basis.
- In 2025, China remained the dominant deployment market and supplied around 60% of global battery capacity additions.
- Australia now derives battery capacity equivalent to around 18% of its installed dispatchable capacity, compared with about 7% in China, 5% in the U.S. and 4% in Europe.
- Storage durations are also increasing. Although many projects still cluster near two hours, a growing number provide four hours or more of storage as electricity systems add larger shares of solar generation.
Battery Storage Capacity Growth by Year
- In 2010, worldwide annual battery energy storage additions measured only 0.1 GWh, providing a useful baseline for the sector’s subsequent expansion.
- U.S. utility-scale battery capacity remained modest as recently as 2020, when capacity stood at approximately 1.2 GW on a time-adjusted basis.
- The comparable U.S. figure rose to approximately 2.6 GW in 2021 and 6.6 GW in 2022, showing how quickly deployment moved beyond early projects.
- U.S. time-adjusted utility-scale battery capacity increased again to roughly 11.2 GW in 2023, more than four times its 2021 level.
- The same measure reached approximately 19.9 GW in 2024, while cumulative nameplate capacity exceeded 26 GW by year-end under a separate nameplate-capacity measure.
- U.S. generators added 10.4 GW of nameplate battery capacity in 2024, driving a 66% increase in cumulative utility-scale capacity.
- By the end of 2025, operational U.S. nameplate battery storage capacity had reached 43.6 GW, following another record year for installations.
- The first half of 2026 added 8.3 GW more, lifting U.S. nameplate capacity to nearly 52 GW by June.
- Looking across the most recent expansion period, U.S. utility-scale battery capacity recorded an average annual growth rate of 70% over the previous three years, highlighting how rapidly storage has moved into the mainstream power fleet.
Utility-Scale Battery Storage Capacity
- Utility-scale systems supplied around 80% of worldwide battery capacity additions in 2025, making large grid-connected projects the dominant segment of the market.
- China’s utility-scale battery installations contributed approximately 55 GW of new capacity in 2025, compared with roughly 8 GW added behind the meter.
- U.S. utility-scale systems contributed more than 16 GW of additions in 2025, making large projects the main source of U.S. battery expansion.
- Europe added around 4.6 GW of utility-scale battery capacity in 2025, more than twice its 2024 annual addition.
- U.S. utility-scale battery nameplate capacity stood at 43.6 GW at the end of 2025 and climbed to almost 52 GW during the first half of 2026.
- Developers plan to install 24 GW of U.S. utility-scale battery storage during 2026, which would substantially exceed the record 15 GW installed in 2025 if all planned projects enter service.
- Battery storage represents 28% of the 86 GW of new U.S. utility-scale generating capacity planned for 2026, second only to solar’s 51% share.
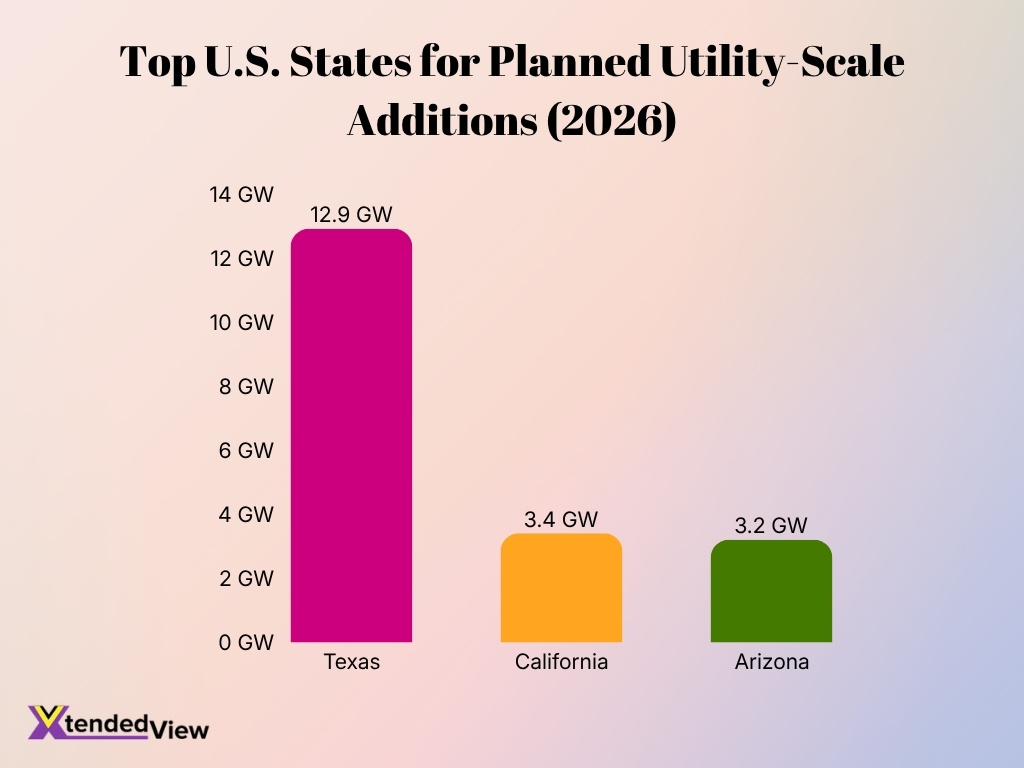
- Texas, California and Arizona account for approximately 80% of planned U.S. battery additions in 2026. Their respective planned additions stand at 12.9 GW, 3.4 GW and 3.2 GW.
- The pipeline extends beyond 2026: U.S. operators reported plans for 54 GW of additional battery capacity over roughly 2.5 years from mid-2026, illustrating the scale of projects moving through the development queue.
Behind-the-Meter Battery Storage Capacity
- Behind-the-meter batteries accounted for roughly 20% of the 108 GW of battery storage capacity added worldwide in 2025. Utility-scale systems supplied the other 80%, showing that grid-connected projects remain the larger segment.
- China installed about 8 GW of behind-the-meter battery storage in 2025, alongside continued expansion of distributed solar. That represented about 13% of China’s total battery additions for the year.
- U.S. behind-the-meter battery additions approached 3 GW in 2025, compared with more than 16 GW of utility-scale additions. The figures illustrate the much larger role that front-of-the-meter projects currently play in U.S. deployment.
- Australia recorded one of the strongest distributed-storage expansions in 2025. Behind-the-meter additions increased from roughly 0.2 GW in 2024 to 3.4 GW in 2025, a rise of more than 3 GW in one year.
- Australia’s behind-the-meter additions in 2025 were equivalent to about 43% of its nearly 8 GW of total battery additions, making distributed systems unusually important in its storage mix.
- In the European Union, behind-the-meter batteries supplied less than half of annual storage additions for the first time in 2025. Utility-scale systems moved ahead with a 55% share of new energy capacity.
- Despite that shift, residential batteries still represented approximately 56% of the EU’s operating battery fleet at the end of 2025, reflecting years of household solar-plus-storage adoption.
- The Netherlands added almost 1 GWh of behind-the-meter storage in 2025, even as its rooftop solar market contracted. Changes to net-metering rules and growing use of flexible tariffs helped support storage demand.
Residential and Commercial Battery Storage Capacity
- U.S. residential storage installations exceeded 800 MW in 2025, representing 75% year-over-year growth under one segment measure. Household demand accelerated as customers moved to capture expiring federal tax incentives.
- The U.S. residential market installed 1 GWh in Q4 2025 alone, setting a quarterly record for energy capacity.
- Residential installations reached 647 MW during Q3 2025, 70% higher than in the corresponding quarter of 2024. California, Arizona, and Illinois ranked among the leading markets during the quarter.
- The U.S. community, commercial and industrial segment installed 77 MW in Q4 2025, supported in part by state-level storage policies and incentive programs.
- During Q3 2025, the same U.S. segment installed 33 MW, down 8% year over year. California contributed 17.8 MW, or 54% of the quarterly total.
- U.S. non-net-metered distributed residential battery capacity stood at 343 MW in 2024, up from 239 MW in 2023 and 171 MW in 2022. The series excludes utility-scale storage and therefore measures a narrower portion of the residential market.
- Non-net-metered commercial battery capacity in the U.S. reached about 268 MW in 2024, compared with 243 MW in 2023. Industrial installations added another 18.8 MW.
- Across those U.S. distributed categories, non-net-metered battery power capacity totaled approximately 633 MW in 2024, up 26% from about 502 MW in 2023.
- In the EU, residential battery installations fell 6% in 2025. Meanwhile, utility-scale storage expanded strongly enough to push total annual battery deployment to a record 27.1 GWh.
Grid-Scale Battery Storage Capacity
- Grid-scale storage dominated new global deployment in 2025, with approximately 87 GW of utility-scale batteries installed. This represented about four-fifths of total battery additions.
- About 24 GW of 2025 utility-scale additions were installed directly alongside renewable generation. The volume remained close to its 2024 level even as the overall grid-scale market expanded.
- Renewable-co-located projects consequently represented just under 30% of global utility-scale battery additions in 2025. Changes to Chinese market rules contributed to the declining share.
- China installed around 55 GW of utility-scale battery capacity in 2025, accounting for the great majority of the country’s 63 GW-plus total annual battery additions.
- The U.S. added more than 16 GW of utility-scale battery storage in 2025. Total U.S. battery additions across utility and behind-the-meter segments reached approximately 19 GW.
- Europe installed about 4.6 GW of utility-scale batteries in 2025, more than double the previous year’s additions. Large systems therefore became a much larger component of Europe’s storage market.
- Australia’s utility-scale additions jumped from less than 1 GW in 2024 to about 4.2 GW in 2025, while the country’s total battery additions approached 8 GW.
- The average size of a U.S. utility-scale battery project increased from about 15 MW in 2021 to 35 MW in 2024, more than doubling in three years as developers moved toward larger projects.
- China added approximately 66 GW/189 GWh of new-type storage in 2025, lifting cumulative capacity to about 145 GW. Standalone storage represented 58% of cumulative installations by year-end.
Battery Storage Capacity by Country
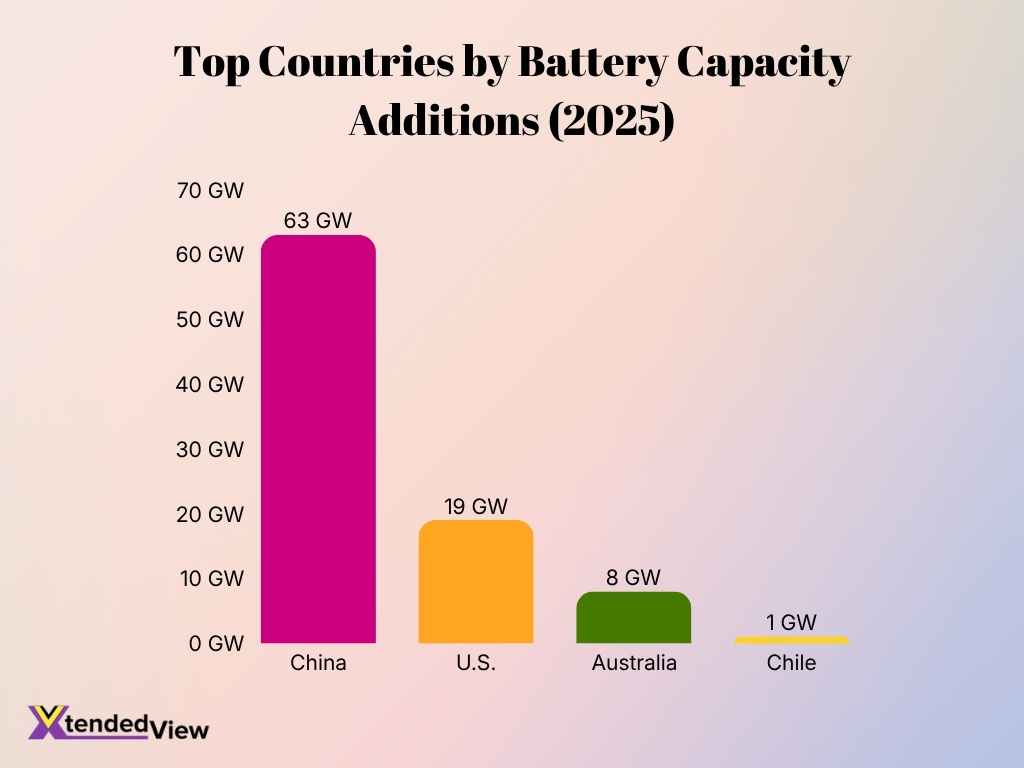
- China remained the world’s largest battery storage market in 2025. It added more than 63 GW of battery capacity during the year, roughly one-third more than in 2024.
- Under China’s broader new-type energy storage measure, approximately 66 GW/189 GWh entered service during 2025, bringing cumulative capacity to about 145 GW. Differences between global battery datasets and China’s new-type storage definition explain why annual figures do not always match exactly.
- China had added about 42 GW/101 GWh of new-type storage in 2024. Its average new capacity therefore had a duration of roughly 2.3 hours that year.
- The U.S. installed 19 GW of battery capacity in 2025, around 60% more than in 2024. More than 16 GW came from utility-scale projects.
- Australia added nearly 8 GW in 2025, almost nine times its 2024 volume. Approximately 4.2 GW came from utility-scale projects and 3.4 GW from behind-the-meter systems.
- Germany installed 6.6 GWh of new battery energy capacity in 2025. It remained one of Europe’s largest national markets as grid-scale projects began contributing more materially to deployment.
- Italy installed less than 5 GWh in 2025, an 18% year-over-year decline. Its grid-scale segment nevertheless delivered around 3.5 GWh during both 2024 and 2025.
- Bulgaria emerged as a fast-growing European storage market, connecting 2.5 GWh in 2025, about 1,200% more than the previous year. Large grid-connected projects drove the expansion.
- Chile added close to 1 GW of battery capacity in 2025. Developers are using utility-scale storage to capture surplus daytime solar output and release electricity when demand and prices rise.
Battery Storage Capacity by Region
- China alone accounted for approximately 60% of worldwide battery capacity additions in 2025, giving Asia the largest national source of new storage deployment.
- China, the U.S. and Europe collectively accounted for about 85% of global battery storage additions in 2024, when worldwide additions reached approximately 74 GW/180 GWh under one global dataset.
- China commissioned about 39 GW in 2024 under that dataset, 77% more than in 2023, while the U.S. added roughly 12 GW.
- Europe contributed approximately 11.5 GW of battery storage additions in 2024 under the same dataset. Regional totals vary between publications because some use power capacity, some use energy capacity and some apply different geographic or market definitions.
- Europe added around 6.2 GW in 2025 under a narrower battery-capacity dataset. Utility-scale systems supplied approximately 4.6 GW, highlighting the region’s shift toward larger projects.
- The EU installed a record 27.1 GWh in 2025, lifting its operating battery fleet to 77.3 GWh. Annual energy-capacity installations increased 45% from 2024.
- Australia drove a sharp acceleration in Oceania, with national battery additions reaching nearly 8 GW in 2025, almost nine times the previous year’s level.
- Middle Eastern battery additions exceeded 3 GW in 2025, more than tripling from 2024. Saudi Arabia accounted for nearly all of that expansion.
- Battery penetration relative to dispatchable generating capacity reached approximately 18% in Australia, versus 7% in China, 5% in the U.S. and 4% in Europe. This measure shows how storage’s system role can differ even when a region has less absolute capacity.
Battery Storage Capacity by Application
- Utility-scale applications represented about 80% of global battery additions in 2025, or approximately 87 GW out of the 108 GW deployed worldwide.
- Behind-the-meter residential and commercial systems accounted for the remaining roughly 20% of worldwide battery storage additions in 2025. These systems typically support self-consumption, backup power and electricity-bill management.
- Renewable co-location remained a major grid-scale application: about 24 GW of utility-scale batteries added in 2025 were paired directly with renewable generation.
- Co-located renewable projects represented slightly less than 30% of global utility-scale additions in 2025. Their absolute additions stayed close to 2024 levels even though overall battery deployment rose sharply.
- Energy shifting has become a major battery application as solar penetration increases. Storage charges when electricity supply is abundant and discharges later to meet evening peaks and other periods of higher system demand. The global application dataset tracks energy shifting separately from ancillary services and congestion management.
- Grid batteries also provide ancillary services such as frequency regulation and operating reserves, using rapid charging or discharging to help balance electricity systems. These services form a distinct category in global storage application statistics.
- Congestion management represents another grid application. Batteries placed at constrained network locations can shift power flows, increase use of existing transmission or distribution assets and potentially defer network reinforcement.
- Battery-based uninterruptible power supply capacity, used primarily by data centers, added about 45 GW in 2025, up 30% year over year. These systems differ from conventional grid storage because they generally bridge short outages until another backup source starts.
- Chile’s nearly 1 GW of 2025 battery additions illustrates energy shifting in practice: grid-scale systems increasingly absorb excess solar electricity and discharge it during peak-demand periods.
Battery Storage Capacity by Battery Chemistry
- Lithium iron phosphate, or LFP, accounted for around 90% of battery storage deployments in 2025, making it the dominant chemistry in the stationary-storage market.
- LFP’s market share stood well below 50% only five years earlier, showing how rapidly stationary-storage developers have shifted toward this chemistry.
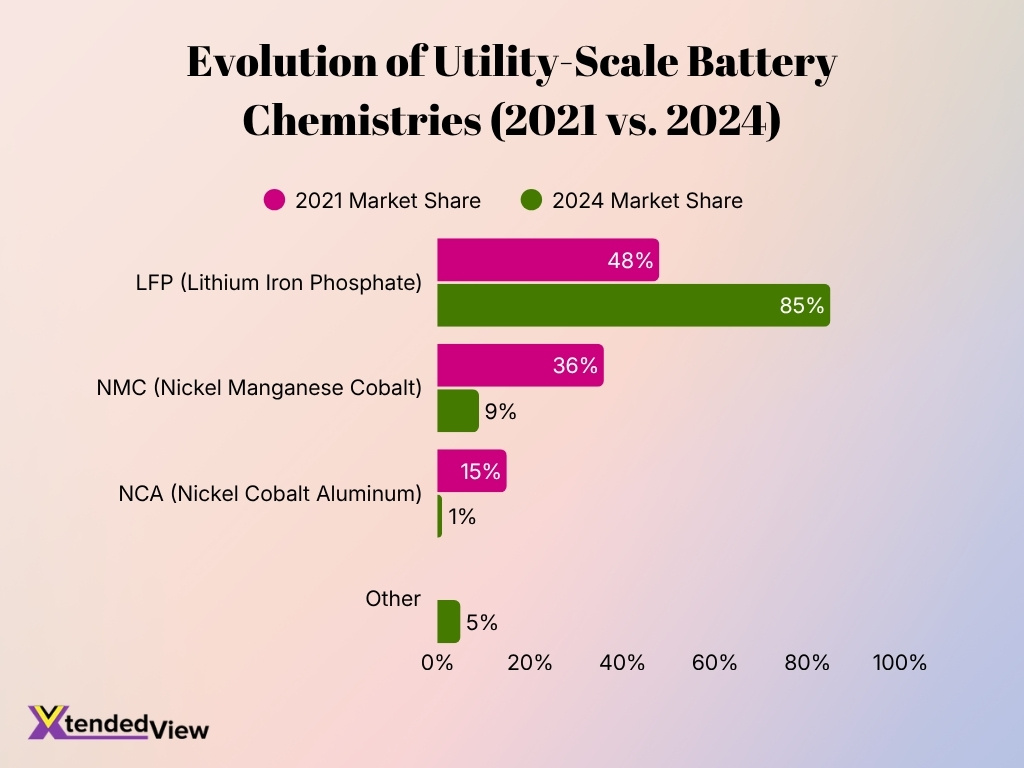
- In utility-scale storage specifically, LFP’s market share increased from 48% in 2021 to an estimated 85% in 2024. Lower costs, long cycle life, and thermal characteristics helped drive the change.
- Nickel manganese cobalt, or NMC, moved in the opposite direction. Its share of the utility-scale battery market fell from 36% in 2021 to 9% in 2024.
- Nickel cobalt aluminum, or NCA, accounted for approximately 15% of utility-scale storage in 2021, but its share dropped below 1% by 2024.
- Other battery technologies collectively reached about 5% of the utility-scale market in 2024, indicating early commercial adoption of alternative chemistries and technologies.
- The combined share of LFP, NMC and NCA changed substantially between 2021 and 2024: LFP gained 37 percentage points, while NMC lost 27 percentage points and NCA lost more than 14 percentage points.
- LFP batteries generally have lower energy density than chemistries widely used in some electric vehicles, but stationary-storage projects place greater weight on cost and frequent cycling, helping explain LFP’s near-90% deployment share in 2025.
- The jump from a 48% LFP share in 2021 to around 90% in 2025 means the chemistry gained roughly 42 percentage points of stationary-storage market share in about four years, although the underlying datasets use slightly different annual deployment scopes.
Battery Storage Capacity by System Duration
- The average duration of utility-scale battery projects commissioned worldwide increased to three hours in 2025, up from around two hours in 2023. The shift reflects greater use of batteries for moving electricity from periods of abundant generation to periods of higher demand.
- Although many battery projects still cluster around two hours of storage, an increasing number now provide four hours or more. Higher solar penetration makes longer-duration systems more useful for transferring daytime generation into evening demand periods.
- China’s average duration for cumulative new-type energy storage increased from approximately 2.1 hours in 2021 to 2.6 hours in 2025. That represents an increase of about half an hour in four years.
- California has developed a strong concentration of four-hour battery systems, partly because its Resource Adequacy framework assigns capacity value based on the ability to sustain output across this period.
- Longer-duration lithium-ion projects are also entering development. The Prairie Song Reliability Project proposed in California combines 1,150 MW with about 9,200 MWh, giving the planned battery an eight-hour duration.
- Another California project approved in 2026 pairs 400 MW with 3,200 MWh of energy capacity. Its eight-hour configuration illustrates the move beyond conventional two- and four-hour designs.
- Italy’s first MACSE storage auction contracted 10 GWh for delivery in 2028. About 1.3 GWh of the awarded battery capacity will provide durations of at least eight hours.
- Italy’s broader auction mechanism targets 50 GWh of battery energy storage by 2030, providing a market for systems that can shift larger quantities of renewable electricity across several hours.
- Great Britain’s long-duration storage support mechanism requires qualifying projects to discharge at full power for at least eight hours. Its indicative long-duration capacity range reaches 2.7 GWh to 7.7 GWh by 2035.
Battery Storage Power Capacity vs. Energy Capacity
- Battery power capacity, expressed in MW or GW, measures how much power a storage system can discharge at a given moment. Energy capacity, measured in MWh or GWh, shows how much electricity it can store. A 100 MW/400 MWh battery, for example, can theoretically operate at full rated power for four hours.
- Global battery storage additions reached 108 GW in 2025, 40% higher than in 2024. This figure measures the power rating of the newly deployed storage fleet rather than the total amount of electricity it can hold.
- In 2024, the world added about 74 GW and 180 GWh of battery storage under one global dataset. The relationship between those figures indicates that the average new capacity represented more than two hours of energy storage.
- China’s 2025 new-type energy storage additions totaled approximately 66 GW and 189 GWh. Energy capacity was therefore almost three times power capacity when expressed as GWh-to-GW.
- A proposed California long-duration installation illustrates the difference clearly: Prairie Song would provide 1,150 MW of power and 9,200 MWh of energy, resulting in an eight-hour system.
- The Waratah Super Battery has an approved capacity of 850 MW/1,680 MWh, equivalent to just under two hours at maximum rated output. Its design centers on grid reliability and system protection.
- The approved Potentia-Viridi project uses a different configuration: 400 MW/3,200 MWh. Although its power rating is less than half Waratah’s, its energy capacity is nearly twice as large because it is designed for eight-hour operation.
- The Soda Mountain project approved in California combines up to 300 MW with 1,200 MWh, producing a four-hour storage configuration.
- Europe’s outlook increasingly emphasizes energy capacity in GWh. The continent’s operating battery fleet exceeded 100 GWh in 2025, and the medium forecast puts it at 582 GWh by 2030.
Largest Battery Storage Projects by Capacity
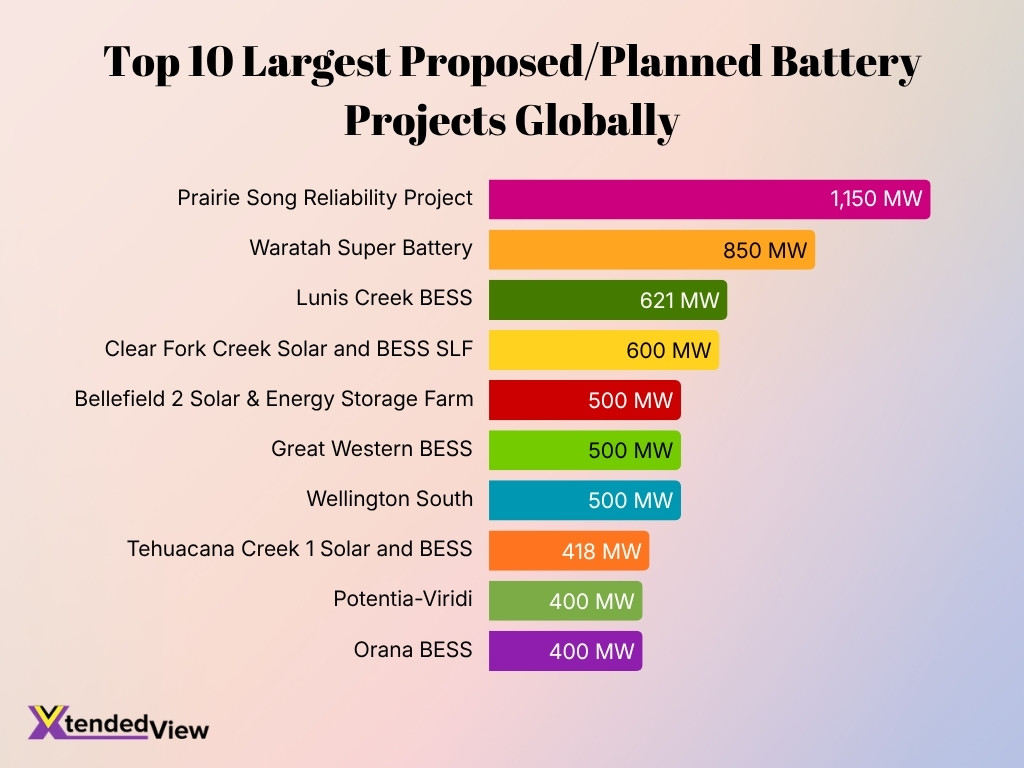
- The proposed Prairie Song Reliability Project in Los Angeles County would provide 1,150 MW/9,200 MWh of storage. Its eight-hour configuration would make it exceptionally large by both power and energy capacity if completed as proposed.
- The Waratah Super Battery in New South Wales has a total planned configuration of 850 MW/1,680 MWh. Around half of its capacity had entered operation when the project’s first operational stage was announced.
- The Lunis Creek BESS in Texas is scheduled to contribute 621 MW in 2026, making it the largest U.S. standalone battery project listed among the four biggest storage projects scheduled for the year.
- Clear Fork Creek Solar and BESS SLF in Texas is scheduled to add 600 MW of battery capacity in 2026. It ranks immediately behind Lunis Creek among the largest U.S. battery projects scheduled for the year.
- Bellefield 2 Solar & Energy Storage Farm in California is expected to add 500 MW of battery capacity in 2026, placing it among the country’s largest scheduled storage additions.
- The Great Western BESS approved in New South Wales has a planned storage capacity of 500 MW/1,000 MWh, while Wellington South carries the same 500 MW/1,000 MWh configuration.
- The Potentia-Viridi project approved in California in May 2026 will provide 400 MW/3,200 MWh if constructed as approved. Its expected online date is June 2028.
- The Orana BESS planned in New South Wales has a proposed 400 MW/1,600 MWh configuration, giving it four hours of energy capacity at maximum output.
- Tehuacana Creek 1 Solar and BESS in Texas is expected to include 418 MW of battery storage alongside 837 MW of solar generation in 2026. Together, the two components illustrate the growing scale of hybrid solar-plus-storage facilities.
Battery Storage Capacity Pipeline and Planned Capacity
- U.S. operators reported plans to bring another 54 GW of battery storage capacity online during the roughly 2.5-year period following June 2026. That pipeline is slightly larger than the country’s entire operating battery fleet at midyear.
- The U.S. had nearly 52 GW of operational utility-scale battery capacity by June 2026 after adding 8.3 GW in the first six months of the year.
- Operators expected another 14 GW to enter service in the second half of 2026, based on projects reported in the midyear development pipeline.
- At the start of 2026, developers planned 24 GW of U.S. utility-scale battery additions for the full year, compared with the record 15 GW installed in 2025.
- Texas represented 12.9 GW, or 53%, of those planned 2026 U.S. additions. California contributed 3.4 GW and Arizona another 3.2 GW.
- Those three states together represented about 80% of planned U.S. battery additions for 2026, concentrating near-term development in regions with large solar fleets and growing electricity demand.
- Europe is expected to install more than 50 GWh in 2026 under the medium market scenario, 44% above its 2025 deployment. Utility-scale projects are projected to contribute almost two-thirds of the year’s installations.
- European residential storage is projected to add 13.2 GWh in 2026, while commercial and industrial installations are expected to contribute nearly 6 GWh.
- Italy’s storage procurement program aims for 50 GWh of battery capacity by 2030, while its first auction has already contracted 10 GWh for delivery in 2028.
- California’s project pipeline is also moving toward longer-duration assets. The approved Potentia-Viridi system alone could add 3.2 GWh in 2028, while the proposed Prairie Song system would add about 9.2 GWh if approved and constructed as proposed.
Battery Storage Capacity Outlook Through 2030
- One current global outlook projects installed stationary battery storage at approximately 782 GW/2,013 GWh by 2030, compared with 158 GW of electrochemical storage capacity in 2024.
- A 1.5-degree Celsius pathway indicates that global grid-scale storage, including utility-scale and behind-the-meter batteries, could need to reach as much as 900 GW by 2030.
- A separate net-zero pathway sets an even higher benchmark. Global energy storage would need to reach 1,500 GW by 2030, with batteries supplying 1,200 GW, or 80% of the total installed storage power capacity.
- Reaching the 1,200 GW battery benchmark would require global battery storage to expand about 14-fold from the level used as the starting point for that pathway and maintain average deployment growth of roughly 25% per year through 2030.
- Europe is projected to reach approximately 582 GWh of cumulative battery capacity by 2030 under its medium scenario, more than six times the level operating at the end of 2025.
- Within the EU-27, cumulative battery capacity is projected to increase from 77 GWh in 2025 to 470 GWh in 2030 under the medium scenario. A higher deployment pathway reaches 593 GWh.
- Europe’s annual battery installations could reach 138 GWh in 2030, roughly four times the 36 GWh installed in 2025. The forecast implies a 28% compound annual growth rate between 2026 and 2030.
- Utility-scale batteries are projected to account for 392 GWh, or 67%, of Europe’s battery fleet by 2030. Residential storage is projected at 121 GWh, while commercial and industrial systems reach about 68.7 GWh.
- Battery storage costs have already fallen 93% between 2010 and 2024, from $2,571 per kWh to $192 per kWh. Continued cost reductions and manufacturing scale provide an important economic foundation for the capacity expansion expected through 2030.
- The range between forecasts, roughly 782 GW in one market outlook, up to 900 GW in a 1.5-degree pathway and 1,200 GW in a net-zero pathway, reflects different assumptions rather than a single agreed forecast. Policy, renewable deployment, grids, permitting and other flexibility resources will influence where actual 2030 capacity falls.
Frequently Asked Questions (FAQs)
Global battery storage additions reached 108 GW in 2025, up about 40% year over year and making battery storage the fastest-growing power technology that year.
The U.S. reached nearly 52 GW of operational utility-scale battery storage capacity by June 2026, after adding 8.3 GW during the first half of the year.
Utility-scale batteries represented about 80% of global battery storage additions in 2025, contributing approximately 87 GW of the 108 GW installed.
Europe installed 36 GWh of battery storage in 2025, a 48% year-over-year increase, pushing its total operational capacity above 100 GWh.
Lithium iron phosphate batteries accounted for around 90% of global battery storage deployments in 2025, up from well below 50% five years earlier.
Conclusion
Battery storage entered the year after a record 108 GW of global additions in 2025, 40% more than the previous year. Global installed battery capacity is now 11 times its 2021 level, while the U.S. reached nearly 52 GW of utility-scale battery capacity by June 2026.
The market is also moving toward longer-duration systems, larger projects, and broader applications. LFP chemistry represents approximately 90% of battery storage deployments, while published 2030 pathways indicate roughly 782 GW to 1,200 GW of global battery storage, depending on market and energy-transition assumptions. These trends position battery storage as an increasingly significant source of flexibility for power systems with growing renewable generation.