


Social media has moved far beyond brand awareness. Businesses now use social platforms to acquire customers. Social media has become a core business channel for marketing, sales, customer service, product discovery, and brand communication. Companies use platforms such as Facebook, Instagram, LinkedIn, TikTok and YouTube to reach buyers, generate leads, answer customer questions and support direct purchases. For retailers, short-form video and social commerce can move shoppers from product discovery to checkout within the same platform. Meanwhile, B2B companies use professional networks and targeted content to reach decision-makers, build authority and support longer sales cycles.
The scale of this opportunity continues to grow as social media audiences expand, advertising budgets increase, and more businesses adopt AI, creator partnerships and platform-based commerce. At the same time, users expect faster responses, more authentic content and more convenient buying experiences. The following social media for business statistics highlight how these shifts are changing customer behavior, marketing investment and business performance across the U.S. and global markets.
Editor’s Choice
- 5.66 billion: Active social media user identities worldwide reached this level by October 2025, equivalent to 68.7% of the global population.
- 254 million: The U.S. recorded this many active social media user identities in October 2025, providing businesses with access to nearly three-quarters of the country’s population.
- 94%: Nearly all surveyed social media marketers reported using AI somewhere in their workflow in 2026.
- 77%: More than three-quarters of surveyed marketers said authentic social content matters more to their brand than high production value.
- 60%: Six in 10 social media marketers planned to increase their investment in influencer marketing during 2026.
- 59%: Increasing brand awareness ranked as the No. 1 social media goal among surveyed social teams in 2026.
- 72%: Marketers reported that social content created with AI performs better than content produced without AI.
- 40%: In 2025 research, Facebook ranked among the top three social platforms for ROI for 40% of surveyed marketers, showing that established networks remained commercially important alongside newer channels.
Recent Developments
- AI has moved into the mainstream of social media operations: 94% of surveyed social marketers used AI in at least some part of their workflow in 2026.
- Brainstorming and ideation ranked as the leading AI use case, with 42.9% of marketers applying AI to this task.
- Another 41.5% of social marketers used AI to generate captions and other short-form text, showing how quickly AI has entered routine content production.
- Image creation has also become a major AI application, with 38.35% of surveyed marketers using the technology to generate social visuals.
- Despite greater automation, 77% of marketers said authenticity beats production value for their brand on social media, suggesting businesses cannot rely on polished AI output alone.
- Influencer partnerships continue to gain budget: 60% of marketers said they planned to increase influencer investment in 2026.
- Social marketing technology is also expanding. 48% of marketers expected their social media tool stack to grow during 2026.
- Platform audiences continue to expand. Pinterest reached 640 million monthly active users in Q2 2026, up 11% year over year, while its quarterly revenue reached $1.18 billion.
- Snapchat reached 493 million daily active users in Q2 2026, a 5% year-over-year increase, while quarterly revenue rose 19% to $1.6 billion.
- Meta’s family of apps averaged 3.60 billion daily active people in June 2026, up 3% year over year. Ad impressions increased 14%, while average price per ad rose 12%.
Global Social Media Usage Statistics
- The worldwide social media audience reached 5.66 billion active user identities in October 2025, up from 5.24 billion reported at the start of 2025. Methodology and source revisions mean those two headline totals should not be treated as a clean year-over-year comparison.
- Social media user identities represented 68.7% of the world’s population by October 2025, meaning more than two in every three people globally were represented in the latest estimate.
- Social media identities equaled 93.8% of all global internet users, illustrating how closely internet adoption and social platform adoption now overlap.
- Survey data separately indicates that 96.9% of internet users ages 16 and older use at least one social platform each month.
- The global audience grew by 259 million identities in 12 months, an increase of 4.8%. That works out to an average of roughly 21.5 million additional identities per month based on the published annual change.
- For longer-term context, the worldwide social media audience stood at just under 2.27 billion identities in October 2015. The total has therefore expanded by close to 3.4 billion over a decade.
- The typical active social media user now visits 6.75 different social platforms per month, making multi-platform behavior the norm rather than the exception.
- Mobile app activity puts YouTube first among major social apps. WhatsApp’s active-user index stood at 86.5 relative to YouTube’s 100, followed by Instagram at 79.9 and Facebook at 77.1.
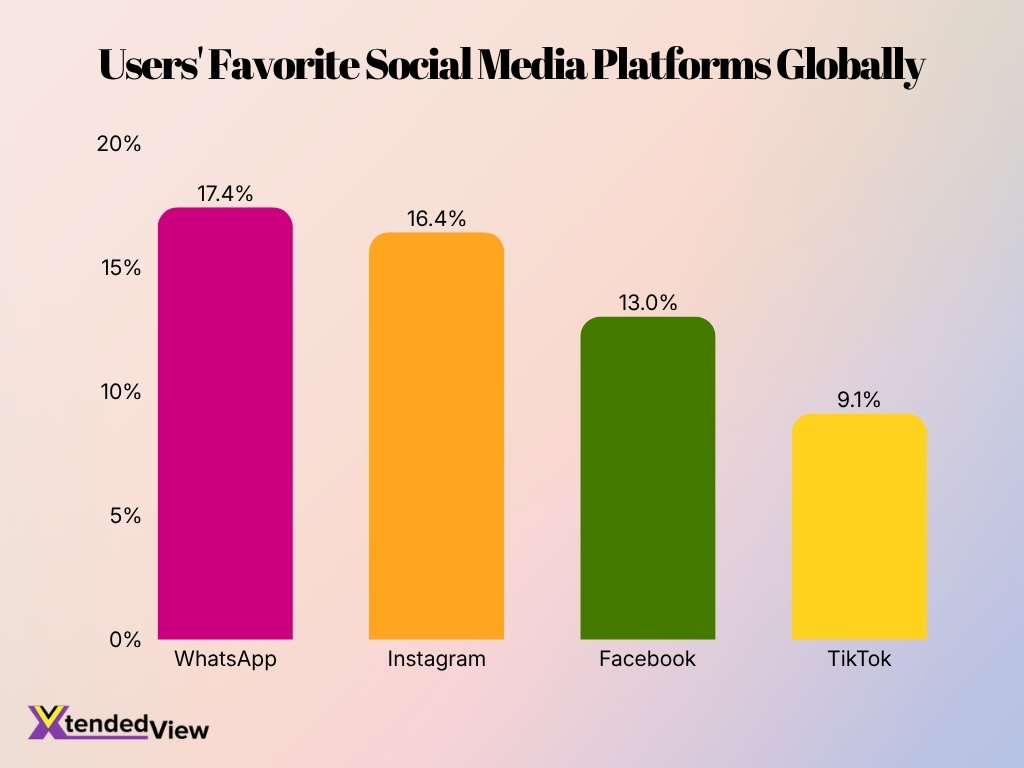
- When users were asked to name their favorite social platform, 17.4% chose WhatsApp, 16.4% chose Instagram, 13% selected Facebook, and 9.1% picked TikTok.
Social Media Penetration, Reach, and Demographics
- In the U.S., 254 million social media user identities were active in October 2025, equivalent to 73% of the country’s population.
- Among Americans ages 18 and older, social media identities reached 222 million, equivalent to 80.8% of the U.S. adult population at the end of 2025.
- U.S. social media user identities increased by 1 million, or 0.4%, between late 2024 and the end of 2025, indicating that the country’s overall market has entered a mature growth phase.
- Women represented 50.9% of U.S. social media user identities at the end of 2025, while men accounted for 49.1%.
- Globally, the gender distribution moves in the opposite direction: 54.4% of social media users were male, and 45.6% were female in the latest global dataset.
- TikTok reached 37% of U.S. adults in 2025, up from 21% in 2021. Among adults under 30, usage reached 63%.
- TikTok’s age gradient remains pronounced: 44% of U.S. adults ages 30 to 49 used the platform in 2025, compared with 30% of those ages 50 to 64 and 12% of adults 65 and older.
- YouTube offers broader reach across U.S. age groups. 85% of U.S. adults reported using it in the latest published measurement, including 65% of adults ages 65 and older.
- Among U.S. teens, 90% use YouTube, 63% use TikTok, 61% use Instagram, and 55% use Snapchat. These figures give brands targeting future consumers a clear view of where younger audiences already spend their attention.
Time Spent on Social Media Platforms
- In the 2025 global benchmark, the typical internet user spent 2 hours and 21 minutes per day using social media. That was 10 minutes less than the equivalent figure two years earlier.
- The broader 2026 measurement, which includes social networks and video-centric social feeds such as YouTube and TikTok, puts average consumption at 18 hours and 36 minutes per week.
- That weekly total equals more than 2½ hours per day spent across social networks and social video feeds, creating a large recurring attention window for businesses.
- Online adults use social media on an average of 4.21 days each week, meaning the typical connected consumer interacts with social platforms more often than once every two days.
- Users ages 16 to 24 report social media activity on 4.6 days per week, making younger audiences the most frequent users among measured age groups.
- Young women spend substantially more time with social and video feeds. Women ages 16 to 24 average 25 hours and 45 minutes per week, or more than 3 hours and 40 minutes per day.
- Even older audiences maintain meaningful usage. Male internet users ages 65 and older spend more than one hour per day consuming social and video feeds.
- Usage intensity varies sharply by country. Nigerian internet users reported social media activity on an average of 5.84 days per week, one of the highest rates among the 54 surveyed markets.
- U.S. teens show particularly high daily engagement. 73% of teens use YouTube daily, including 15% who report using it almost constantly; more than half also visit TikTok every day.
Social Media Marketing Adoption by Businesses Statistics
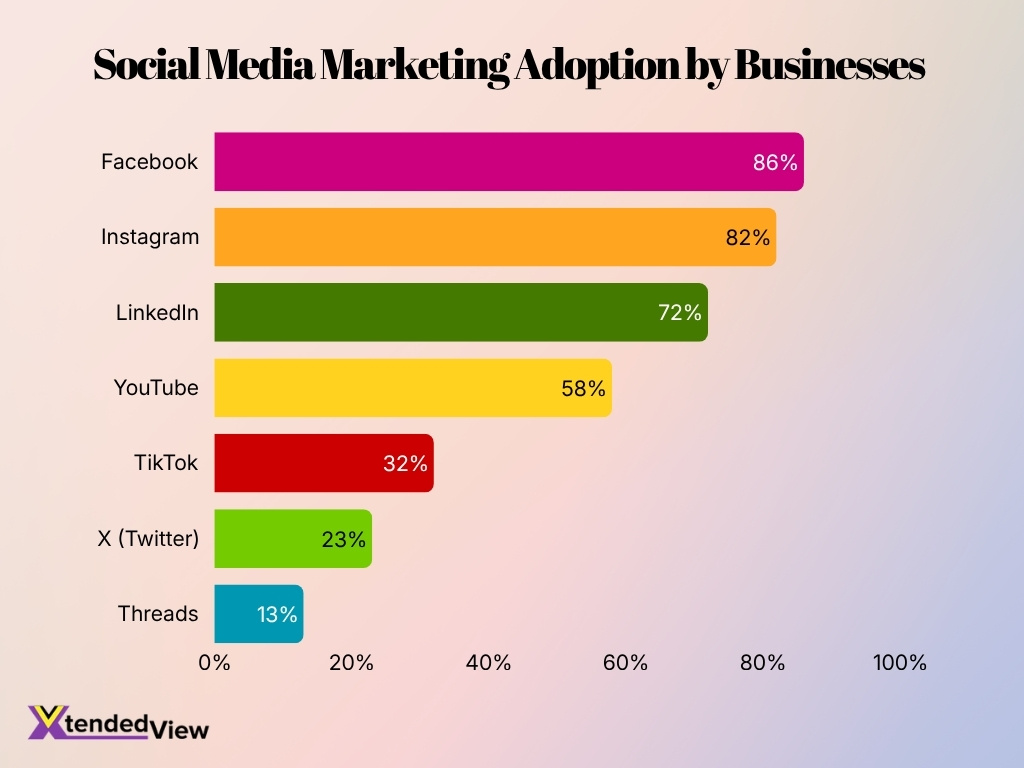
- Facebook leads social media marketing adoption, with 86% of businesses and marketers using the platform for marketing activities.
- Instagram ranks second at 82%, highlighting its strong role in visual content, brand promotion, and audience engagement.
- LinkedIn is used by 72% of marketers, making it one of the most widely adopted platforms, particularly for professional and B2B marketing.
- YouTube reaches 58% adoption, showing that more than half of marketers use the platform to support their video marketing strategies.
- TikTok is used by 32% of marketers, placing it well behind established platforms despite the growing popularity of short-form video content.
- X (Twitter) records 23% adoption, meaning fewer than one-quarter of businesses and marketers use the platform for marketing.
- Threads has the lowest adoption rate at 13%, trailing Facebook by a substantial 73 percentage points.
- Overall, the data shows that Facebook, Instagram, and LinkedIn dominate business social media marketing, with each achieving adoption rates above 70%.
Platform-Specific Business Statistics
- Instagram remains a core business channel in 2026. 70% of marketers report using the platform, making it the most widely used social network among marketers in one current global marketing dataset.
- Facebook remains deeply embedded in commercial social media strategies. A separate 2026 global marketer survey found that 86% of marketers use Facebook for marketing purposes.
- Meta’s family of apps averaged 3.60 billion daily active people in June 2026, up 3% year over year. This combined audience includes activity across Facebook, Instagram, WhatsApp and other Meta services.
- TikTok continues to generate measurable results for small businesses. In a 2026 survey cited by the platform, 89% of SMBs said their sales increased after promoting their businesses on TikTok.
- Business-related discovery is also rising on TikTok. Searches for the term “small business” increased 479% during Q1 2026, indicating stronger consumer interest in discovering independent companies through social content.
- LinkedIn remains particularly important for B2B acquisition. 89% of B2B marketers in cited research use LinkedIn for lead generation, while 62% say the platform actually generates leads for their businesses.
- YouTube continues to operate as both a social platform and major advertising channel. Its advertising revenue reached $11.1 billion in Q2 2026, increasing 13% year over year.
- TikTok Shop has expanded its commercial footprint across Europe. More than 100,000 businesses had joined the service across France, Germany, Italy, Spain and Ireland by 2026.
- TikTok Shop businesses in those European markets generated triple-digit growth in daily gross merchandise value between August 2025 and February 2026, showing that social commerce adoption extends well beyond the U.S. and Asia.
Social Media Advertising Spend, Performance, and ROI
- Social advertising remains a growth market. Meta reported that ad impressions across its family of apps increased 14% year over year in Q2 2026, giving advertisers access to substantially more inventory.
- Meta’s average price per advertisement also increased 12% year over year in Q2 2026, suggesting continued advertiser demand even as the company expanded impression volume.
- For comparison, Meta’s Q2 2025 ad impressions had increased 11% year over year, while average ad prices rose 9%. Both growth rates accelerated in Q2 2026.
- Across full-year 2025, Meta recorded a 12% increase in ad impressions and a 9% increase in average price per ad compared with 2024.
- YouTube generated $9.9 billion in advertising revenue in Q1 2026, an 11% year-over-year increase driven by both direct-response and brand advertising.
- YouTube advertising revenue then climbed to $11.1 billion in Q2 2026, 13% higher than a year earlier. Direct-response advertising remained an important contributor to growth.
- YouTube had generated approximately $9.8 billion in Q2 2025 advertising revenue, also up 13% year over year. The 2026 figure therefore represents another step up from an already large base.
- Short-form video generated the highest ROI among content formats for 21% of surveyed marketers in 2025, supporting continued advertising investment in Reels, TikTok and similar video formats.
- Instagram ranks as the most-cited social platform for ROI among marketers in current 2026 marketing research, strengthening its position for brands that need both reach and measurable commercial results.
Social Media Impact Measurement Statistics
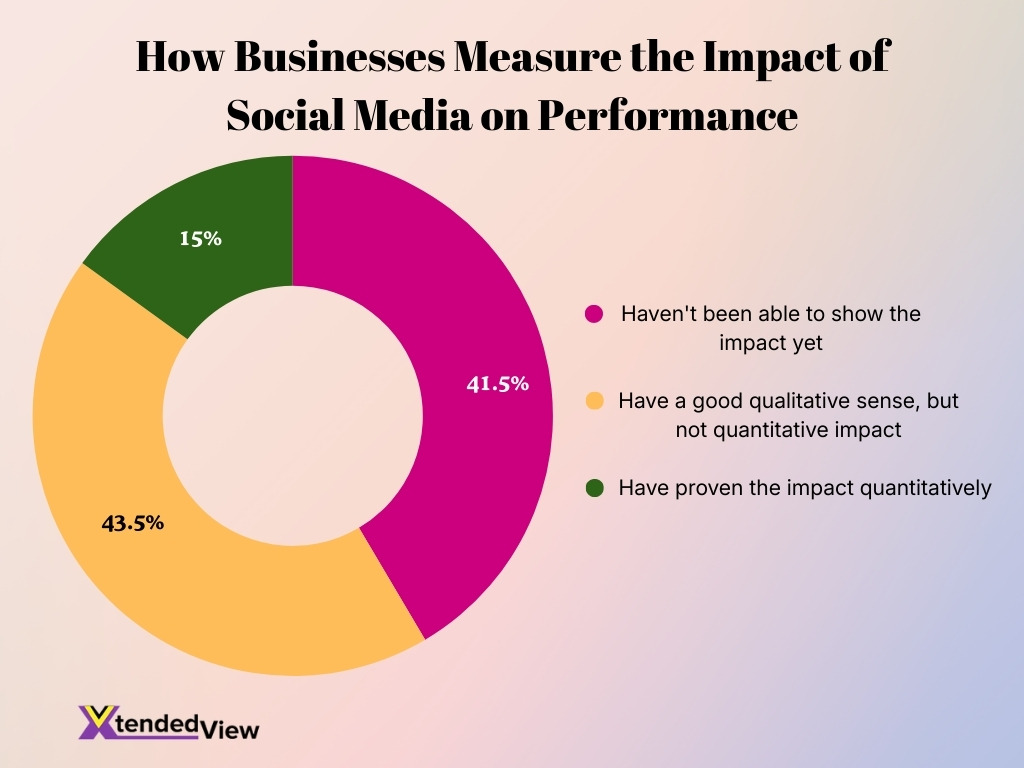
- 43.5% of businesses have a strong qualitative understanding of social media’s impact, but lack clear quantitative metrics to prove ROI.
- 41.5% of companies have not yet been able to demonstrate the business impact of social media through measurable data.
- Only 15.0% of organisations have successfully proven social media impact quantitatively, highlighting limited analytics maturity.
- Nearly 85% of businesses rely on estimates, assumptions, or indirect indicators instead of verified performance metrics.
- The data reveals a major measurement and attribution gap, preventing most brands from accurately linking social media to revenue, leads, and growth.
- These findings emphasise the urgent need for advanced analytics tools, better tracking systems, and ROI-focused strategies in social media marketing.
Social Media Engagement Rate Benchmarks
- Across industries, a recent 2026 benchmark puts average Instagram engagement at approximately 3.5%, making it one of the strongest major networks for organic interaction.
- LinkedIn follows closely at an average 3.4% engagement rate across industries in one 2026 benchmark, supporting its value beyond paid lead generation.
- Instagram Reels average approximately 2.8% engagement across industries, although rates vary considerably by business sector and audience size.
- X averages about 1.8% engagement, while Facebook averages 1.3% and TikTok averages 1.5% under the same cross-industry methodology.
- Different measurement methods produce different platform rates. Another 2026 analysis measured TikTok’s average engagement by followers at 2.70%, illustrating why brands should compare results using the same calculation method.
- That analysis found Instagram engagement by followers declined from 0.52% in Q1 2025 to 0.45% by Q1-Q2 2026.
- Facebook’s engagement by followers settled at approximately 0.13% by Q4 2025 and remained around that level through Q2 2026 under the same methodology.
- TikTok’s engagement by views increased from 3.85% in 2024 to 4.20% in 2025, representing a 9% year-over-year gain under another platform-specific benchmark methodology.
- LinkedIn’s average engagement rate reached 5.20% in a dedicated 2026 platform study, up 8% year over year. Native document posts led its formats at 7%.
- Instagram carousels remained resilient as engagement weakened overall. Their average engagement rate held at approximately 0.55%, while total Instagram engagement fell about 24% year over year in the measured dataset.
Social Commerce Statistics
- U.S. retail social commerce sales are projected to exceed $102 billion in 2026, representing roughly 18% growth from the previous year.
- Social platforms accounted for approximately 17% of online sales in 2025, showing that social networks now influence transactions rather than simply directing awareness.
- About 58% of U.S. shoppers report buying something after seeing it on social media, demonstrating how product discovery can translate directly into purchase behavior.
- Impulse purchasing is especially common. Roughly 81% of consumers say social media prompts them to make spontaneous purchases several times per year or more.
- Among those consumers, 28% make social-driven impulse purchases monthly, giving retailers a recurring opportunity to convert discovery into transactions.
- The global social commerce market was valued at approximately $1.48 trillion in 2025 and is projected to reach about $1.93 trillion in 2026 under one market-sizing model.
- Under the same projection, the worldwide market could reach approximately $17.83 trillion by 2033, implying a compound annual growth rate of 37.4% from 2026 through 2033.
- Asia-Pacific represented 72.3% of global social commerce revenue in 2025, making it the largest regional market and an important indicator of where Western social shopping may continue to develop.
- On TikTok, users are 1.6 times more likely to repurchase from brands when they can interact directly with those companies through comments or co-created content, according to 2025 platform research published in 2026.
- Direct social selling remains an expansion opportunity for marketers. 26% plan to explore selling products directly through social platforms in 2026, including tools such as Instagram Shops.
B2B Marketing Budget Allocation and Social Media Spend
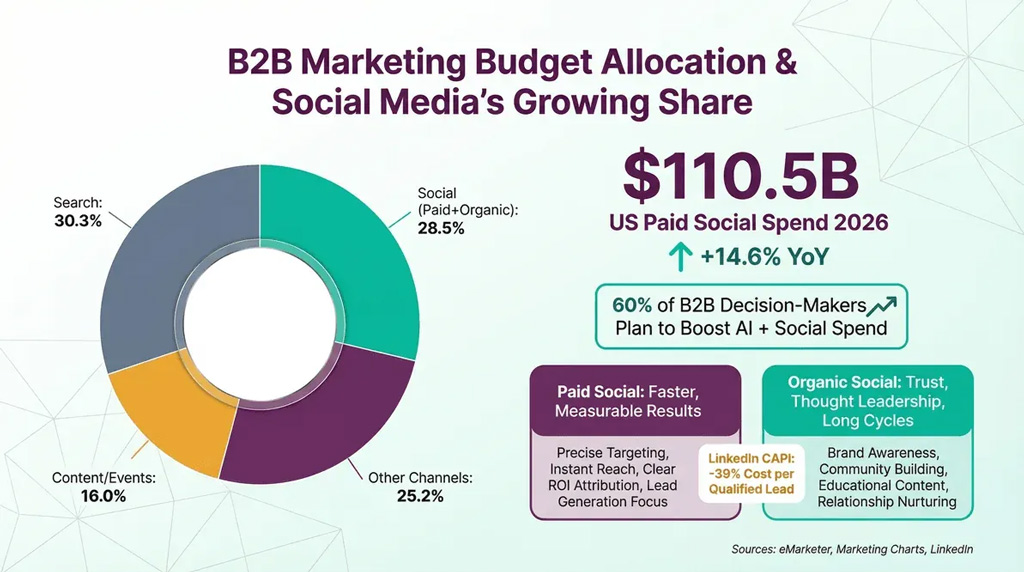
- Search remains the largest B2B marketing channel, accounting for 30.3% of total marketing budget allocation.
- Social media captures 28.5% of B2B marketing budgets when paid and organic social activities are combined.
- The gap between search and social media is only 1.8 percentage points, showing how closely social channels now compete with traditional search marketing.
- Other marketing channels account for 25.2% of budgets, placing them behind both search and social media in overall allocation.
- Content and events receive 16.0% of B2B marketing budgets, the smallest share among the four major categories shown.
- U.S. paid social media spending is projected at $110.5 billion in 2026, highlighting the scale of investment flowing into social advertising.
- Paid social spending is growing by 14.6% year over year, indicating continued momentum in businesses’ use of social platforms for advertising.
- Around 60% of B2B decision-makers plan to increase spending on AI and social media, signaling further investment in technology-driven marketing.
- Paid social media is positioned around faster and measurable results, including precise targeting, instant reach, ROI attribution and lead generation.
- Organic social media plays a different role, supporting brand awareness, thought leadership, community building and long-term customer relationships.
- LinkedIn’s Conversions API is associated with a 39% lower cost per qualified lead, illustrating the potential efficiency gains from improved social campaign measurement.
Influencer Marketing Statistics
- U.S. creator advertising expenditure was projected to reach $37 billion in 2025, up 26% year over year.
- Creator ad spending grew nearly four times faster than the broader media industry in 2025, highlighting the rapid shift of advertising budgets toward creators.
- U.S. creator advertising spending had already reached $29.5 billion in 2024, compared with $13.9 billion in 2021.
- That means creator advertising expenditure more than doubled between 2021 and 2024, before another sharp increase was projected for 2025.
- In 2026 marketing research, 60% of social media marketers planned to increase their influencer marketing investment, demonstrating that creators remain a budget priority.
- TikTok ranks first for planned influencer investment in a 2026 benchmark, with 31% of surveyed respondents selecting it for influencer activity.
- Other individual platforms captured approximately 8% to 15% of influencer investment selections in the same survey, placing TikTok clearly ahead for planned spending.
- One 2026 industry survey found 87.49% of respondents expected influencer budgets to rise, while only 5.55% expected decreases.
- Rising creator costs ranked as the leading influencer marketing challenge for 35.4% of respondents, making cost control increasingly important as brands scale partnerships.
- Influencer marketing also faces transparency challenges. A 2026 academic study examined 2 million YouTube videos from nearly 540,000 creators and found affiliate links widespread while disclosure compliance remained low.
Video Content and Short-Form Video Statistics
- 93% of video marketers say video remains an important part of their overall marketing strategy in 2026.
- Social media video is the most common individual business use case for video. 69% of video marketers reported creating videos specifically for social media in the 2026 survey.
- Businesses increasingly combine internal production with external resources. 32% use a mix of in-house teams and outside vendors, while 10% rely exclusively on external video providers.
- AI has entered the production process rapidly. 63% of marketers have used or currently use AI tools to help create marketing content, according to 2026 video marketing research.
- Short-form video remains particularly attractive for commercial content. 73% of consumers in cited research prefer short videos when researching products or services.
- Short-form video produced the highest ROI of any content format for 21% of marketers in 2025, helping explain continued investment in TikTok, Instagram Reels and YouTube Shorts.
- Video also dominates current social content trends. In a 2025 consumer survey, 57% wanted brands to create original recurring content series, almost matching the 58% who wanted brands to interact more directly with audiences.
- TikTok’s business results illustrate short-form video’s commercial potential: 89% of surveyed SMBs said sales increased after they promoted their businesses on the platform.
- A large-scale academic analysis of 248 million short-form videos found that ordinary creators had a higher probability of producing breakout content on short-video platforms than on the long-form comparison platform, highlighting the format’s discovery potential.
- Short-form video is also moving beyond traditional social apps. In August 2026, a major entertainment company announced a partnership that will bring selected creator-made vertical videos into its streaming service, illustrating how the short-form format now influences mainstream media distribution.
Key Benefits of Social Media Usage
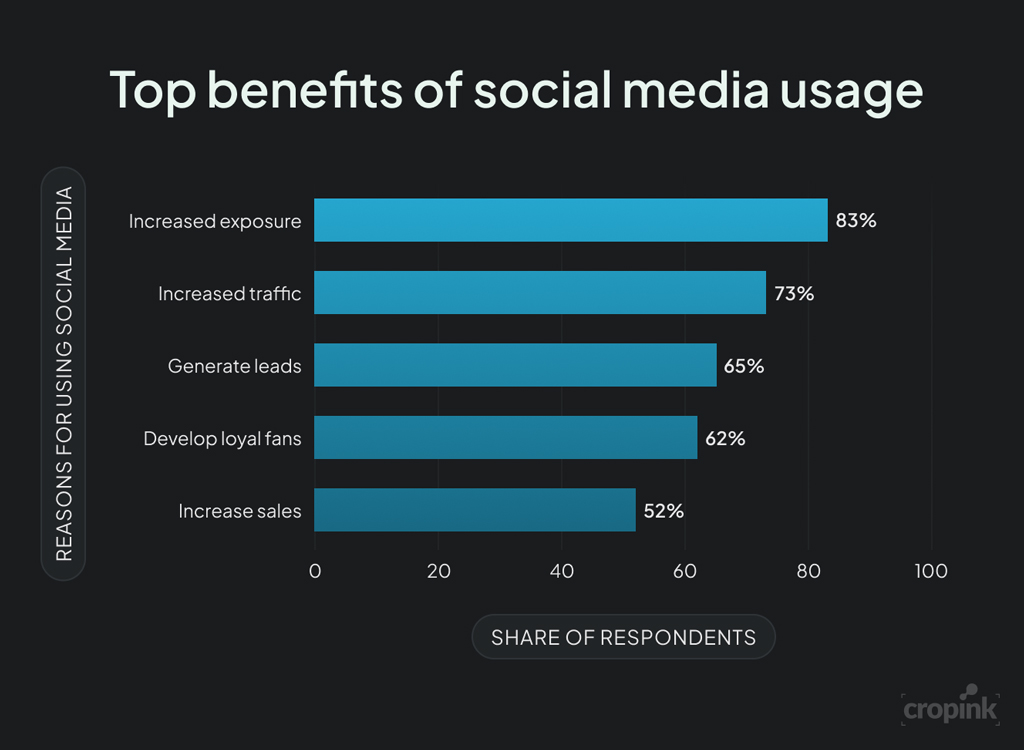
- Increased exposure is the leading benefit of social media usage, reported by 83% of respondents, highlighting its importance for improving brand visibility and audience reach.
- Around 73% of respondents said social media helps increase traffic, making it an important channel for directing potential customers toward websites and other digital properties.
- Generating leads was identified as a major benefit by 65% of respondents, showing how social platforms can support customer acquisition and business growth.
- About 62% of respondents reported that social media helps businesses develop loyal fans, emphasizing its role in building long-term relationships with audiences.
- Increasing sales was cited by 52% of respondents, indicating that more than half see social media as contributing directly to revenue-generating activities.
- The gap between increased exposure (83%) and increased sales (52%) is 31 percentage points, suggesting social media’s strongest perceived benefits occur higher in the marketing funnel.
- Overall, the figures show that social media delivers benefits across the customer journey, from brand exposure and traffic to lead generation, loyalty, and sales.
Social Media Customer Service Statistics
- 73% of consumers expect brands to respond to social media messages within 24 hours or sooner. Fast social support has therefore become a basic customer expectation rather than an added service.
- The cost of silence can be substantial: 73% of social media users say they will buy from a competitor when a brand fails to respond to them on social media.
- Social support is already common among consumers. 61% have contacted a company’s customer service team through social media within the previous year.
- Within that group, 24% of consumers had contacted customer service through social messaging during the previous month, while another 18% had done so within the previous week.
- Younger consumers show particularly strong demand for social support. 56% of Gen Z and 42% of millennials use newer platforms such as TikTok to communicate with brands.
- Instagram has become an important customer care channel for younger audiences. 72% of Gen Z users prefer Instagram for customer care over other channels in one current benchmark.
- Service expectations continue to accelerate across digital channels. In 2026, 88% of customers expect faster response times than they did one year earlier.
- Around 74% of consumers now expect customer service to be available 24/7, increasing the pressure on businesses to combine human teams with automation and self-service tools.
- AI is becoming acceptable when speed matters. 51% of consumers say they prefer interacting with a bot rather than a human when they need immediate customer service.
Mobile vs Desktop Social Media Usage
Mobile devices remain essential to social media strategy, although overall web-device market share provides a broader context rather than a platform-specific measure. Businesses should therefore optimize social creative, landing pages, and checkout experiences for smartphones while still accounting for desktop-heavy U.S. audiences.
- Mobile devices generated 52.57% of worldwide web activity in July 2026, compared with 45.93% for desktop computers.
- Tablets contributed another 1.50% of global activity, leaving smartphones as the largest individual device category worldwide.
- The U.S. differs from the worldwide pattern. Desktop devices represented 53.88% of U.S. activity in July 2026, compared with 43.97% for mobile.
- Tablets accounted for 2.15% of U.S. activity, indicating that businesses targeting Americans should continue testing both desktop and mobile conversion experiences.
- North America as a whole remained desktop-leaning in July 2026, with 53.68% desktop usage compared with 46.32% mobile usage when those two categories were measured directly.
- Mobile dominates much more strongly in large emerging digital markets. In India, smartphones accounted for 66.04% of web activity in July 2026, versus 33.39% for desktop computers.
- Smartphone access is nearly universal among U.S. adults. 91% owned a smartphone in 2025, up dramatically from 35% when smartphone ownership was first measured in 2011.
- Another 16% of U.S. adults are smartphone-only internet users, meaning they own smartphones but do not have home broadband subscriptions. Social campaigns may therefore serve as an important digital touchpoint for these consumers.
- Globally, the number of unique mobile users reached 5.83 billion in April 2026, representing 70.4% of the world’s population and an increase of 103 million users over 12 months.
Industry-Specific Social Media Statistics
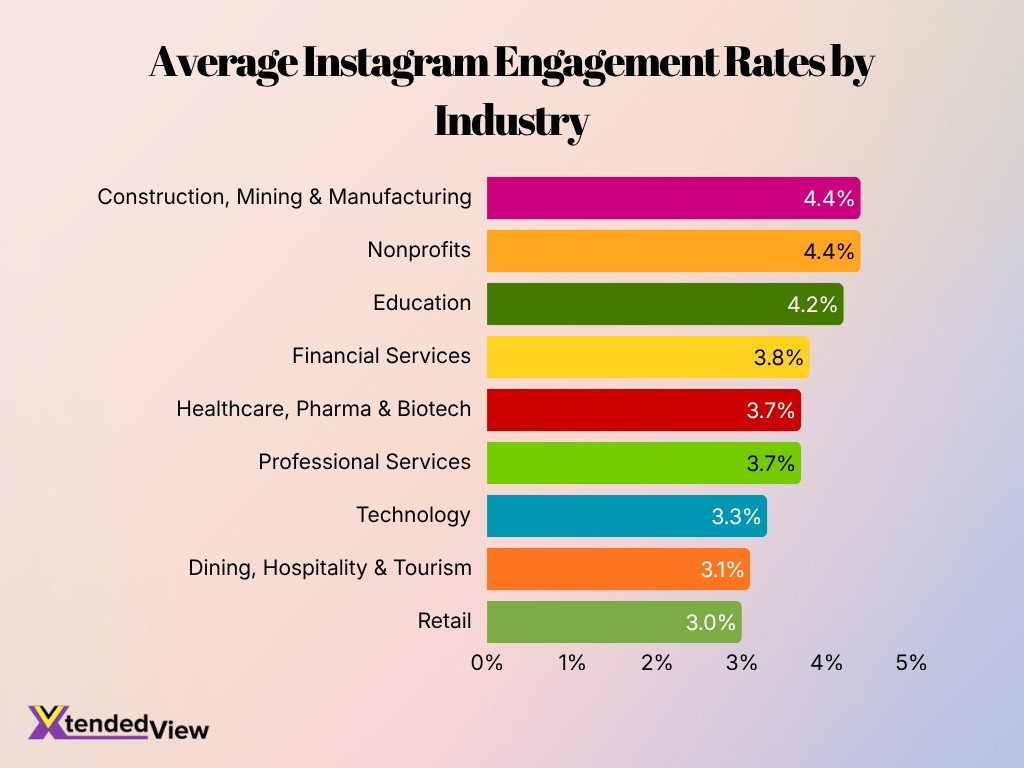
Social performance varies significantly by sector. A strong engagement rate for a technology company, for example, may look weak for a nonprofit or manufacturing business, making industry-specific benchmarking important.
- Education organizations average approximately 4.2% Instagram engagement, compared with 3.1% for Instagram Reels and 2.8% on LinkedIn in the latest industry benchmark.
- Financial services companies average 3.8% Instagram engagement and 3.2% on LinkedIn, while TikTok averages 1.6% for the sector.
- Dining, hospitality and tourism companies achieve their highest listed average on LinkedIn at 3.9% engagement, ahead of Instagram at 3.1%.
- Healthcare, pharmaceutical and biotechnology organizations average 3.7% Instagram engagement, compared with 3.3% on LinkedIn, 1.9% on Facebook and 1.0% on TikTok.
- Professional services businesses, including real estate and legal companies, average 3.7% Instagram engagement and 3.2% on LinkedIn. Their TikTok benchmark is considerably lower at 0.9%.
- Construction, mining and manufacturing brands post some of the strongest engagement figures in the dataset. Their average Instagram engagement reaches 4.4%, while LinkedIn averages 4.0% and TikTok 2.6%.
- Nonprofits also perform strongly on visual platforms. Average Instagram engagement reaches 4.4%, and Instagram Reels average 4.0%.
- Technology companies average 3.6% engagement on LinkedIn, compared with 3.3% on Instagram, 2.2% on X and just 0.7% on TikTok.
- Retail businesses show a different pattern. LinkedIn averages 3.9% engagement, while Instagram averages 3.0%, Instagram Reels 2.4%, TikTok 1.6% and Facebook 1.0%.
- Posting volume does not guarantee higher engagement. Healthcare organizations, for example, publish an average of 11.4 Facebook posts per week, yet the strongest reported Facebook engagement occurs around a much lower posting frequency of two posts per week.
Social Media Trends and Future Projections
- Social media remains one of the fastest-growing major U.S. advertising channels. Social advertising expenditure is forecast to increase 14.6% in 2026, compared with 9.5% growth for total U.S. advertising spending.
- Creator advertising is becoming a core media category. U.S. creator ad expenditure is forecast to reach $44 billion in 2026, as brands move creator partnerships into regular media planning.
- Nearly 48% of creator ad buyers now describe creator advertising as a “must buy,” placing creators just behind paid search and social media among essential digital channels.
- Digital video will keep absorbing advertising budgets. U.S. digital video ad expenditure is expected to surpass $80 billion in 2026, representing 11% year-over-year growth.
- TikTok Shop is projected to generate $23.41 billion in U.S. ecommerce sales in 2026, representing 48% year-over-year growth and reinforcing the convergence of entertainment, recommendations and checkout.
- More than half of U.S. social buyers are expected to use TikTok for shopping in 2026, with the platform forecast to reach 51% of social buyers.
- Mobile advertising will remain central to the market. Current forecasts indicate that 82.9% of social media advertising expenditure could come through mobile devices by 2030.
- AI-driven customer interactions will become more common. By 2028, 60% of brands are forecast to use agentic AI to support streamlined one-to-one customer interactions.
- Competition for digital advertising budgets is also shifting. Meta’s net digital advertising revenue is projected to reach $243.46 billion in 2026, with annual growth of 24.1%, potentially placing it ahead of Google’s digital advertising business.
- Meanwhile, social audiences continue to expand rather than contract. Global social media user identities reached 5.79 billion in April 2026, equal to 69.9% of the world’s population.
Frequently Asked Questions (FAQs)
Global social media user identities reached about 5.79 billion in April 2026, representing roughly 69.9% of the world’s population.
U.S. social media ad spending is forecast to grow by 14.6% in 2026, compared with 9.5% growth for the overall U.S. advertising market.
U.S. social media advertising revenue reached $117.7 billion in 2025, up 32.6% year over year, an increase of about $29 billion.
U.S. social commerce sales are projected to exceed $100 billion in 2026, after reaching $87.02 billion in 2025 and growing an estimated 18% year over year.
About 94% of social media marketers use AI in their workflows in some capacity, representing a 32% year-over-year increase.
Conclusion
Social media for business now connects marketing, commerce, advertising and customer service within the same customer journey. Businesses increasingly use social platforms to generate leads, influence purchases, provide support and build long-term customer relationships.
The statistics also show that success depends on more than audience size. Businesses need responsive customer care, platform-appropriate content, strong video and creator strategies, mobile-friendly experiences and clear ROI measurement. As social commerce, creator advertising and AI-driven interactions expand, companies that connect social activity to measurable business outcomes will be best positioned to capture the opportunity.
