



Small businesses remain a major force in the U.S. economy, accounting for 99.9% of American businesses and employing more than 62 million people. They support local communities, supply chains, professional services, retail, construction, technology, health care and many other industries. Small firms also contribute substantially to job creation and economic activity, while new business applications continue to show strong entrepreneurial interest across the country.
At the same time, small business owners are operating in a changing environment shaped by higher costs, financing conditions, labor challenges, digital competition and rapid adoption of artificial intelligence. Understanding current small business statistics helps owners, investors, policymakers and marketers evaluate where growth is occurring, which industries and regions are expanding, and what challenges may affect business performance.
Editor’s Choice
These figures provide a quick snapshot of the scale, employment contribution and entrepreneurial momentum of U.S. small businesses in 2026.
- 36.2 million: The U.S. has 36,207,130 small businesses according to the latest published national count.
- 99.9%: Nearly every U.S. business falls within the small business category under the research definition used for national statistics.
- 62.3 million: Small businesses employ more than 62 million people nationwide.
- 45.9%: Almost 46% of private-sector workers work for small businesses.
- 43.5%: Small businesses account for an estimated 43.5% of U.S. GDP.
- 88.9%: Small businesses supplied nearly nine-tenths of net U.S. job growth from March 2023 through March 2024.
- 578,926: Entrepreneurs filed this many business applications in July 2026 on a seasonally adjusted basis.
Recent Developments
- July 2026 produced 578,926 business applications, up 8.1% from June on a seasonally adjusted basis.
- Applications submitted in July 2026 are projected to produce 29,959 employer business formations within four quarters, up 0.7% from the comparable June projection.
- The 2026 employer-firm survey found that revenue and employment growth remained broadly stable between the 2024 and 2025 survey periods.
- However, businesses remained slightly more likely to report decreasing rather than increasing revenue during the previous 12 months.
- Expectations for future revenue growth fell to their lowest level since the 2020 survey, signaling greater caution among small employers entering 2026.
- Employment-growth expectations also dropped to their lowest level since the 2020 survey.
- In the preceding 2024 survey, 57% of employer firms reported reaching customers and growing sales as an operational challenge, up from 53% in 2023.
- In that same survey, 75% of firms cited rising costs for goods, services or wages as a financial challenge, while 56% struggled with operating expenses and 51% reported uneven cash flow.
- A proposed August 2026 change to federal size standards could add more than 110,000 businesses to qualifying small business categories if the proposal becomes final.
How Many Small Businesses Are There?
- The latest 2026 national count puts the number of U.S. small businesses at 36,207,130.
- Small businesses constitute 99.9% of businesses nationwide.
- About 29,811,495 small businesses have no employees, meaning the owner operates without paid payroll employees.
- Nonemployer businesses account for 82.3% of U.S. small businesses, making solo and owner-operated firms the dominant business structure by count.
- The country has approximately 6,395,635 small employer firms, representing 17.7% of small businesses.
- In comparison, the latest dataset identifies only 21,041 large businesses, underscoring the numerical dominance of small companies.
- The number of small employer firms has increased every year since 2011, indicating a long-running expansion in the employer-business population.
- The number of nonemployer firms rose from 15.4 million in 1997 to 29.8 million in 2022, an increase of more than 14 million businesses.
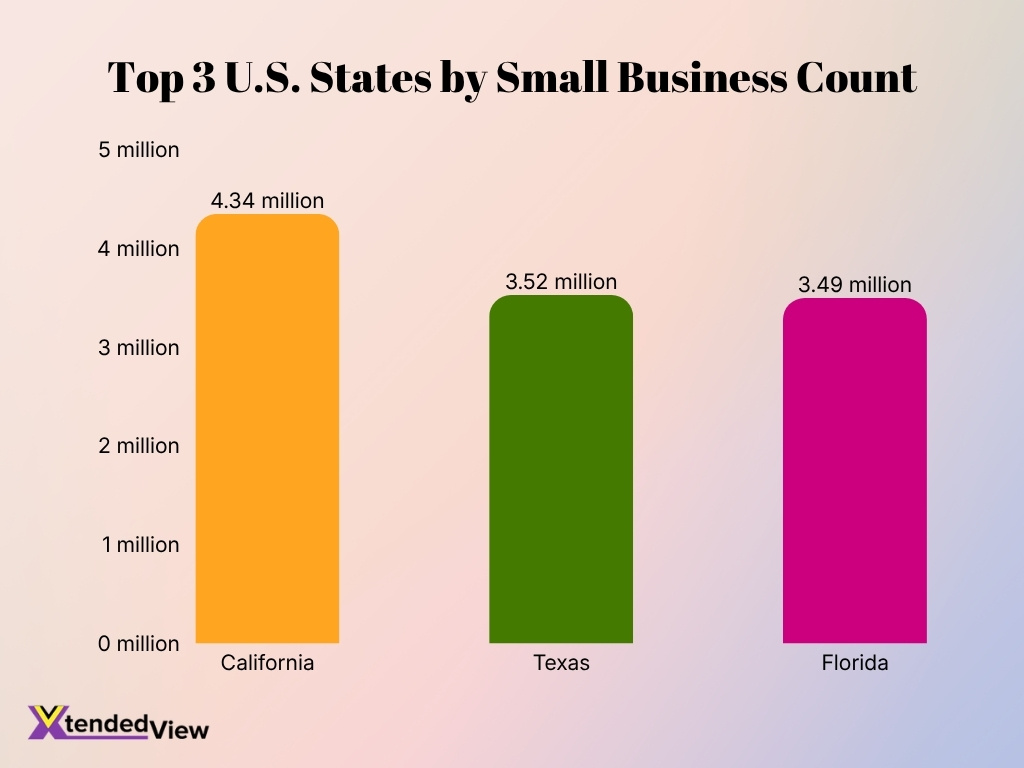
- California led the country in the 2025 profiles with approximately 4.34 million small businesses, followed by Texas at 3.52 million and Florida at 3.49 million.
Small Business Growth and New Business Formation Statistics
- U.S. entrepreneurs filed 578,926 business applications in July 2026, after seasonal adjustment.
- July’s application volume represented an 8.1% month-over-month increase from June 2026.
- July 2026 applications are projected to produce 29,959 employer startups within four quarters of application.
- The projected four-quarter formation count increased 0.7% from June 2026, pointing to a modest rise in expected employer-business creation.
- Monthly business-formation data now provide 12 application and formation series, allowing analysts to distinguish applications from projected and realized employer formations.
- Monthly formation data extend back to July 2004, providing more than two decades of comparable entrepreneurial activity data.
- Annual county-level business application data available in 2026 now cover 2005 through 2025, making it possible to examine entrepreneurship below the state level.
- From March 2023 through March 2024, small businesses opened approximately 1.1 million establishments, while 982,940 small business establishments closed.
- Across businesses of all sizes during that period, 1,281,290 establishments opened and 1,125,979 closed, producing a net increase of 155,311 establishments.
Small Business Survival, Success, and Failure Rate Statistics
- Historical establishment data show that roughly four out of five new establishments survive their first year in many cohorts, although the exact rate varies by year and location.
- Five-year survival rates have commonly remained near or above 50% across multiple startup cohorts. For example, businesses born in 2018 recorded a 57.3% five-year survival rate.
- The five-year survival rate for establishments born in 2010 reached 56.0%, compared with 49.8% for businesses born in 2006.
- Among establishments launched in March 2013, 34.7% remained operational 10 years later in March 2023.
- The same 2013 cohort shows major industry differences: 50.5% of agriculture, forestry, fishing and hunting establishments survived through 2023.
- Manufacturing establishments from that cohort posted a 43.6% 10-year survival rate, substantially above the overall cohort rate.
- Construction establishments born in 2013 recorded a 40.1% 10-year survival rate, after starting with a 76.0% one-year survival rate.
- Other services establishments from the same cohort had a 39.6% survival rate after 10 years, compared with 82.5% after the first year.
- Economic timing matters: startup cohorts that encounter recessions early in their lives generally record lower five-year survival rates than businesses founded during corresponding recovery periods.
Small Business Survival Declines Sharply Over Time
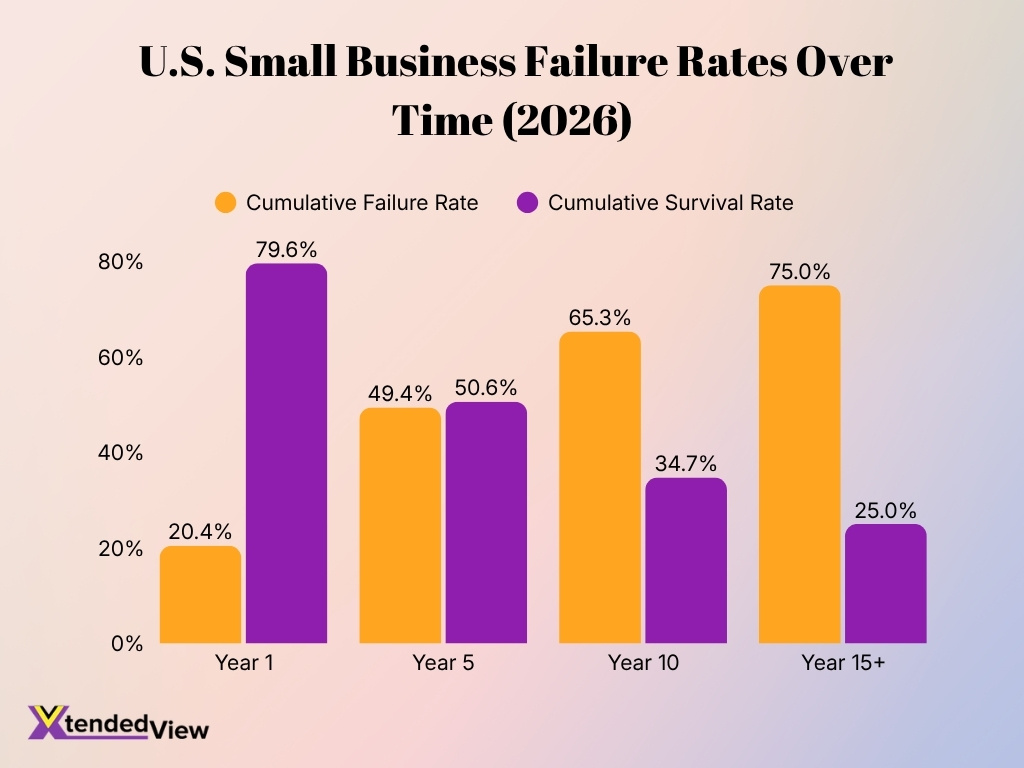
- About 20.4% of U.S. small businesses fail within their first year, while 79.6% survive beyond the initial 12 months.
- By Year 5, the cumulative failure rate rises to 49.4%, meaning only 50.6% of small businesses remain operational.
- At the 10-year mark, nearly two-thirds of small businesses (65.3%) have failed, leaving a survival rate of just 34.7%.
- After 15 years or more, the cumulative failure rate reaches 75.0%, indicating that only one in four small businesses (25.0%) survives long term.
- Overall, the figures show that business survival steadily declines with age, falling from 79.6% after Year 1 to 25.0% after Year 15.
Why Do Small Businesses Fail?
- 75% of employer firms reported rising costs for goods, services or wages as a financial challenge in the 2024 survey, compared with 77% a year earlier.
- Paying operating expenses became a problem for 56% of firms, up from 52% in the prior survey.
- Uneven cash flow affected 51% of small employer firms, rising from 49% a year earlier.
- Weak sales affected 48% of surveyed firms, compared with 44% in the previous year.
- 35% of firms reported debt payments or interest rates as a financial challenge, one percentage point higher than the prior survey.
- Credit availability created difficulties for 28% of firms, illustrating how financing constraints can compound operating pressure.
- Only 6% of employer firms said they experienced no financial challenges in the 2024 survey, down from 7% a year earlier.
- Reaching customers and growing sales affected 57% of firms in 2024, compared with 53% in 2023, making customer acquisition the most commonly cited operational problem.
- Conditions remained difficult in the 2025 survey: rising costs again ranked as the leading financial challenge, while reaching customers and growing sales remained the leading operational challenge.
- More than 40% of firms in the 2025 survey reported tariff-related cost increases as a financial challenge, adding another source of margin pressure for companies that depend on imported goods or materials.
Small Business Revenue and Earnings Statistics
- Revenue growth remained broadly stable between the 2024 and 2025 surveys, although firms were still slightly more likely to report falling revenue than rising revenue over the previous 12 months.
- The revenue expectations index fell 6 points, from 39 to 33, reaching its lowest level since the 2020 survey.
- The previous survey had already recorded a 7-point decline in the revenue performance index, following a 3-point decline one year earlier.
- In 2024, 48% of firms identified weak sales as a financial challenge, up from 44% in 2023.
- About one in five employer firms reported sales to customers outside the United States in 2024.
- Among firms with international customers, most generated less than 10% of total sales from those customers.
- Looking toward 2025 international sales, 40% expected a decline, while only 16% expected an increase compared with 2024.
- Among firms facing higher prices for imported inputs, 76% passed at least part of the increase to customers, while 60% absorbed at least some of the additional cost themselves.
- Businesses using AI provided one emerging revenue signal: 31% of AI-using firms said the technology had contributed to higher sales.
- U.S. employer and nonemployer businesses together generated approximately $50 trillion in receipts in 2023, showing the scale of the business economy in which small firms operate.
Small Businesses Drive the Majority of Net New Job Creation
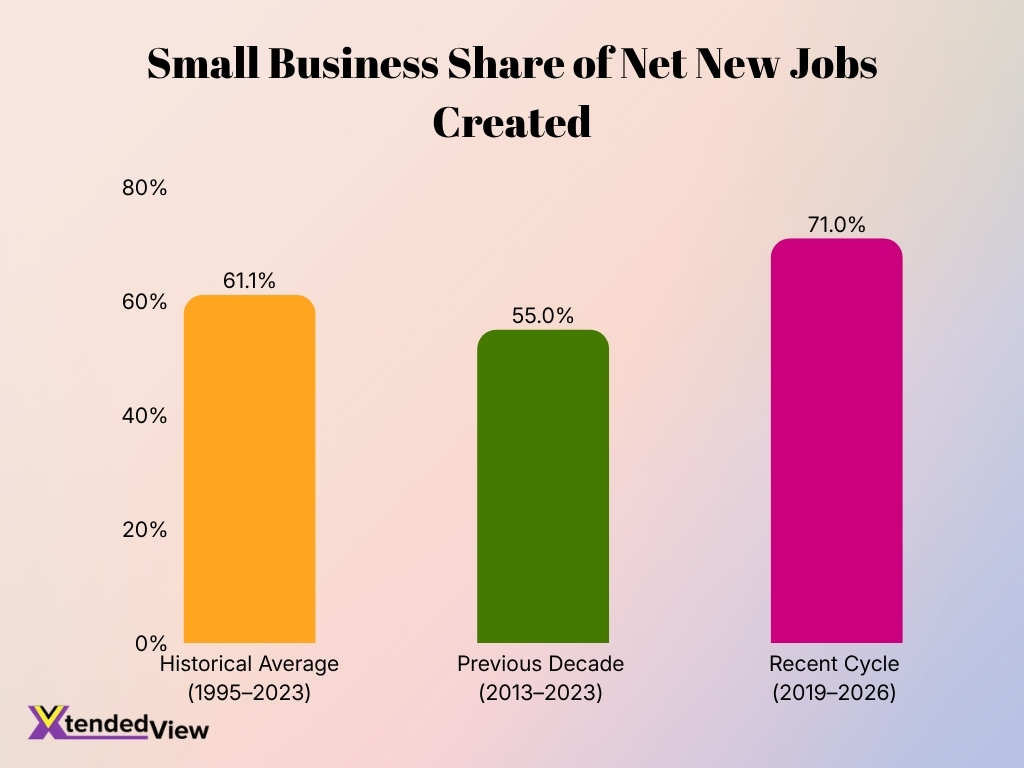
- Small businesses accounted for 61.1% of net new jobs created during the historical 1995–2023 period.
- During the 2013–2023 decade, their share stood at 55.0%, still representing more than half of net new job creation.
- In the more recent 2019–2026 cycle, small businesses generated 71.0% of net new jobs, the highest share among the periods shown.
- The recent 71.0% share is 15 percentage points higher than the 55.0% recorded during 2013–2023.
- Overall, the figures highlight the growing role of small businesses as a major engine of employment growth, particularly in the most recent economic cycle.
Economic Impact of Small Businesses
- Small businesses generate approximately 43.5% of U.S. GDP, based on the latest estimate available in 2026.
- Small firms pay 38.7% of total private-sector payroll, directly linking their activity with household income across the country.
- They employ 45.9% of private-sector workers, or approximately 62.3 million people.
- Small businesses have generated 61% of net new U.S. jobs since 1995, equivalent to 20.7 million net positions through 2024.
- In the latest annual establishment period, small firms accounted for 88.9% of the net national job increase.
- Small companies represent 97.2% of identified U.S. goods exporters, totaling approximately 270,014 exporting firms.
- Small business exporters generated about 33% of identified U.S. goods exports, demonstrating that international trade is not limited to large corporations.
- The latest underlying trade figures place small-firm goods exports at approximately $588.4 billion out of $1.8 trillion in identified exports.
- About 48% of surveyed small employer firms sourced at least some inputs internationally in 2024, showing that global supply chains affect many small companies even when they do not export.
- 14% of firms sourced more than half of their inputs from outside the United States, making changes in international prices, logistics and trade policy especially important for that group.
Small Business Statistics by Industry
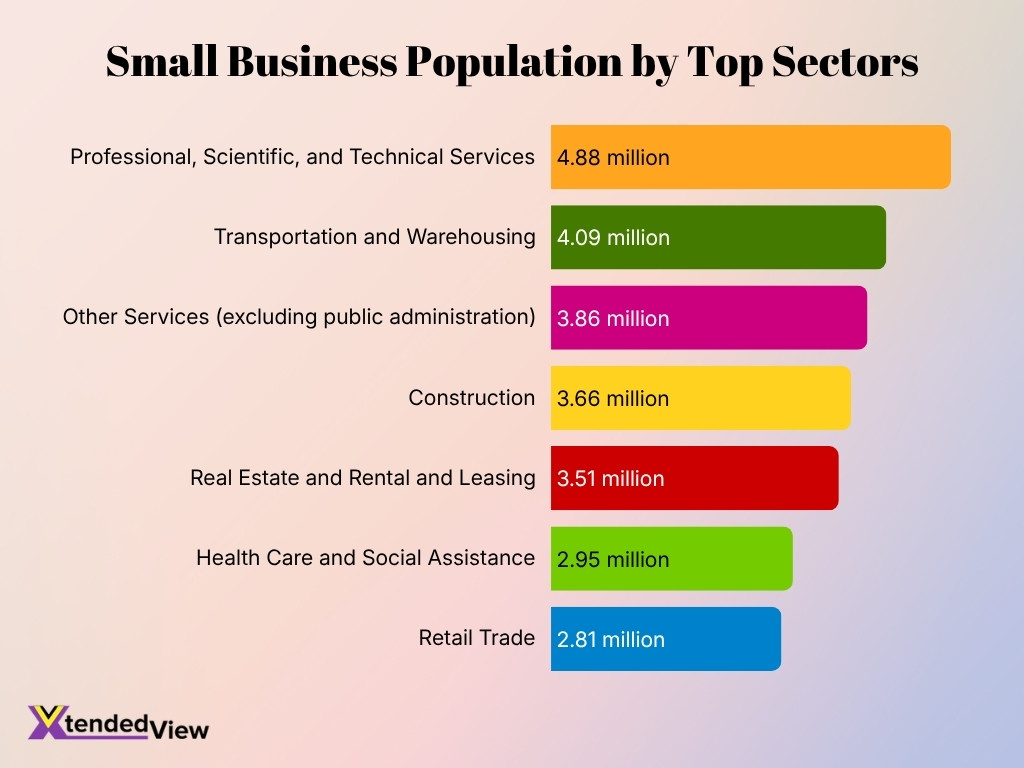
- Professional, scientific and technical services contain about 4.88 million small businesses, making the sector the largest by small-business count in the latest national industry data.
- Transportation and warehousing contains approximately 4.09 million small businesses, with about 3.85 million operating without employees.
- Other services, excluding public administration, contains approximately 3.86 million small businesses.
- Construction accounts for roughly 3.66 million small businesses, placing it among the country’s largest small-business sectors.
- Real estate and rental and leasing contains approximately 3.51 million small businesses, most of which operate without paid employees.
- Health care and social assistance contains roughly 2.95 million small businesses, including about 95,500 firms with 20 to 499 employees in the underlying national data.
- Retail trade includes approximately 2.81 million small businesses, including about 586,000 firms with one to 19 employees.
- Accommodation and food services contains approximately 1.20 million small businesses, including about 126,000 firms with 20 to 499 employees.
- Manufacturing includes approximately 633,000 small businesses, including about 57,000 with 20 to 499 employees.
- Industry exposure to 2025 cost increases differed substantially: 69% of retail firms and 62% of manufacturing firms reported tariff-related cost challenges, the highest rates highlighted in the latest small employer survey.
Small Business Owner Demographics
- Among reporting employer-business owners, approximately 51.3% were age 55 or older in the latest age dataset, including 1.19 million ages 55 to 64 and about 971,000 ages 65 or older.
- Owners ages 65 and older represented about 23.1% of reporting employer-business owners in that dataset.
- Among nonemployer business owners, women ages 35 to 44 accounted for 22.9% of female owners in the 2021 demographic distribution, the largest female age group.
- Women ages 25 to 34 represented 20.2% of female nonemployer owners, compared with 16.6% among men.
- Among male nonemployer owners, 17% were age 65 or older, compared with 12.3% of female owners.
- The 45-to-54 age group represented roughly 20% of both male and female nonemployer owners, making ownership comparatively balanced by sex in that age band.
- Research on women employer owners found that 70.5% of women ages 35 to 44 considered balancing work and family a very important reason for business ownership.
- Among women ages 25 to 34, 67.1% also rated work-family balance as a very important motivation for ownership.
- Flexible hours ranked as very important for 64.6% of women owners ages 25 to 34 and 65.6% of those ages 35 to 44.
- Women ages 45 to 54 and 55 to 64 recorded ownership-rate declines of 5.5% and 4.8%, respectively, between 2012 and 2020, indicating shifts in entrepreneurship among mid- and late-career women.
Women-Owned and Minority-Owned Small Business Statistics
- Women owned approximately 14.2 million U.S. businesses in 2023, generating about $2.8 trillion in receipts.
- Among employer firms, women owned approximately 1.4 million businesses, representing 22.9% of the employer-firm population.
- Women owned about 12.9 million nonemployer businesses, equal to 42.3% of firms without employees, and generated $423.1 billion in receipts.
- Asian-owned employer firms totaled approximately 685,000, representing 11.5% of employer businesses and producing roughly $1.2 trillion in receipts.
- Hispanic-owned employer firms totaled approximately 496,000, or 8.4% of employer businesses, with $730.3 billion in receipts.
- Black-owned employer firms totaled approximately 201,000 and generated about $249 billion in receipts.
- Black-owned employer businesses supported approximately 1.9 million employees and $69.8 billion in annual payroll in the latest demographic release.
- Hispanic entrepreneurs owned about 5.3 million nonemployer businesses, or 17.5% of the nonemployer total, and generated $244.2 billion in receipts.
- Black entrepreneurs owned approximately 4.4 million nonemployer businesses, representing 14.4% of the total, with $128.7 billion in receipts.
- American Indian or Alaska Native owners operated about 55,000 employer firms and 378,000 nonemployer businesses, while Native Hawaiian and Other Pacific Islander owners operated about 9,000 employer and 102,000 nonemployer firms.
Key Reasons Entrepreneurs Start Small Businesses
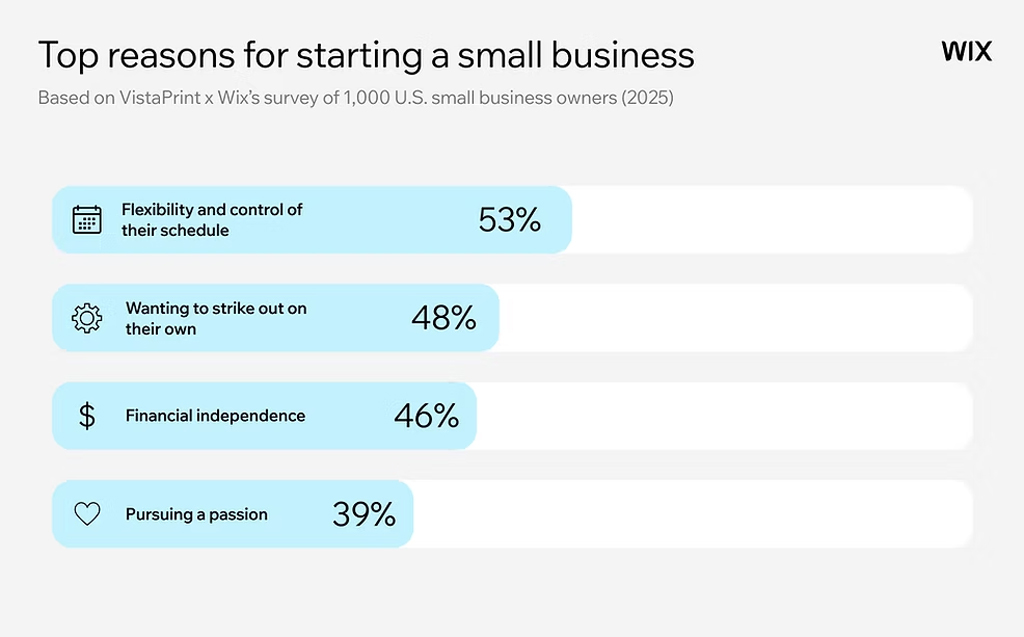
- Flexibility and control over their schedule is the leading motivation, cited by 53% of U.S. small business owners.
- 48% of small business owners say they started a business because they wanted to strike out on their own.
- Achieving financial independence is another major driver, motivating 46% of surveyed small business owners.
- Pursuing a passion motivates 39% of entrepreneurs, showing that personal interests remain an important factor in business ownership.
- Overall, the data suggests that greater autonomy, independence, and financial freedom are stronger motivations than passion alone for starting a small business.
Small Business Statistics by State and Region
- California leads the country with approximately 4.34 million small businesses, according to the latest state-level profiles.
- Texas ranks second with about 3.52 million small businesses, reflecting its large population and broad mix of service, construction and trade businesses.
- Florida follows closely with approximately 3.49 million small businesses, making the three largest states home to more than 11 million small firms combined.
- Florida’s small businesses employ approximately 3.8 million workers, representing 39.6% of private-sector employment in the state.
- Between March 2023 and March 2024, Florida recorded 100,178 small business establishment openings and 85,944 closings.
- Small businesses generated 77.4% of Florida’s net job increase during the same period, contributing 139,887 net jobs.
- Montana has the country’s highest small business share of private employment at 66.3%, illustrating the larger role small employers play in less-populated states.
- Wyoming ranks second on this measure, with small businesses employing 65.2% of private-sector workers. The state contains 81,924 small businesses and 135,636 small business employees.
- Vermont ranks third, with 62.1% of private-sector employment located at small businesses.
- At the metropolitan level, the New York-Newark-Jersey City area contains about 2.6 million small businesses and 4.1 million small business employees, while small firms account for 53.6% of employment in the Miami-Fort Lauderdale-West Palm Beach area.
Small Business Financing and Lending Statistics
- 60% of employer firms sought some form of financing during the 12 months leading up to the 2025 survey, slightly above the 59% reported in the previous survey.
- Among financing applicants, 42% received the full amount requested in the 2025 survey, compared with 41% in the prior survey.
- Another 36% received some or most of the financing they sought, while 22% received none. A year earlier, 24% received none.
- Meeting operating expenses remained the leading reason for borrowing, cited by 56% of firms seeking financing, while 46% sought funds to pursue expansion or a new opportunity.
- 38% of firms applied specifically for a loan, line of credit or merchant cash advance, compared with 37% in the 2024 survey.
- Small-bank applicants had a 57% full-approval rate in the 2025 survey, up from 54% in the prior survey and higher than approval levels at other lender types.
- Online lender use has increased markedly: 29% of applicants used an online lender in 2025, compared with 17% in the 2020 survey.
- However, 60% of online-lender borrowers said their actual borrowing costs exceeded expectations. The comparable shares were 37% for small-bank borrowers and 32% for large-bank borrowers.
- Federally backed lending reached a record level in fiscal 2025, with approximately 84,400 loans totaling $44.8 billion across the two major lending programs. That included about $37 billion through 77,600 general-purpose loans and $7.8 billion through 6,750 fixed-asset loans.
- Starting July 4, 2026, eligible borrowers gained the ability to combine the two major programs for as much as $10 million in cumulative financing, double the previous $5 million ceiling.
Top Concerns for U.S. Small Business Owners
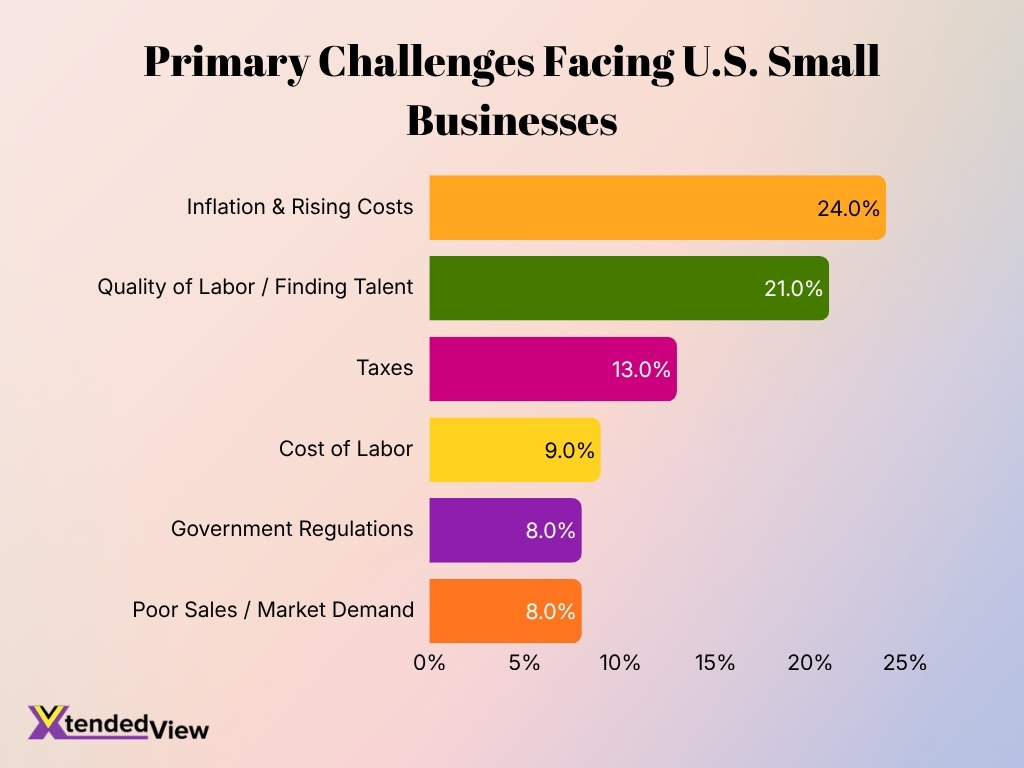
- Inflation and rising costs rank as the leading challenge, cited by 24% of small business owners.
- Finding quality labor and talent follows closely, with 21% of owners identifying it as a top concern.
- Taxes remain a significant pressure, affecting 13% of small business owners.
- Labor costs are a major concern for 9% of owners, adding to broader workforce-related pressures.
- Government regulations are cited as a top challenge by 8% of small business owners.
- Poor sales and weak market demand also concern 8% of owners, highlighting ongoing revenue and customer acquisition challenges.
Small Business Technology and AI Adoption Statistics
- 46% of small employer firms reported using AI for work in the 2025 survey, making AI a mainstream business tool for nearly half of participating employers.
- Another 15% planned to adopt AI within 12 months, while 33% had no plans to use it and 6% remained unsure.
- Among businesses already using AI, 49% were experimenting with it, 44% had partially integrated it and only 7% considered AI fully integrated into business processes.
- Writing and marketing ranked as the leading application, used by 83% of AI-adopting firms. Individual productivity followed at 61%, while 51% used AI for planning or analysis.
- 71% of AI users reported increased productivity, making efficiency the most common measurable benefit associated with adoption.
- Another 39% reported better product or service quality, while 31% linked AI use with increased sales.
- Accuracy remained the most commonly reported implementation problem, affecting 46% of businesses using AI; 43% struggled to adapt available tools to their specific business needs.
- Among companies planning AI adoption, 54% struggled to identify tools suited to their business, while 37% cited the time required for implementation or employee training.
- A separate 2025 technology survey found 99% of small businesses used at least one technology platform, 58% used four or more tools and about one-third used at least six.
- Cybersecurity investment has accompanied digital adoption: 47% of surveyed small and midsize businesses implemented or upgraded cybersecurity technologies during the prior year.
Small Business Marketing, Website, and Digital Presence Statistics
- 83% of small businesses had a website in a 2025 survey, up sharply from 64% in 2018.
- 12% of small businesses launched a website during the previous year, showing continued growth even with website ownership already above four-fifths of firms.
- Among firms investing in a website, 39% cited increasing sales and revenue as a reason, while 24% wanted greater brand awareness and credibility and 22% focused on information or customer support.
- Website-building platforms dominate development: 41% used no-code builders and 34% used low-code content or commerce platforms, while only 12% relied on fully custom-built sites.
- Among businesses without a website, 34% said a site was not relevant to their industry, and 28% had no online presence at all.
- Social media remains influential: 76% of surveyed businesses using social media said it had a positive effect on business performance.
- 73% wanted to expand onto additional social platforms, although 56% said competing responsibilities made it difficult to prioritize social media.
- Content production creates a persistent constraint: 54% struggled to produce enough material for multiple platforms, and the same share struggled to keep content current with social media trends.
- Facebook remained the most widely used social platform in one 2025 small business survey, with 82% using it for product promotion and customer engagement; TikTok adoption reached 58%.
- Marketing remains a high spending priority: 58% of small businesses rated marketing and sales as a very important investment area, while 44% said the same about the digital customer experience and 43% about technology and software.
Frequently Asked Questions (FAQs)
There are 36,207,130 small businesses in the U.S., representing 99.9% of all businesses.
Small businesses employ 62.3 million people, equal to 45.9% of private-sector workers.
Small businesses account for approximately 43.5% of U.S. GDP and 38.7% of private-sector payroll.
The U.S. recorded 578,926 business applications in July 2026, an 8.1% increase from June.
46% of surveyed small employer firms reported using AI, while another 15% planned to adopt it within the next 12 months.
Conclusion
Small businesses remain central to U.S. employment, entrepreneurship and economic activity. More than 36 million small firms operate nationwide, and they collectively employ tens of millions of workers, contribute a substantial share of private-sector payroll and generate a large portion of net new jobs. Their influence extends across nearly every major industry and region, from professional services and construction to retail, manufacturing and health care.
However, the statistics also show that small business performance varies widely by location, industry, ownership structure and access to capital. Rising operating costs, uneven cash flow, financing expenses, customer acquisition and labor shortages continue to influence business decisions. Meanwhile, growing use of AI, websites, social media and other digital tools is changing how small firms market products, improve productivity and compete for customers.
Overall, the small business landscape combines strong entrepreneurial activity with significant operating pressure. Businesses that manage costs carefully, maintain access to financing and adopt practical technology are likely to be better positioned to navigate changing market conditions and pursue sustainable growth.
