Intel enters the year at a pivotal point in its history, balancing stronger demand for AI-driven computing with the high cost of restoring leadership in advanced semiconductor manufacturing. Its processors continue to power consumer PCs, enterprise servers, and cloud infrastructure, while Intel Foundry is expanding the company’s role in contract chip manufacturing, advanced packaging, and next-generation process technology. At the same time, workforce reductions, heavy capital spending, and intense competition are reshaping the company’s financial profile. The statistics below show how Intel’s revenue, profitability, market position, manufacturing capacity, and AI strategy are evolving.
Editor’s Choice
- Intel reported $52.853 billion in 2025 revenue, compared with $53.101 billion in 2024.
- Revenue in Q2 2026 climbed 25% year over year, the company’s strongest reported quarterly growth rate in more than 15 years.
- Data Center and AI revenue surged 59% year over year in Q2 2026 as demand for server and AI-related computing strengthened.
- Intel operated 15 wafer fabs across 10 locations in its most recently published global fab count.
- Intel ended 2025 with approximately 85,100 employees, down sharply from its 2024 workforce.
- Intel 18A-P entered risk production in 2026, extending the Intel 18A process family with performance and thermal enhancements.
- Intel announced a €5 billion investment in Ireland in July 2026 to expand manufacturing capacity for Intel Xeon 6 and future Xeon products.
Recent Developments
- Q1 2026 revenue reached $13.577 billion, representing growth of 7% from Q1 2025.
- Intel followed that performance with $16.128 billion in Q2 revenue, exceeding the $13.8 billion to $14.8 billion range it had previously forecast for the quarter.
- Intel Core Ultra Series 3, its first AI PC platform built on Intel 18A, had secured more than 200 system designs by early 2026.
- More than 130 customers were adopting or testing Core Ultra Series 3 and Core Series 3 processors for edge AI and robotics applications by Q2 2026.
- Intel Foundry entered high-volume manufacturing for a subset of Core Ultra Series 3 processors using High NA EUV manufacturing technology in 2026.
- Intel launched Xeon 6+, its first server-class processor built on Intel 18A, during Q2 2026.
- The company expanded the Ethernet E835 portfolio to support speeds ranging from 10GbE to 200GbE across cloud, AI, enterprise, edge and telecommunications infrastructure.
- Intel completed the transition of Altera to an independently operated company after selling a 51% stake in a transaction that valued the FPGA business at $8.75 billion. Intel retained the remaining 49%.
- Intel also reorganized leadership in 2026, including dedicated responsibility for advanced packaging, system integration, and back-end manufacturing as the company increased its focus on foundry execution.
Company Overview and Key Intel Facts
- Robert Noyce and Gordon Moore incorporated Intel on July 18, 1968, giving the company a 58-year operating history in 2026.
- Intel began operations in August 1968 with roughly a dozen engineers working from temporary office space in Mountain View, California.
- Intel’s workforce declined from 108,900 employees at year-end 2024 to 85,100 at year-end 2025, a reduction of about 21.9%.
- Technical roles accounted for 92% of Intel’s workforce at the end of 2025, compared with 91.7% a year earlier.
- Intel directly employs about 45,000 people in the United States, underscoring the scale of its domestic engineering and manufacturing base.
- Intel’s Oregon operations employ more than 20,000 people across four campuses, representing its largest geographic concentration of facilities and talent.
- Its two Chandler, Arizona, campuses employ roughly 12,000 people involved in processor development and manufacturing.
- Intel’s India operations employ more than 13,000 people, making the country its largest design and engineering center outside the United States.
- Intel operates wafer manufacturing in the United States, Ireland, and Israel, while its broader assembly, testing, and packaging network also extends through Costa Rica, China, Malaysia, and Vietnam.
Intel Revenue and Normalized EPS Trends
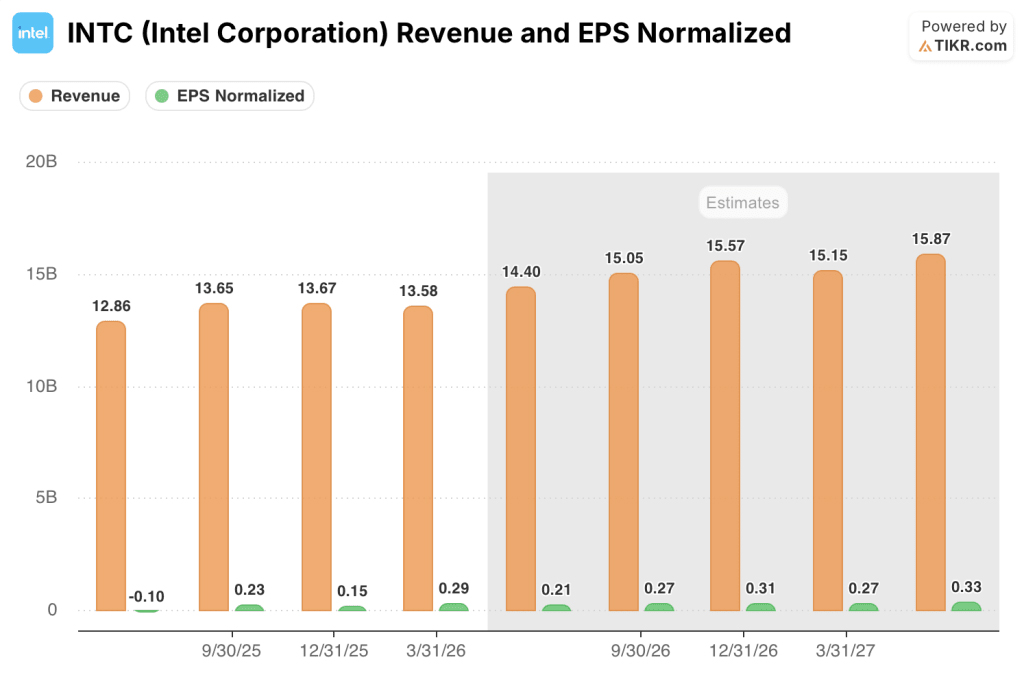
- Intel’s quarterly revenue increased from $12.86 billion in Q2 2025 to $13.65 billion in Q3 2025, representing growth of about 6.1%.
- Revenue remained relatively stable at $13.67 billion in Q4 2025 before slipping slightly to $13.58 billion in Q1 2026.
- Intel’s normalized EPS improved from a $0.10 loss per share in Q2 2025 to a positive $0.23 per share in Q3 2025.
- Normalized EPS reached $0.29 in Q1 2026, compared with $0.15 in Q4 2025, indicating stronger expected profitability entering 2026.
- Revenue is estimated to rise to $14.40 billion in Q2 2026 and $15.05 billion in Q3 2026.
- Intel’s estimated quarterly revenue is expected to peak at $15.87 billion in Q2 2027, roughly 23.4% higher than the $12.86 billion recorded in Q2 2025.
- Normalized EPS is projected to increase to $0.31 in Q4 2026, before easing to $0.27 in Q1 2027.
- By Q2 2027, Intel’s normalized EPS is estimated to reach $0.33 per share, the highest figure shown in the chart.
Earnings Per Share and Dividends of Intel
- Intel reported full-year 2025 diluted EPS of negative $0.06, compared with negative $4.38 in 2024.
- The improvement represented a $4.32-per-share reduction in Intel’s annual GAAP loss between 2024 and 2025.
- Q1 2026 GAAP EPS came in at negative $0.73, while adjusted EPS reached $0.29.
- Q2 2026 GAAP EPS fell to negative $2.16, compared with negative $0.67 in Q2 2025.
- However, Q2 2026 adjusted EPS reached $0.42, showing the large effect of items excluded from Intel’s adjusted calculation.
- For the first six months of 2026, GAAP EPS totaled negative $2.89, versus negative $0.86 in the comparable 2025 period.
- Intel’s weighted-average basic share count increased to approximately 5.11 billion shares in the first half of 2026 from 4.36 billion a year earlier.
- Intel paid no cash dividend in 2025, compared with $1.60 billion of declared dividends in 2024.
- Intel’s reported dividend yield for its 2025 equity-compensation valuation assumptions was 0%, down from 1.2% in 2024.
- For Q3 2026, management projected GAAP EPS of $0.31 and adjusted EPS of $0.38 at the midpoint of its revenue outlook.
Profitability and Margins of Intel
- Intel’s 2025 gross profit rose to $18.375 billion, up $1.03 billion from $17.345 billion in 2024.
- Gross margin improved from 32.7% in 2024 to 34.8% in 2025, an increase of 2.1 percentage points.
- Intel’s full-year operating margin improved from negative 22% in 2024 to negative 4.2% in 2025.
- The annual GAAP net loss narrowed from $18.8 billion in 2024 to $300 million in 2025.
- Q1 2026 gross margin reached 39.4%, 2.5 percentage points higher than the 36.9% recorded a year earlier.
- Q2 2026 GAAP gross margin climbed to 40.4%, compared with 27.5% in Q2 2025.
- Q2 GAAP operating margin improved by 35.8 percentage points year over year, moving from a 24.7% operating loss margin to an 11.1% positive margin.
- On a non-GAAP basis, Q2 2026 operating margin reached 17.2%, compared with negative 3.9% one year earlier.
- Intel Products achieved a 32% operating margin in Q2 2026, generating $4.817 billion of segment operating income.
Segment-Wise Revenue Breakdown of Intel
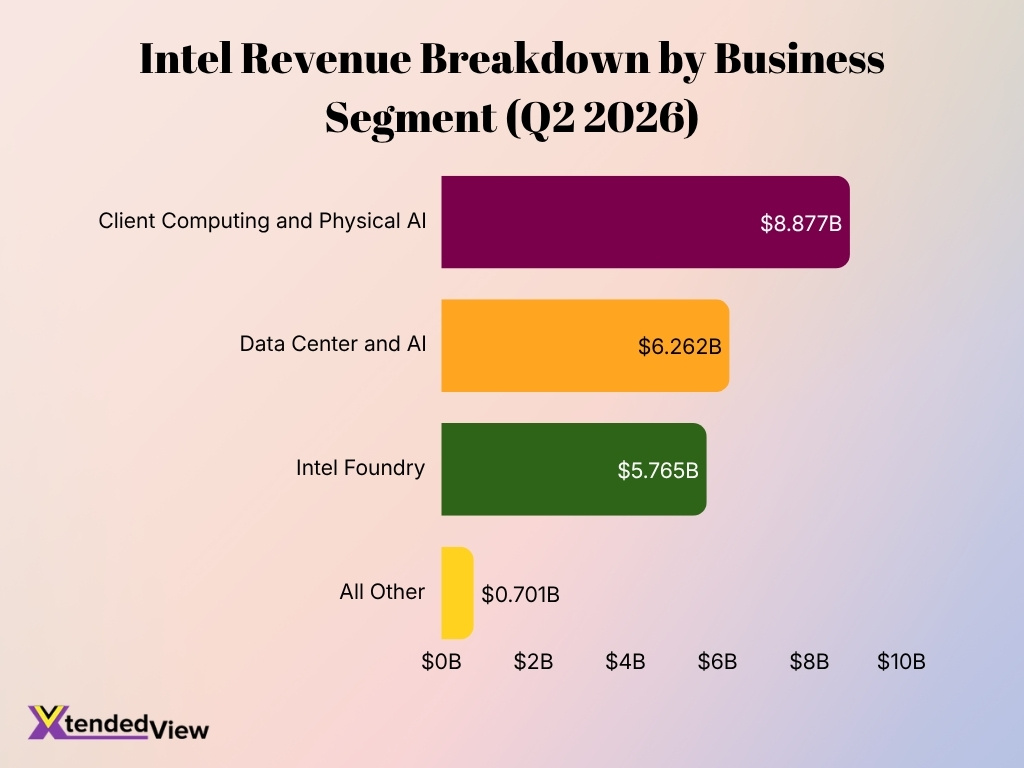
- Client Computing and Physical AI Group revenue reached $8.877 billion in Q2 2026, up from $7.871 billion a year earlier.
- The client segment accounted for roughly 55% of consolidated Q2 2026 revenue, although segment reporting includes transactions that consolidation later eliminates.
- Data Center and AI produced $6.262 billion in Q2 2026 revenue, compared with $3.939 billion in Q2 2025.
- Data Center and AI represented approximately 38.8% of consolidated quarterly revenue before adjusting for the internal reporting structure.
- Intel Foundry generated $5.765 billion in Q2 2026 segment revenue, reflecting both internal manufacturing activity and external customer business.
- Foundry revenue was approximately 35.7% of consolidated Q2 revenue on a reported segment basis, although most foundry activity still comes from transactions with Intel’s own product groups.
- Intel’s “All Other” operations generated $701 million in Q2 2026 revenue, compared with $1.053 billion in the year-earlier period.
- Data Center and AI produced $2.474 billion in Q2 segment operating income, translating into a 40% operating margin.
- The client segment generated $2.343 billion in Q2 operating income, equivalent to a 26% operating margin.
- Intel Foundry recorded a $2.089 billion operating loss during Q2 2026, showing that manufacturing remains the largest profitability challenge despite higher factory revenue.
Foundry Services and External Customer Revenue of Intel
- Intel Foundry generated $293 million in external customer revenue in Q2 2026, compared with only $22 million in Q2 2025. That represents an increase of more than 13 times year over year.
- External foundry and assembly-and-test revenue reached $467 million in the first half of 2026, versus $53 million in the first half of 2025.
- As a result, first-half external customer revenue increased by approximately 781% year over year, although it remained small relative to Intel’s internal manufacturing business.
- Full-year 2025 external foundry and assembly-and-test revenue totaled $307 million, almost double the $159 million generated in 2024.
- However, 2025 external revenue remained below the $547 million recorded in 2023, showing that Intel still has significant work ahead in rebuilding its third-party customer pipeline.
- Intel Foundry generated total segment revenue of approximately $5.77 billion in Q2 2026, with most of that revenue coming from Intel’s own product businesses rather than outside customers.
- Based on those figures, external customers represented only about 5% of Q2 Foundry segment revenue, despite the strong year-over-year increase in outside business.
- Intel Foundry reported an operating loss of approximately $2.09 billion in Q2 2026, which translates into a segment operating margin of roughly negative 36%.
- Intel’s external foundry opportunity increasingly centers on Intel 18A, advanced packaging, external wafers, and the future Intel 14A process, while management has said future manufacturing investment will remain tied closely to firm customer demand.
Global Manufacturing and Fab Capacity of Intel
- Intel’s latest published manufacturing count lists 15 wafer fabs across 10 locations worldwide.
- Its U.S. wafer-fabrication footprint spans Arizona, New Mexico and Oregon, while major overseas fab operations include Ireland and Israel.
- Intel plans to invest more than $100 billion in U.S. manufacturing and R&D across Arizona, New Mexico, Oregon and Ohio.
- Its Ohio project represents an investment of more than $28 billion for two leading-edge semiconductor fabs.
- Intel has invested about $34.5 billion in Arizona since 1979, where its operations include advanced manufacturing capacity.
- The company has invested more than $4 billion in New Mexico to expand advanced semiconductor packaging capacity, including Foveros technology.
- In July 2026, Intel announced another €5 billion, or about $5.7 billion, for its Leixlip manufacturing campus in Ireland.
- The Ireland expansion will increase production of Xeon 6 and future Xeon processors using Intel 3, while using existing cleanroom space to increase output.
- In April 2026, Intel agreed to pay $14.2 billion to repurchase the 49% interest in the Fab 34 Ireland joint venture that it did not already own.
- The original investor had contributed $11.2 billion in 2024 for that 49% interest, illustrating how Intel has used outside capital to finance manufacturing expansion.
Market Capitalization and Stock Performance of Intel
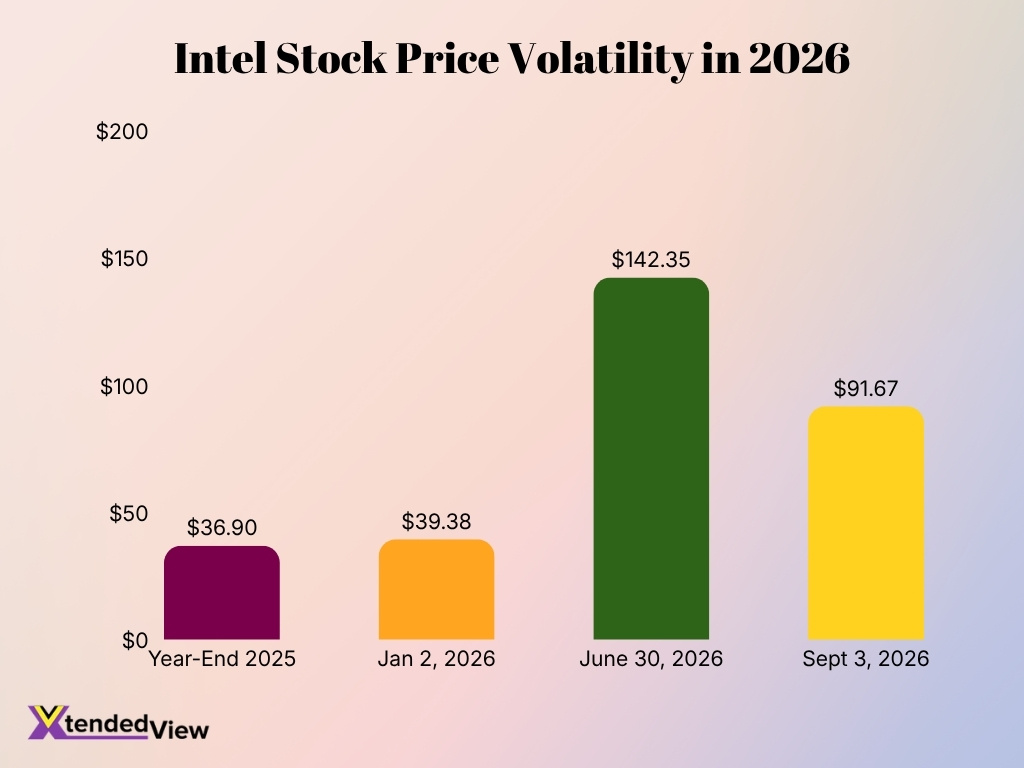
- Intel shares closed at $91.67 on Sept. 3, 2026, up 1.8% for the session.
- The stock ended 2025 at $36.90, meaning the Sept. 3 closing price represented a gain of approximately 148% in 2026.
- Intel’s market capitalization stood at approximately $480.6 billion on Sept. 3, 2026.
- Its market value increased about 351% over the preceding year, highlighting how dramatically investor expectations shifted from 2025 levels.
- Intel’s enterprise value reached roughly $501.1 billion in early September 2026.
- The stock reached a 52-week high of $142.35 on June 30, 2026, before retreating substantially.
- At $91.67 on Sept. 3, Intel traded 35.6% below that 52-week peak despite its strong year-to-date gain.
- Trading volume on Sept. 3 totaled roughly 76 million shares, below the 50-day average of about 107.3 million shares.
- Intel started the first trading session of 2026 at $37.77 and closed Jan. 2 at $39.38, already 6.7% above its final 2025 close.
Process Technology and Node Roadmap of Intel
- Intel 18A entered production in 2025, introducing RibbonFET gate-all-around transistors and PowerVia backside power delivery.
- Intel 18A can deliver up to 18% higher performance at the same power compared with Intel 3.
- At the same performance level, Intel 18A can reduce power consumption by as much as 38% versus Intel 3.
- Intel also reports up to a 30% chip-density improvement for Intel 18A compared with Intel 3.
- PowerVia can reduce worst-case dynamic voltage droop by as much as 10 times while enabling up to 11% block-level area compaction in routed designs.
- Intel 18A-P entered risk production in June 2026, adding performance and thermal improvements while remaining design-rule compatible with Intel 18A.
- Intel 18A-PT is designed to add further performance and power improvements and support Foveros Direct 3D hybrid bonding at an interconnect pitch of less than 5 micrometers.
- Intel 14A targets a 15% to 20% performance improvement at the same power compared with Intel 18A.
- Alternatively, Intel projects Intel 14A can lower power consumption by 25% to 35% at the same performance level and improve density by up to 30%.
- Intel 14A will introduce PowerDirect backside power delivery and RibbonFET 2 as the company extends its gate-all-around roadmap beyond 18A.
Data Center and AI Business Statistics of Intel
- Data Center and AI revenue reached $6.262 billion in Q2 2026, compared with $3.939 billion one year earlier.
- That represents 59% year-over-year growth, substantially faster than Intel’s consolidated growth rate.
- First-half 2026 Data Center and AI revenue increased 40% year over year.
- Server average selling prices rose 48% year over year in Q2 2026, driven mainly by a richer mix of premium products.
- Server unit volume also increased 9% year over year, helped primarily by stronger hyperscaler demand.
- Data Center and AI generated $2.474 billion in Q2 operating income, compared with about $633 million a year earlier.
- The segment’s Q2 operating margin reached 40%, making it Intel Products’ highest-margin reporting unit for the quarter.
- Other Data Center and AI revenue, including purpose-built silicon such as ASICs, reached $951 million in Q2, up $304 million year over year.
- Intel Xeon 6+ launched in Q2 2026 with configurations reaching 288 Efficient-cores, 576 MB of cache and a maximum turbo frequency of 3.2 GHz.
- The flagship Xeon 6990E+ carries a listed customer price of $14,995 and supports up to 1.5 TB of DDR5 memory, illustrating Intel’s push toward high-value cloud and AI infrastructure processors.
CPU and GPU Market Share of Intel
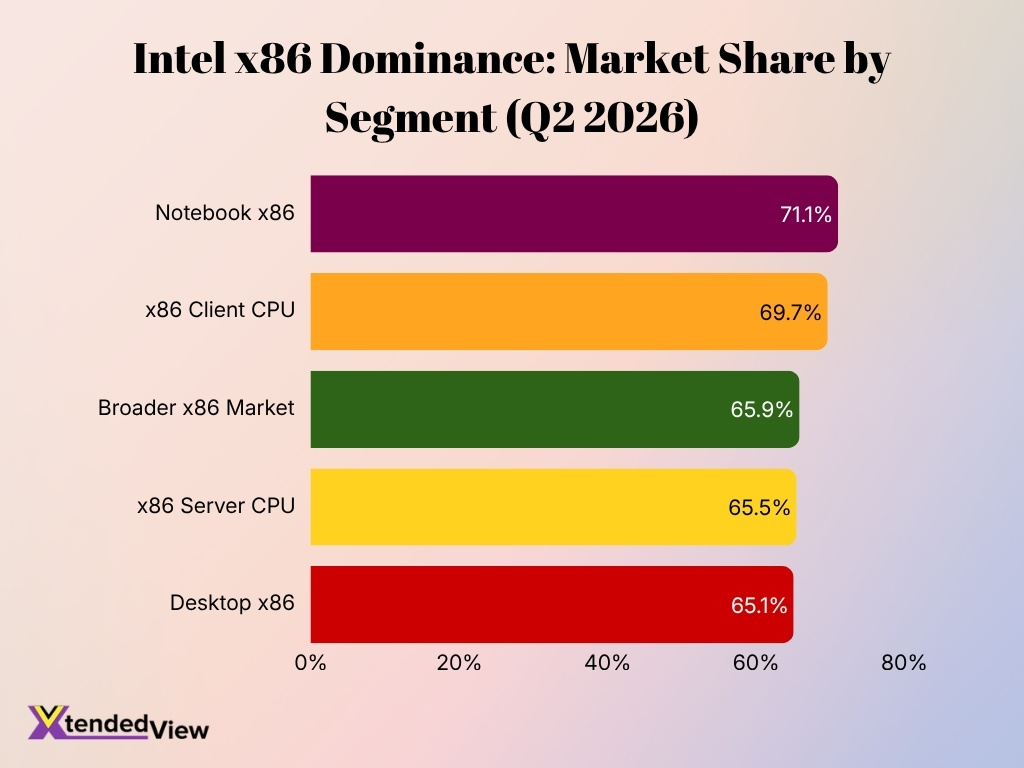
- Intel held 69.7% of x86 client CPU unit shipments in Q2 2026, down from 70.4% in Q1.
- In desktop x86 processors, Intel’s Q2 2026 unit share stood at 65.1%, compared with 66.8% in the previous quarter.
- Intel maintained a stronger 71.1% share of notebook x86 CPUs during Q2 2026.
- Its x86 server CPU unit share reached 65.5% in Q2 2026, down from 66.8% during Q1.
- Across the broader x86 market measured in Q2 2026, Intel held approximately 65.9% of unit shipments.
- In Q1 2026, Intel retained 53.8% of x86 server CPU revenue, even as its rival reached a record 46.2%.
- Intel’s Q1 2026 client CPU unit share of 70.4% had already fallen 5.5 percentage points year over year, from 75.9%.
- The global PC GPU market shipped 75.5 million GPUs in Q2 2026, up 10.4% sequentially and 1.1% year over year.
- Intel’s overall PC GPU market share fell by approximately 1 percentage point quarter over quarter in Q2 2026, while the total market expanded.
- Meanwhile, notebook GPU shipments increased 16.8% sequentially in Q2, an important trend for Intel because integrated graphics remain closely linked to its notebook CPU shipments.
Capital Expenditure and Investment Plans of Intel
- Intel made $17.7 billion in gross capital investments during 2025, slightly below its $18 billion revised spending target.
- Capital-related offsets totaled approximately $6.5 billion in 2025, reducing Intel’s effective net capital investment to roughly $11.2 billion.
- Earlier in 2025, Intel had expected gross capital expenditures of $20 billion before lowering the target to $18 billion, a $2 billion reduction.
- Intel spent $4.5 billion on gross capital expenditures in Q2 2025, with net capital expenditures of $3.1 billion for the quarter.
- Management revised its 2026 outlook in April and said capital expenditures should remain roughly flat with 2025, instead of declining as previously expected.
- Using 2025 spending as the benchmark, flat 2026 capital expenditures would imply investment of approximately $17.7 billion for the year, although the final figure will depend on capacity requirements and equipment timing.
- Intel announced a €5 billion, or approximately $5.7 billion, investment in Ireland in July 2026 to expand Xeon manufacturing capacity and related R&D activities.
- Intel has outlined plans for more than $100 billion of U.S. manufacturing and R&D investment across Arizona, New Mexico, Ohio and Oregon.
- In August 2026, Intel initially announced a $15 billion equity offering and then increased the deal to $20 billion, with estimated net proceeds of approximately $19.7 billion before any underwriter option. The company said proceeds could support capital expenditures and working capital.
Research and Development Spending by Intel
- Intel spent $13.8 billion on R&D in 2025, down from $16.5 billion in 2024.
- That represents a decline of approximately 16.4% year over year, reflecting workforce reductions, restructuring, and tighter operating-expense controls.
- R&D represented 26.1% of Intel’s 2025 revenue, compared with approximately 31.2% in 2024.
- Intel had spent $16.0 billion on R&D in 2023, meaning 2025 R&D expenditure was about $2.2 billion lower than two years earlier.
- Q2 2026 R&D expense totaled $3.368 billion, down $316 million, or 9%, from $3.684 billion in Q2 2025.
- R&D spending reached $6.743 billion during the first six months of 2026, compared with $7.324 billion in the first half of 2025.
- Therefore, first-half R&D expenditure declined by $581 million, or about 8%, primarily because of lower payroll costs and the deconsolidation of Altera.
- R&D accounted for 22.7% of first-half 2026 revenue, down from 28.7% in the same period of 2025 as revenue increased while research spending declined.
- Combined R&D and marketing, general and administrative expenses totaled $9.0 billion in the first half of 2026, down 7% year over year.
Intel Global Workforce Trends and Employee Statistics
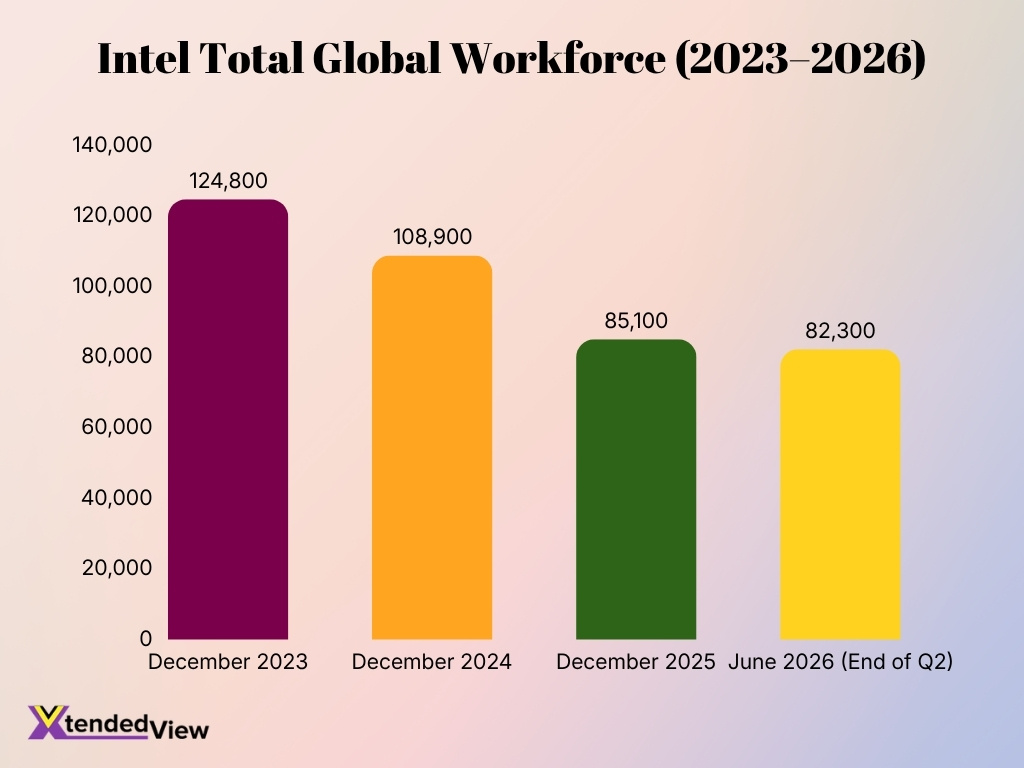
- Intel’s global workforce declined from 124,800 employees in December 2023 to 82,300 employees by the end of Q2 2026, a reduction of 42,500 workers, or about 34.1%.
- The company’s employee count fell to 108,900 in December 2024, representing a year-over-year decline of 15,900 employees, or 12.7%.
- By December 2025, Intel’s workforce had dropped further to 85,100 employees, down 23,800 employees, or 21.9%, compared with December 2024.
- During the first half of 2026, the workforce decreased by another 2,800 employees, falling from 85,100 to 82,300.
- The steepest annual workforce contraction shown in the data occurred during 2025, when Intel eliminated or shed nearly 22% of its workforce compared with the previous year.
- Overall, Intel had approximately two-thirds of its December 2023 workforce remaining by the end of Q2 2026, highlighting the scale of its multiyear workforce reduction.
Government Support and CHIPS Act Funding for Intel
- Intel originally finalized an award of up to $7.86 billion in direct commercial CHIPS Act funding for semiconductor manufacturing and advanced packaging projects.
- The commercial award supports projects across four U.S. states: Arizona, New Mexico, Ohio, and Oregon.
- By August 2025, Intel had already received and recognized approximately $2.3 billion of government incentives under the commercial funding agreement.
- In August 2025, the U.S. government agreed to invest another $8.9 billion in Intel common stock, using $5.7 billion of remaining commercial CHIPS funding and $3.2 billion related to Secure Enclave.
- The federal government agreed to acquire 433.3 million Intel shares at $20.47 each, equivalent to an initial 9.9% ownership position.
- When combined with $2.2 billion of CHIPS grants received before the equity agreement, the total announced federal investment reached $11.1 billion.
- Intel’s Secure Enclave award was originally up to $3 billion in 2024 and increased to $3.3 billion in Q2 2025 to support trusted leading-edge manufacturing for U.S. government applications.
- Intel recognized $529 million of operating-related government incentives in 2025, with most of that benefit recorded through cost of sales.
- Intel issued the government a warrant covering as many as 241 million additional shares at $20 per share if Intel were to cease owning at least 51% of its foundry business.
- Government-backed manufacturing programs remain active in 2026. Intel completed the RAMP-C program in July 2026, which helped validate domestic leading-edge manufacturing and created a pathway toward expanded Secure Enclave production.
Semiconductor Companies by Market Cap Statistics
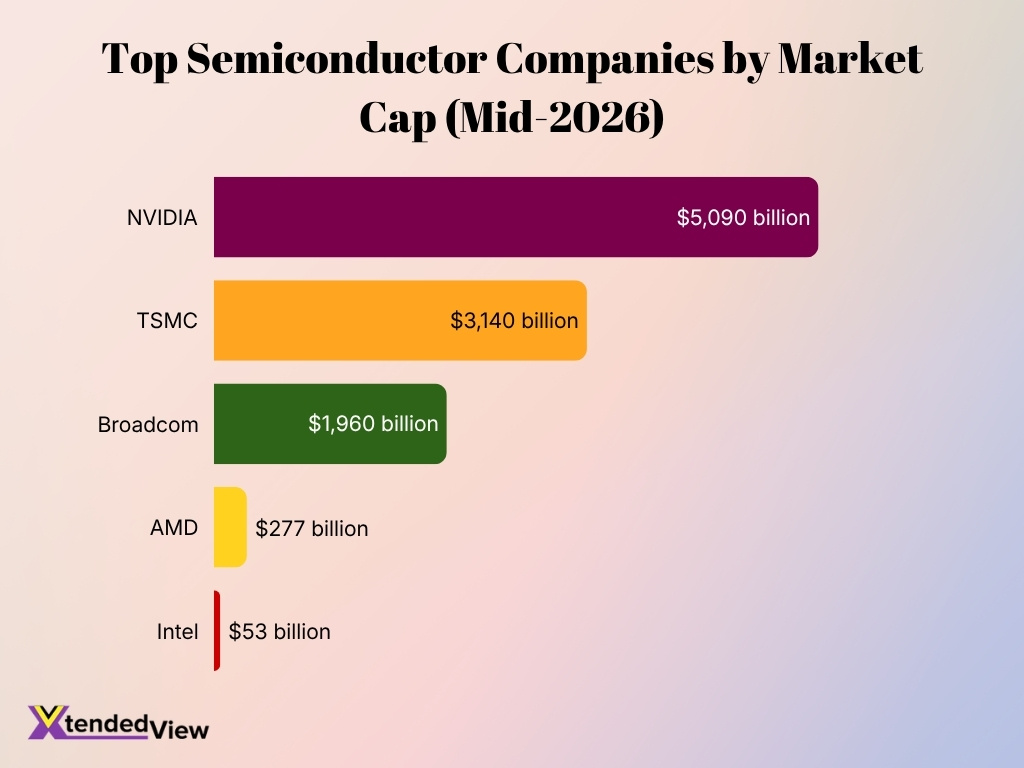
- NVIDIA leads the semiconductor industry with an estimated market capitalization of $5.09 trillion, driven primarily by its position in AI accelerators and GPUs.
- TSMC ranks second with an estimated market cap of $3.14 trillion, highlighting the enormous valuation of the world’s leading pure-play semiconductor foundry.
- Broadcom holds third place at approximately $1.96 trillion, supported by its strong presence in custom silicon and networking technologies.
- AMD has an estimated market capitalization of $277 billion, significantly below the three largest semiconductor companies despite competing across CPUs, GPUs, and AI accelerators.
- Intel has the smallest market capitalization among the five companies at approximately $53 billion, with its business spanning both semiconductor design and manufacturing.
- NVIDIA’s $5.09 trillion valuation is roughly 1.6 times TSMC’s estimated $3.14 trillion market capitalization.
- The valuation gap between NVIDIA and Intel is particularly substantial, with NVIDIA’s market cap approximately 96 times larger based on the provided mid-2026 estimates.
- The figures demonstrate a major valuation concentration around companies exposed to AI computing, advanced chip manufacturing, and custom silicon, with NVIDIA, TSMC, and Broadcom occupying the top three positions.
Frequently Asked Questions (FAQs)
Intel generated approximately $52.85 billion in revenue in 2025.
Intel reported approximately $16.13 billion in Q2 2026 revenue.
Intel’s Data Center and AI revenue reached approximately $6.26 billion, representing about 59% year-over-year growth in Q2 2026.
Intel ended 2025 with approximately 85,100 employees, down about 21.9% from 108,900 employees at the end of 2024.
Intel spent approximately $13.8 billion on research and development in 2025, equivalent to about 26.1% of annual revenue.
Conclusion
Intel statistics show a company gaining momentum in revenue growth and data center demand while still facing substantial execution and profitability challenges. Intel 18A production, stronger Xeon sales, higher external foundry revenue and continued investment in U.S. and European manufacturing create important long-term opportunities, but foundry losses, high capital requirements and aggressive competition remain significant pressure points.
The company’s next phase will depend on whether it can convert these investments into sustained margins, larger external manufacturing contracts and stronger positions in AI, servers and advanced process technology. If Intel can improve foundry economics while maintaining product growth, it could mark an important turning point in its broader restructuring and manufacturing strategy.